The transverse-momentum ($p_{\rm T}$) spectra of ${\rm K}^*(892)^0$ and $\phi(1020)$ measured with the ALICE detector up to $p_{\rm T}$ = 16 GeV/$c$ in the rapidity range $-1.2 <~ y <~ 0.3$, in p-Pb collisions at the center-of-mass energy per nucleon-nucleon collision $\sqrt{s_{\rm NN}}$ = 5.02 TeV are presented as a function of charged particle multiplicity and rapidity. The measured $p_{\rm T}$ distributions show a dependence on both multiplicity and rapidity at low $p_{\rm T}$ whereas no significant dependence is observed at high $p_{\rm T}$. A rapidity dependence is observed in the $p_{\rm T}$-integrated yield (d$N$/d$y$), whereas the mean transverse momentum ($\left<~ p_{\rm T} \right>$) shows a flat behavior as a function of rapidity. The rapidity asymmetry ($Y_{\rm asym}$) at low $p_{\rm T}$ ( <~ 5 GeV/$c$) is more significant for higher multiplicity classes. At high $p_{\rm T}$, no significant rapidity asymmetry is observed in any of the multiplicity classes. Both ${\rm K}^*(892)^0$ and $\phi(1020)$ show similar $Y_{\rm asym}$. The nuclear modification factor ($Q_{\rm CP}$) as a function of $p_{\rm T}$ shows a Cronin-like enhancement at intermediate $p_{\rm T}$, which is more prominent at higher rapidities (Pb-going direction) and in higher multiplicity classes. At high $p_{\rm T}$ (> 5 GeV/$c$), the $Q_{\rm CP}$ values are greater than unity and no significant rapidity dependence is observed.
Eur. Phys. J. C 83 (2023) 540
HEP Data
e-Print: arXiv:2204.10263 | PDF | inSPIRE
CERN-EP-2022-067
Figure group
Figure 1
Invariant-mass distributions after combinatorial background subtraction for ${\rm K^{*0}}$ and $\phi$ candidates in the multiplicity class 0$-$10% and transverse momentum range 2.2 $\leq$ $p_{\mathrm{T}}$ $<$ 3.0 GeV/$c$ in the rapidity interval -0.3 $< y <$ 0 (panels (a) and (b)) and 0 $< y <$ 0.3 (panels (c) and (d)). The ${\rm K^{*0}}$ peak is described by a Breit-Wigner function whereas the $\phi$ peak is fitted with a Voigtian function. The residual background is described by a polynomial function of order 2. |  |
Figure 2
Top panels: The transverse momentum spectra of ${\rm K^{*0}}$ for five rapidity intervals within $-$1.2 $< y < $ 0.3 and for two multiplicity classes (0$-$10%, 40$-$100%) in p$-$Pb collisions at $\sqrt{s_{\rm NN}}$ = 5.02 TeV. The data for different rapidity intervals are scaled for better visibility. Bottom panels: The ratios of the $p_{\rm T}$ spectra in various rapidity intervals to that in the interval 0 $< y < $ 0.3 for a given multiplicity class. The statistical and systematic uncertainties are shown as bars and boxes around the data points, respectively. | 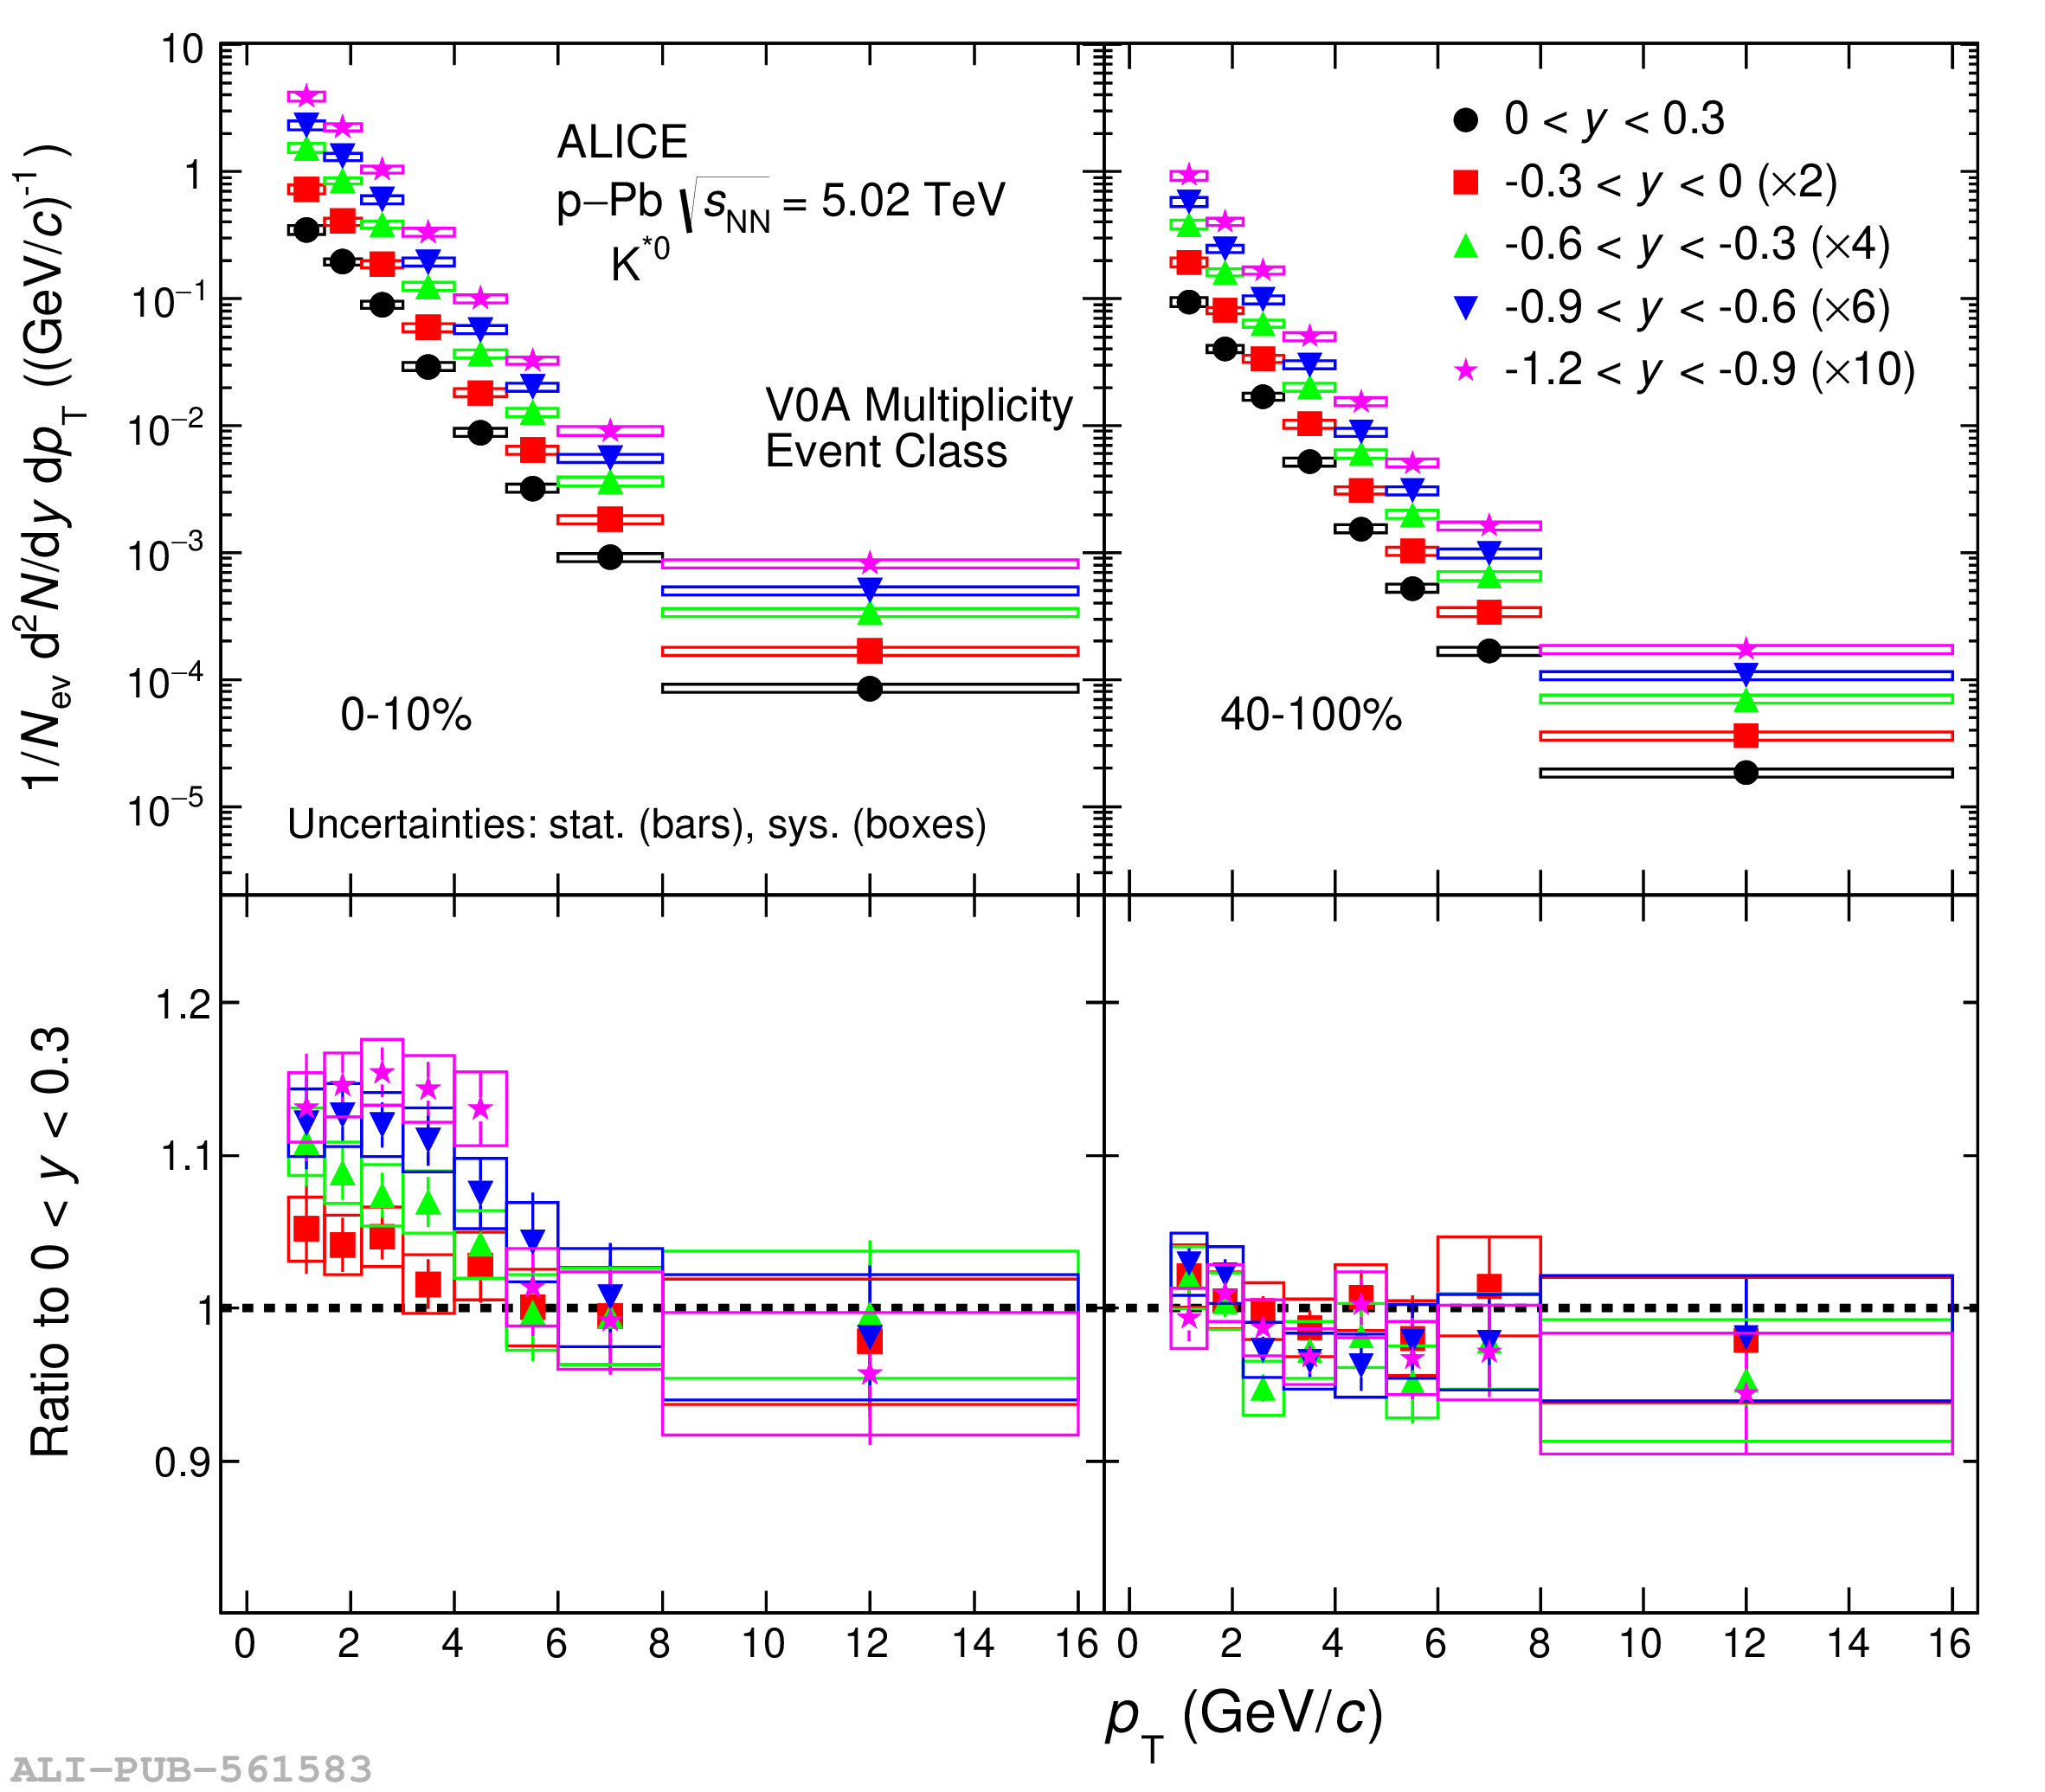 |
Figure 3
Top panels: The transverse momentum spectra of $\phi$ for five rapidity intervals within $-$1.2 $< y < $ 0.3 and for two multiplicity classes (0$-$10%, 40$-$100%) in p$-$Pb collisions at $\sqrt{s_{\rm NN}}$ = 5.02 TeV}. The data for different rapidity intervals are scaled for better visibility. Bottom panels: The ratios of the $p_{\rm T}$ spectra in various rapidity intervals to that in the interval 0 $< y < $ 0.3 for a given multiplicity class. The statistical and systematic uncertainties are shown as bars and boxes around the data points, respectively. | 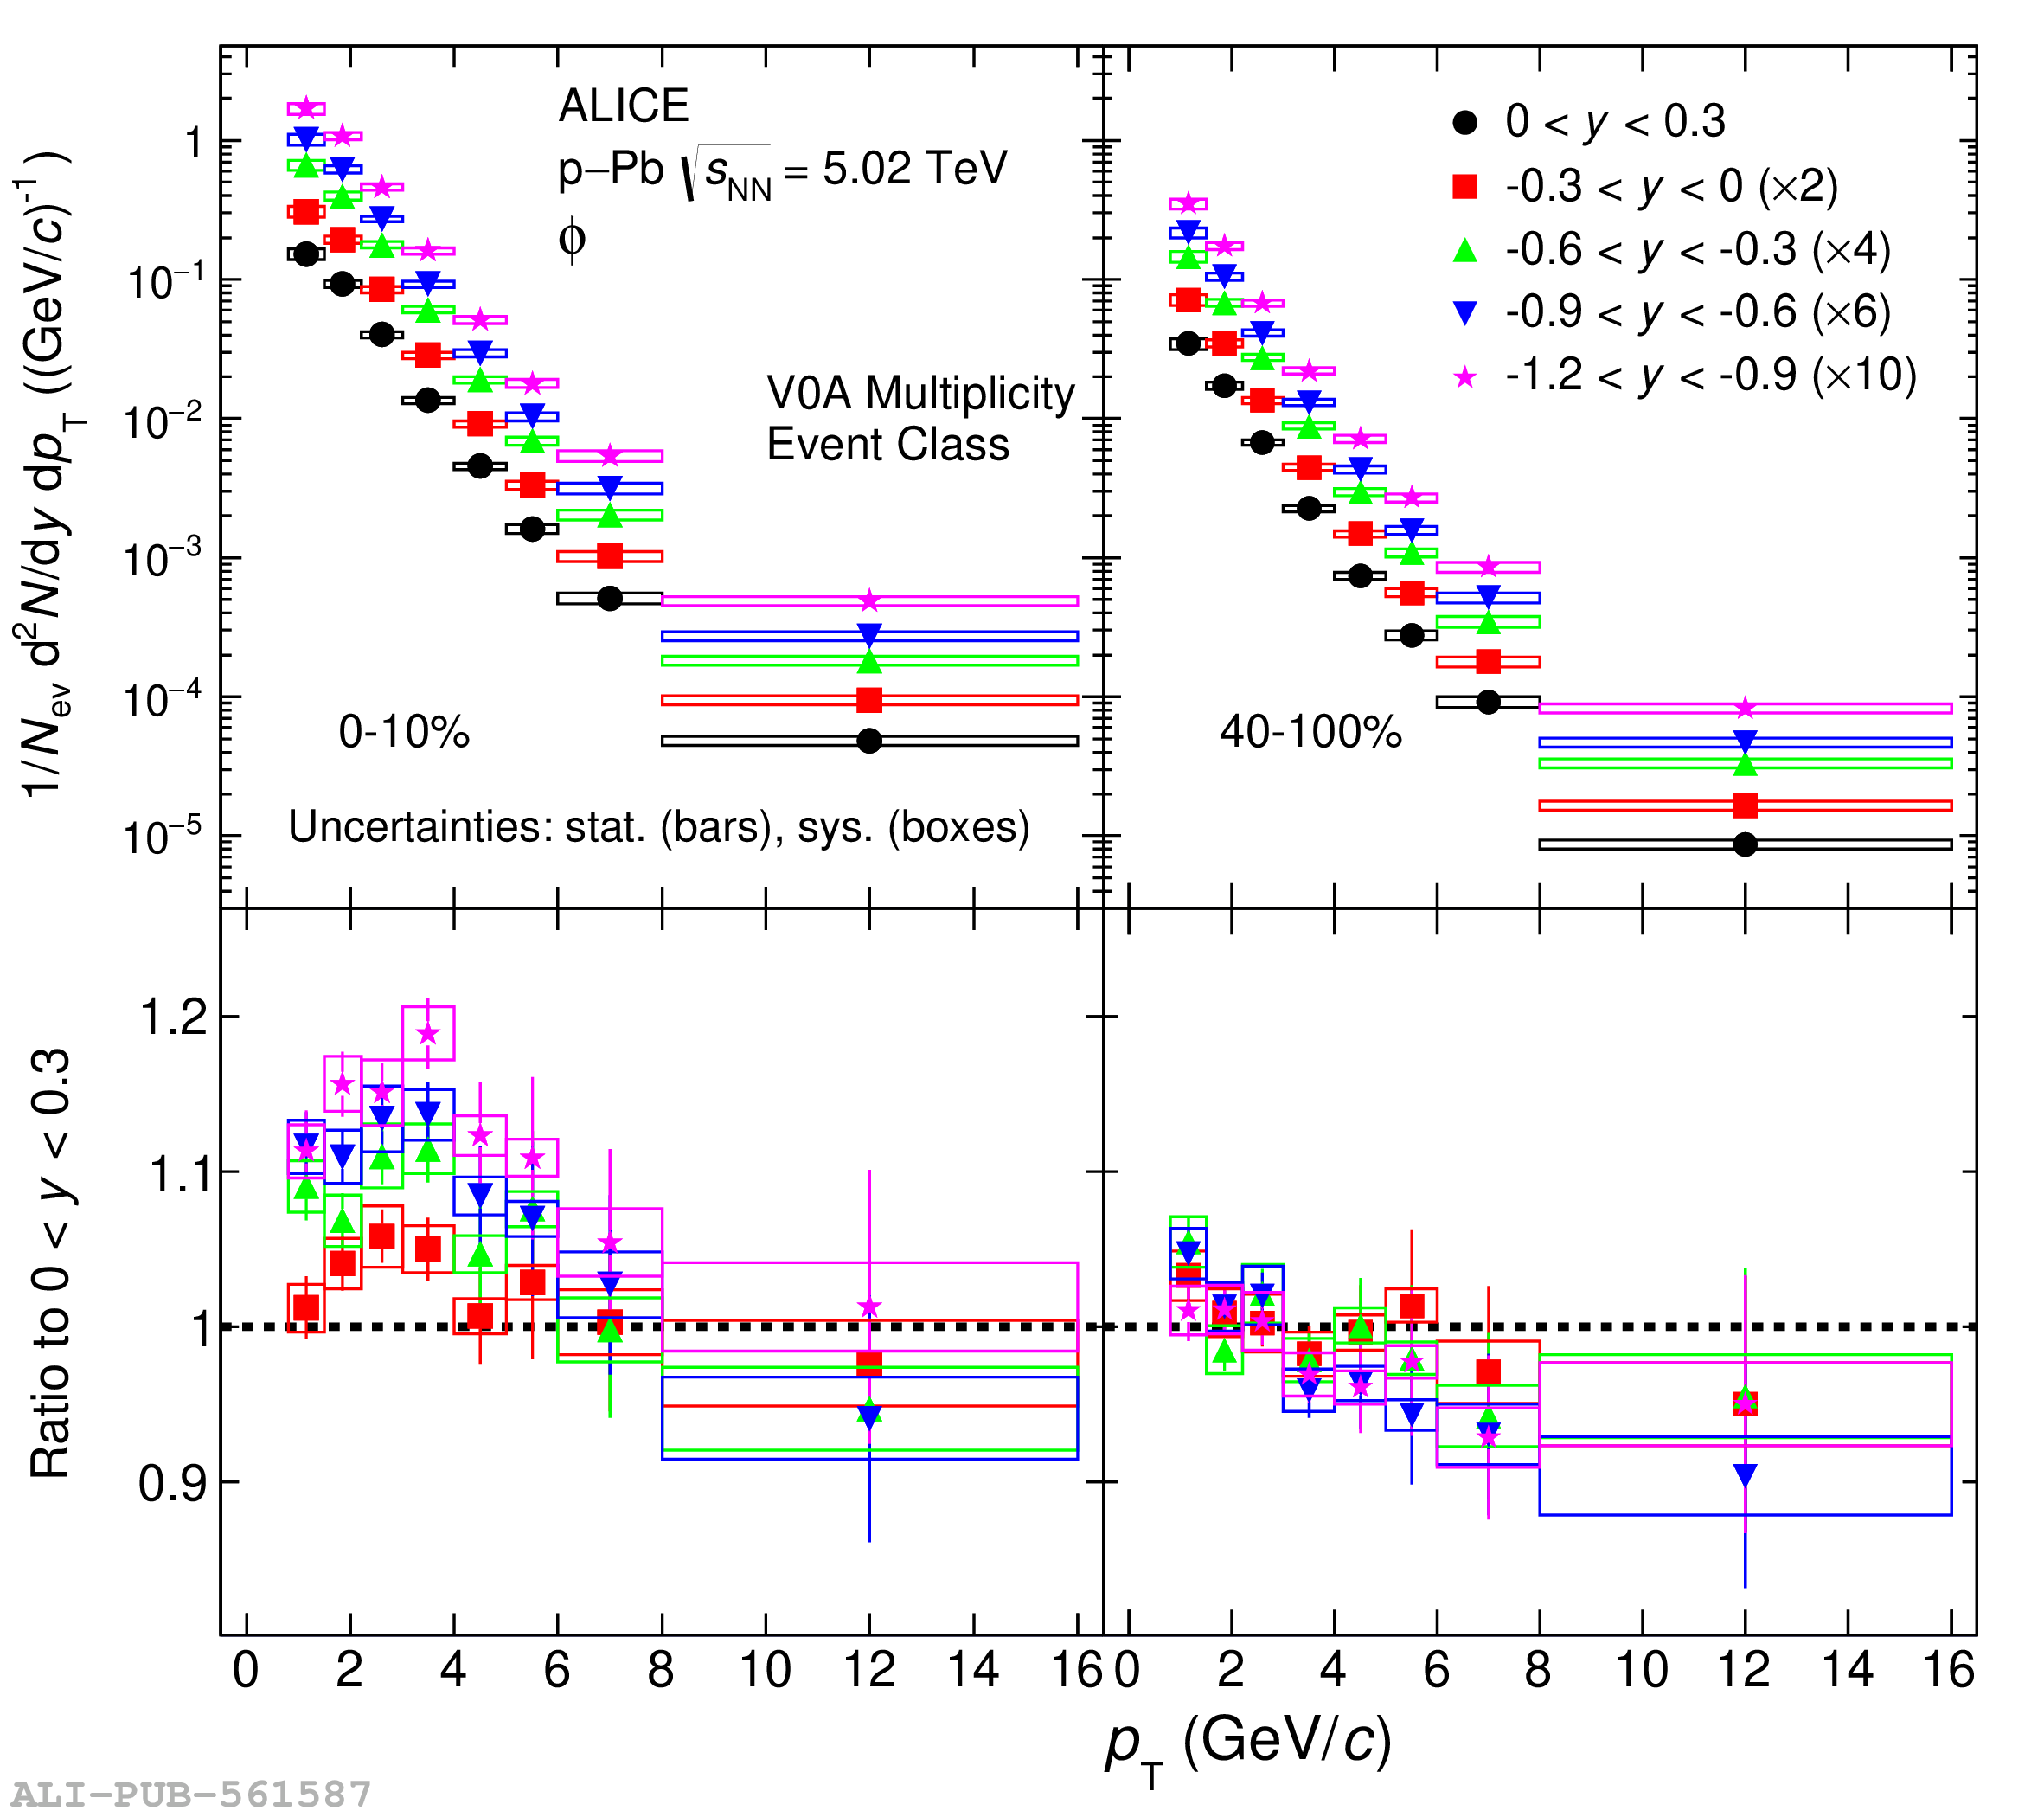 |
Figure 4
The $p_{\rm T}$ integrated yield (d$N/\mathrm{d}y$) (top panels) and mean transverse momentum ($\langle p_{\mathrm{T}} \rangle$) (bottom panels) for ${\rm K^{*0}}$ (left) and $\phi$ (right) mesons as a function of $y$ measured for the multiplicity class 0$-$100$\%$ in p$-$Pb collisions at $\sqrt{s_{\rm NN}}$ = 5.02 TeV. The predictions from EPOS-LHC, EPOS3 with and without UrQMD, DPMJET, HIJING, and PYTHIA8/Angantyr are shown as different curves. The statistical uncertainties are represented as bars whereas the boxes indicate total systematic uncertainties. | 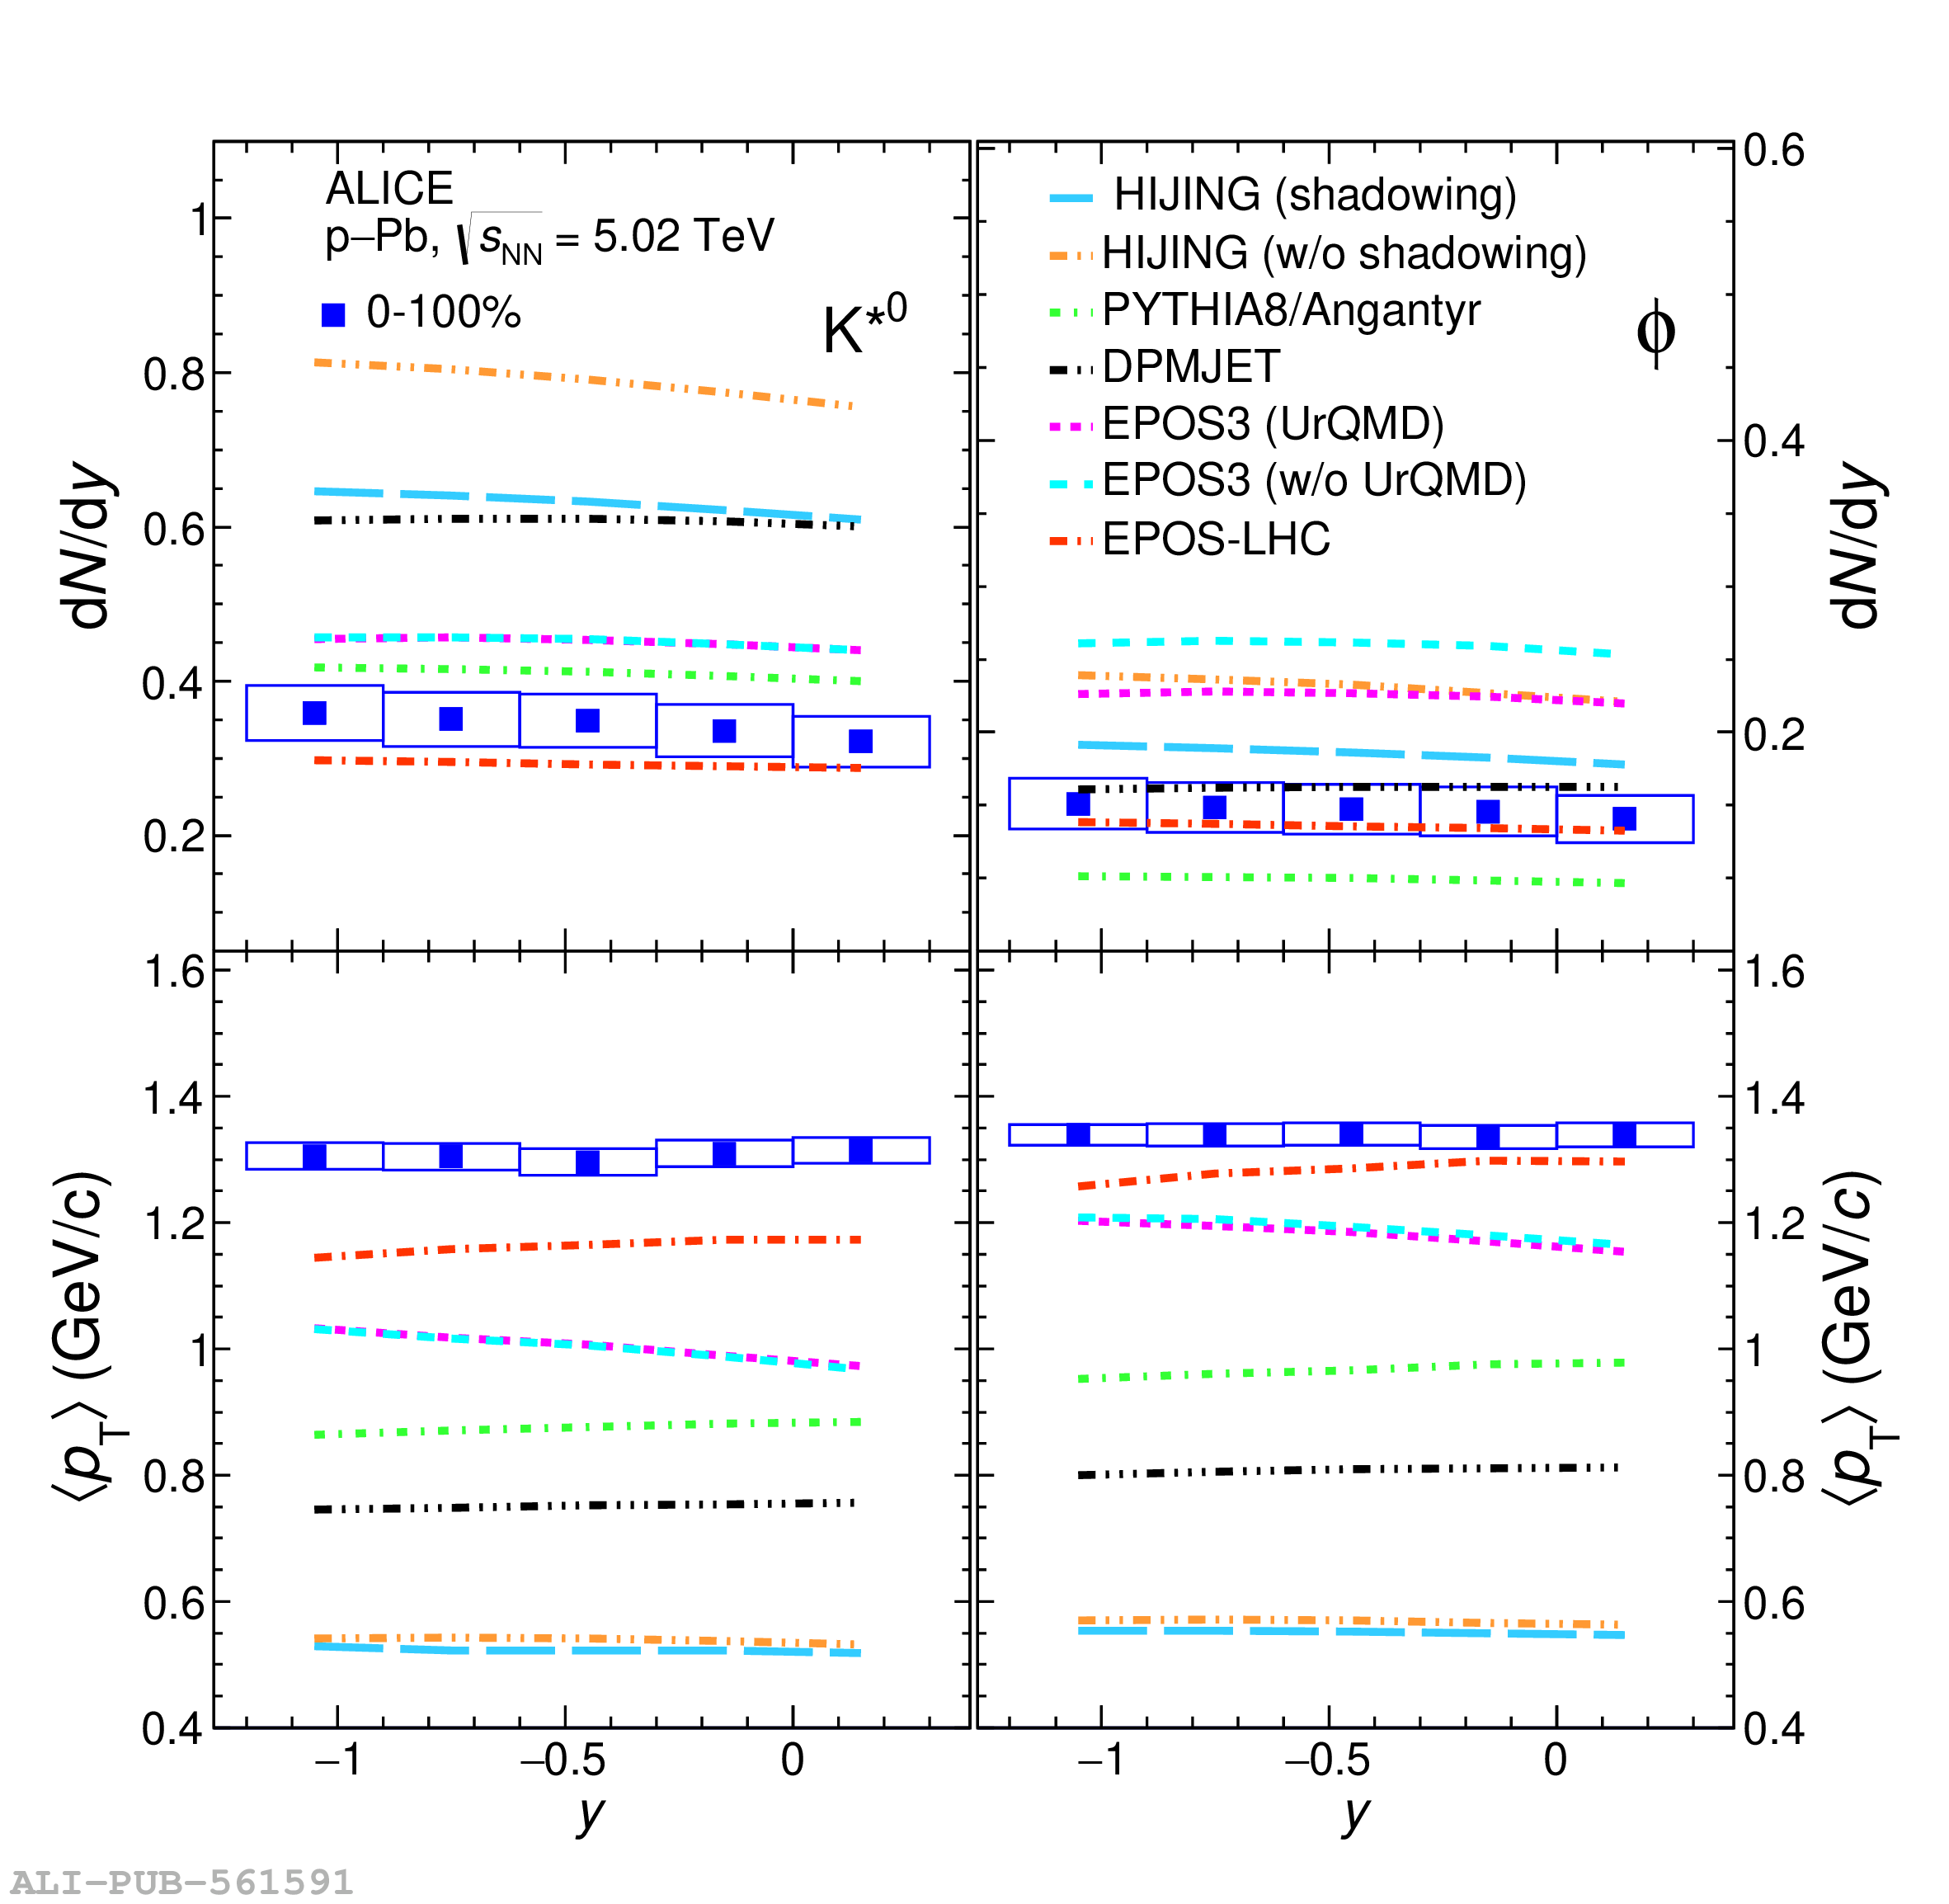 |
Figure 5
The $p_{\rm T}$ integrated yield (d$N/\mathrm{d}y$) (upper panels) and mean transverse momentum $\left(\langle\pt\rangle\right)$ (bottom panels) for ${\rm K^{*0}}$ (left) and $\phi$ (right) mesons as a function of $y$, divided by the d$N/\mathrm{d}y$ and $\langle p_{\mathrm{T}} \rangle$ at $y = 0$ for the multiplicity class 0$-$100$\%$ in p$-$Pb collisions at $\sqrt{s_{\rm NN}}$ = 5.02 TeV. The predictions from EPOS-LHC, EPOS3 with and without UrQMD, DPMJET, HIJING, and PYTHIA8/Angantyr are shown as different curves. The statistical uncertainties are represented as bars whereas the boxes indicate total systematic uncertainties. |  |
Figure 6
Rapidity asymmetry ($Y_\mathrm{asym}$) of K$^{*0}$ (red circles) and $\phi$ (blue squares) meson production as a function of $p_\mathrm{T}$ in the rapidity range 0 $<$ $|y|$ $<$ 0.3 for various multiplicity classes in p$-$Pb collisions at $\sqrt{s_{\rm NN}}$ = 5.02 TeV. The statistical uncertainties are shown as bars whereas the boxes represent the systematic uncertainties on the measurements. | 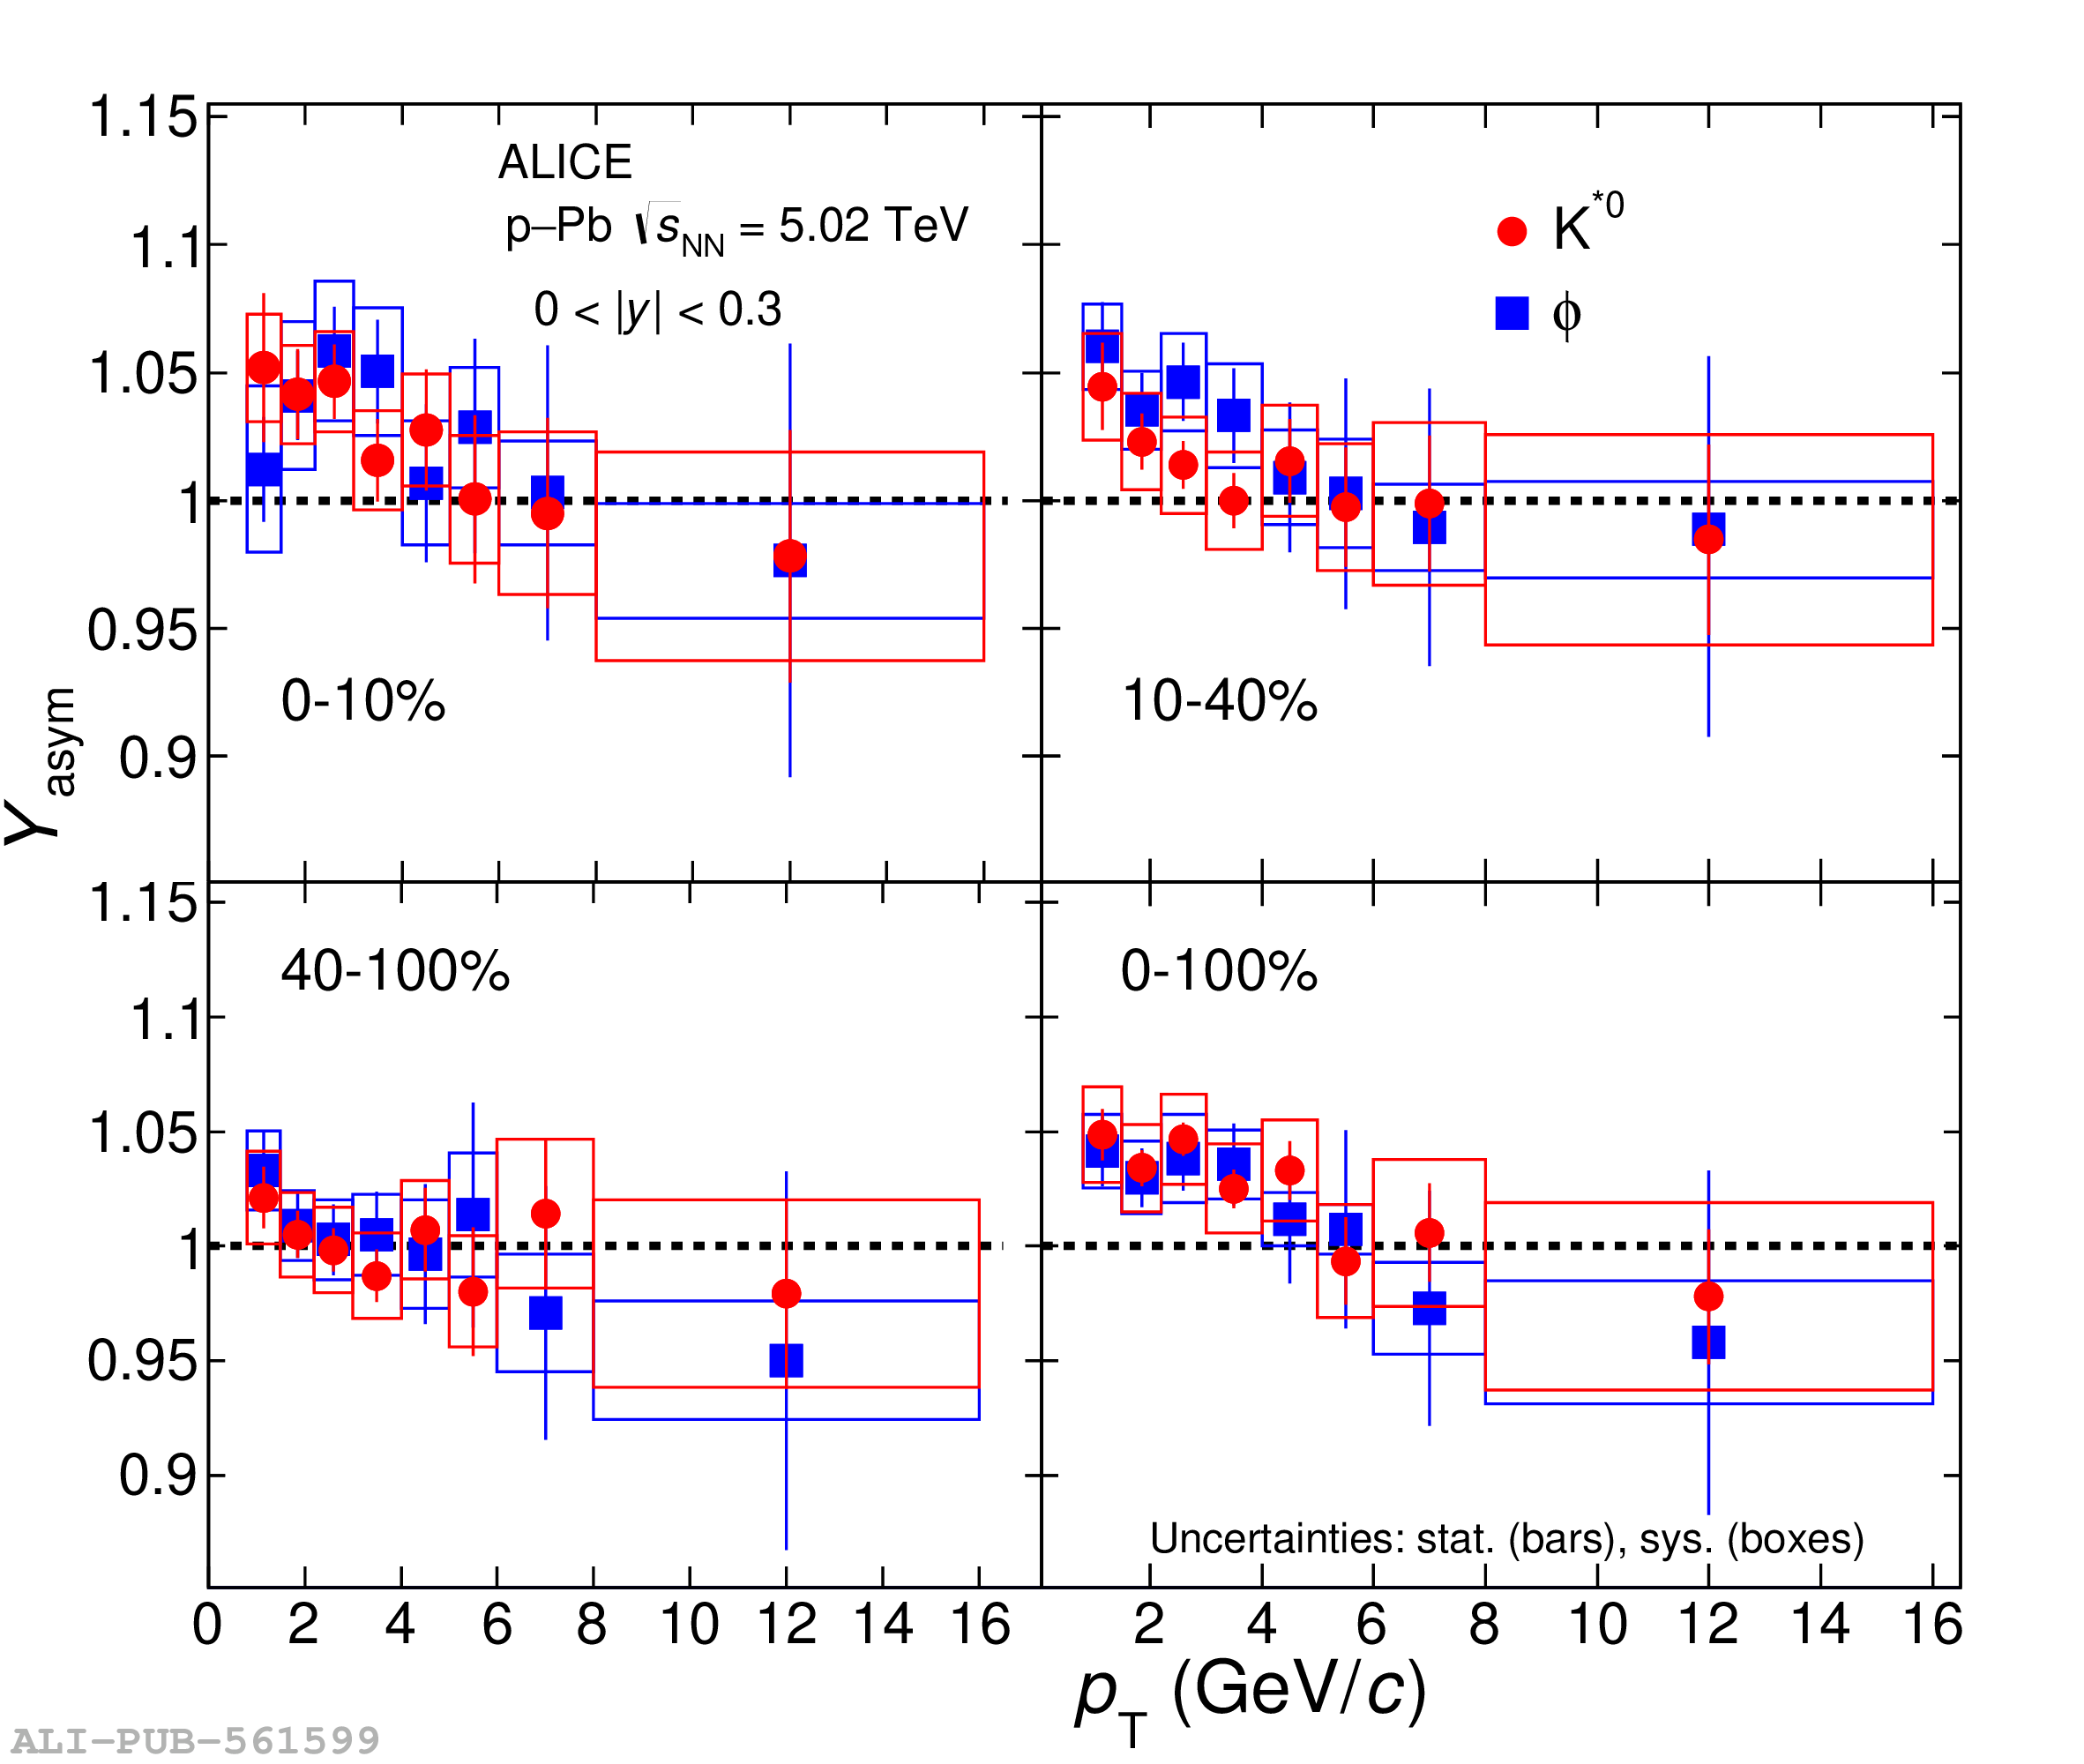 |
Figure 7
The comparison of experimental results of $Y_\mathrm{asym}$ for ${\rm K^{*0}}$ and $\phi$ meson production as a function of $p_\mathrm{T}$ in the rapidity range 0 $< |y| <$ 0.3 with the model predictions from EPOS-LHC, EPOS3 with and without UrQMD, DPMJET, HIJING, and PYTHIA8/Angantyr. Data points are shown with blue markers, and model predictions are shown by different color bands, where bands represent the statistical uncertainity of the model. The statistical uncertainties on the data points are represented as bars whereas the boxes indicate total systematic uncertainties. | 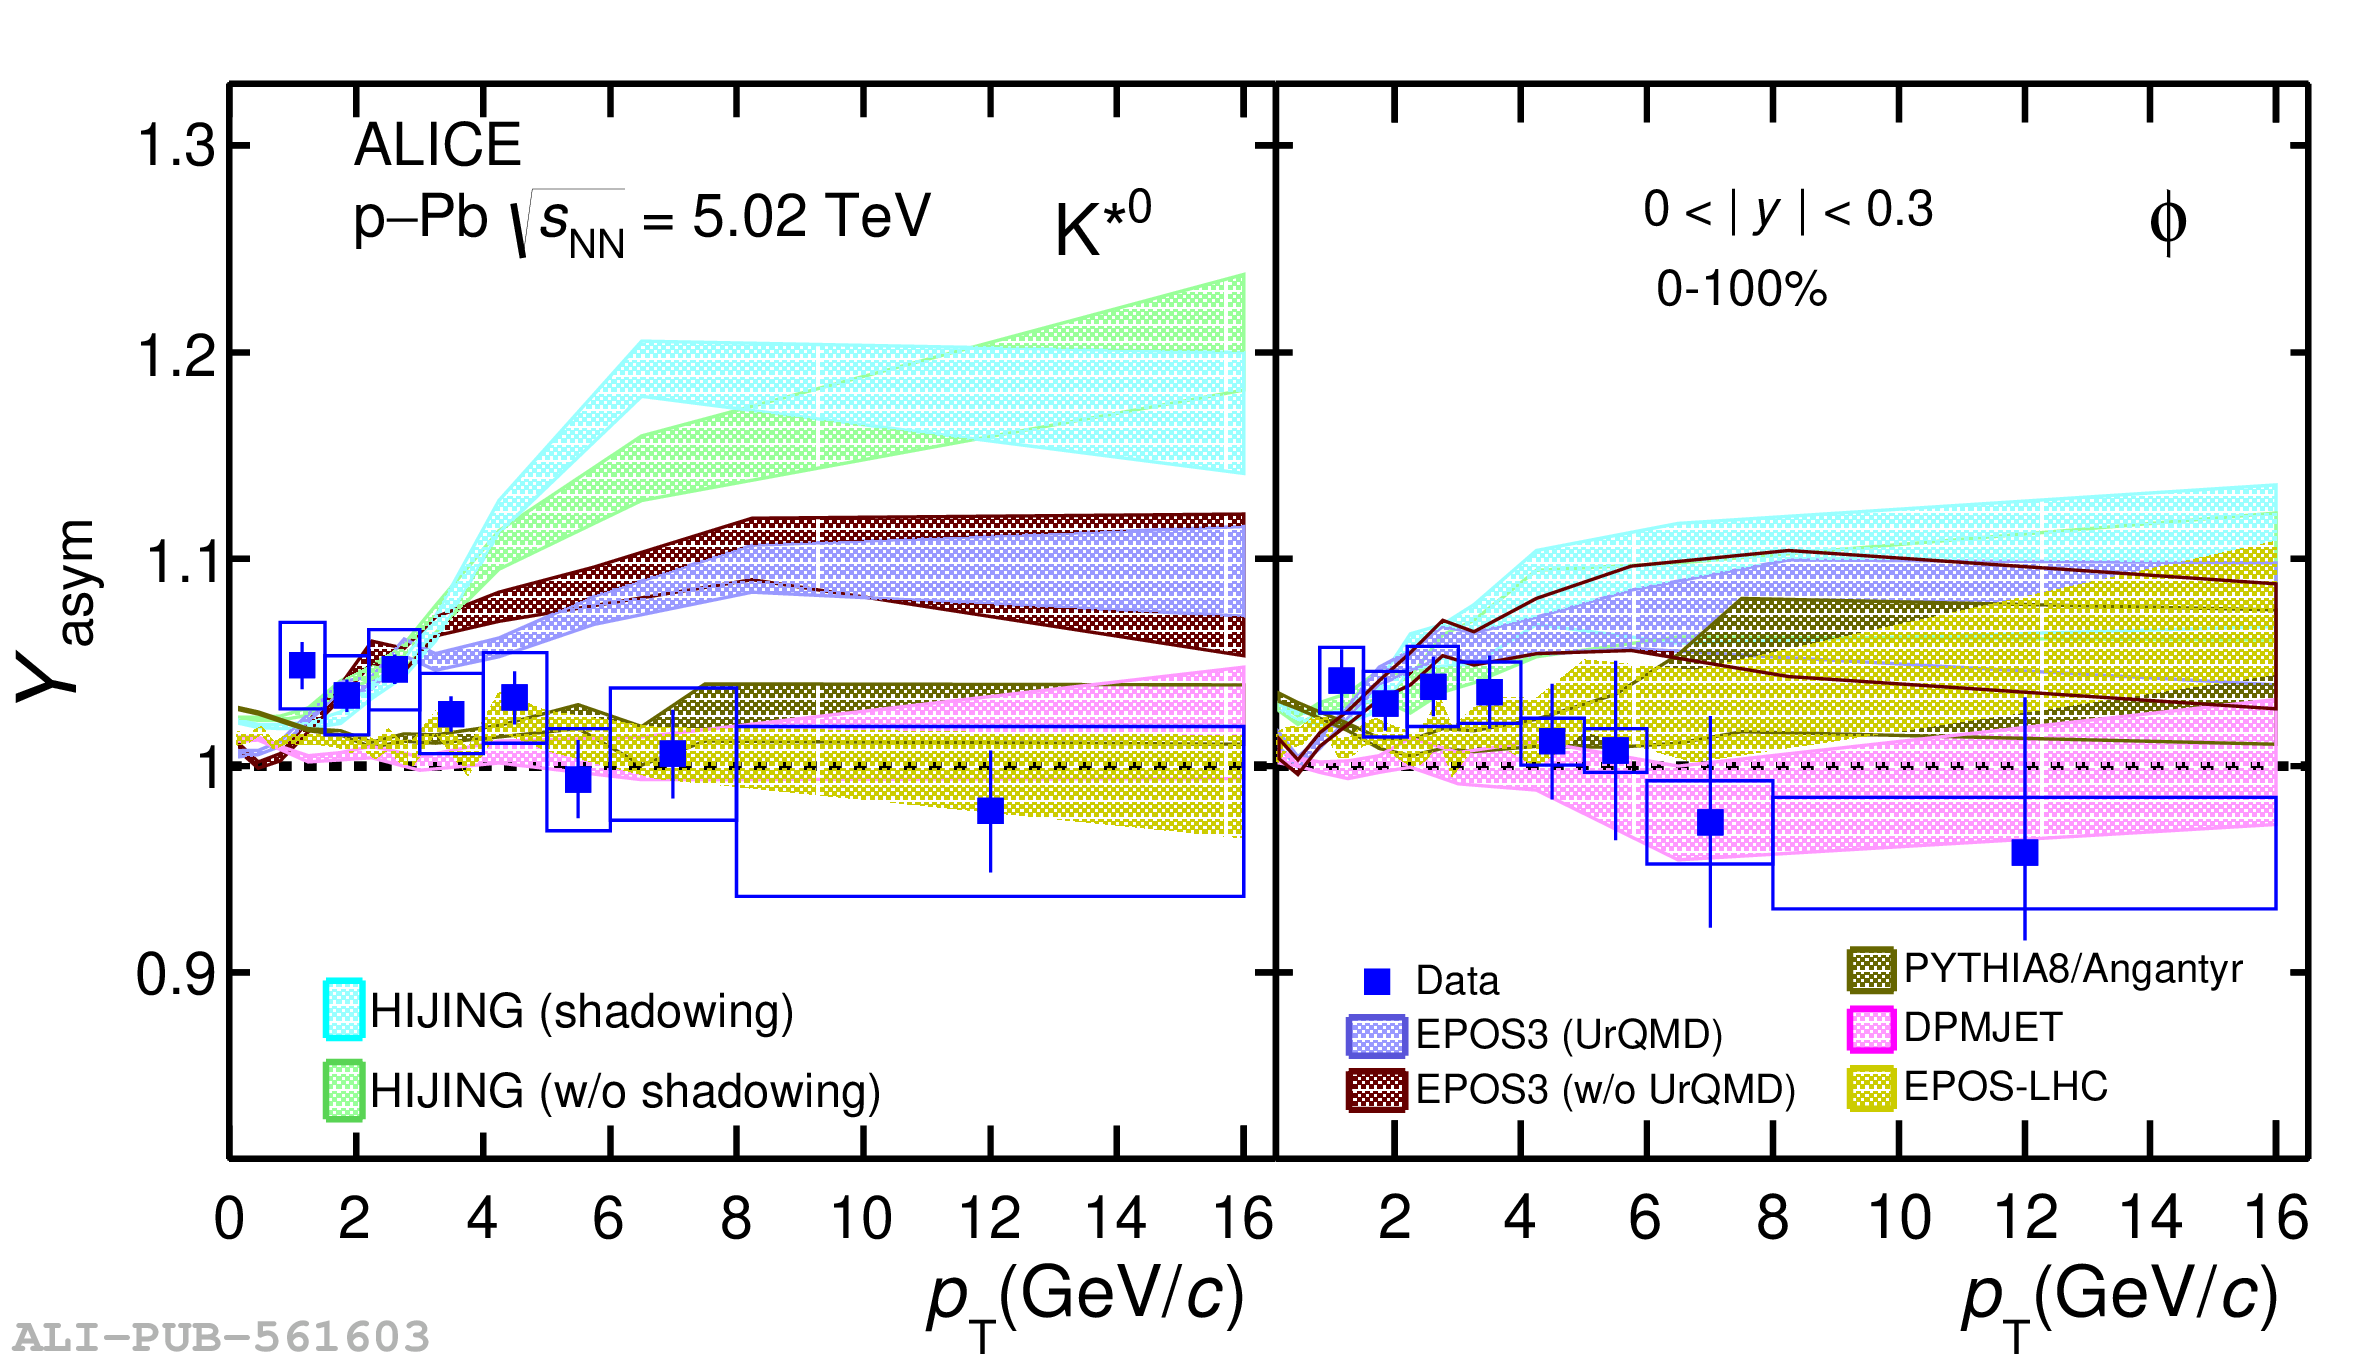 |
Figure 8
The ${Q}_\mathrm{CP}$ of ${\rm K^{*0}}$ (red circles) and $\phi$ (blue squares) mesons as a function of $\pt$ for 0$-$10$\%$ / 40$-$100$\%$ (top panels) and 10$-$40$\%$ / 40$-$100$\%$ (bottom panels) in various rapidity intervals within the range $-$1.2 $<$ $y$ $<$ 0.3 in p$-$Pb collisions at $\sqrt{s_{\rm NN}}$ = 5.02 TeV. The statistical and systematic uncertainties are represented by vertical bars and boxes, respectively. | 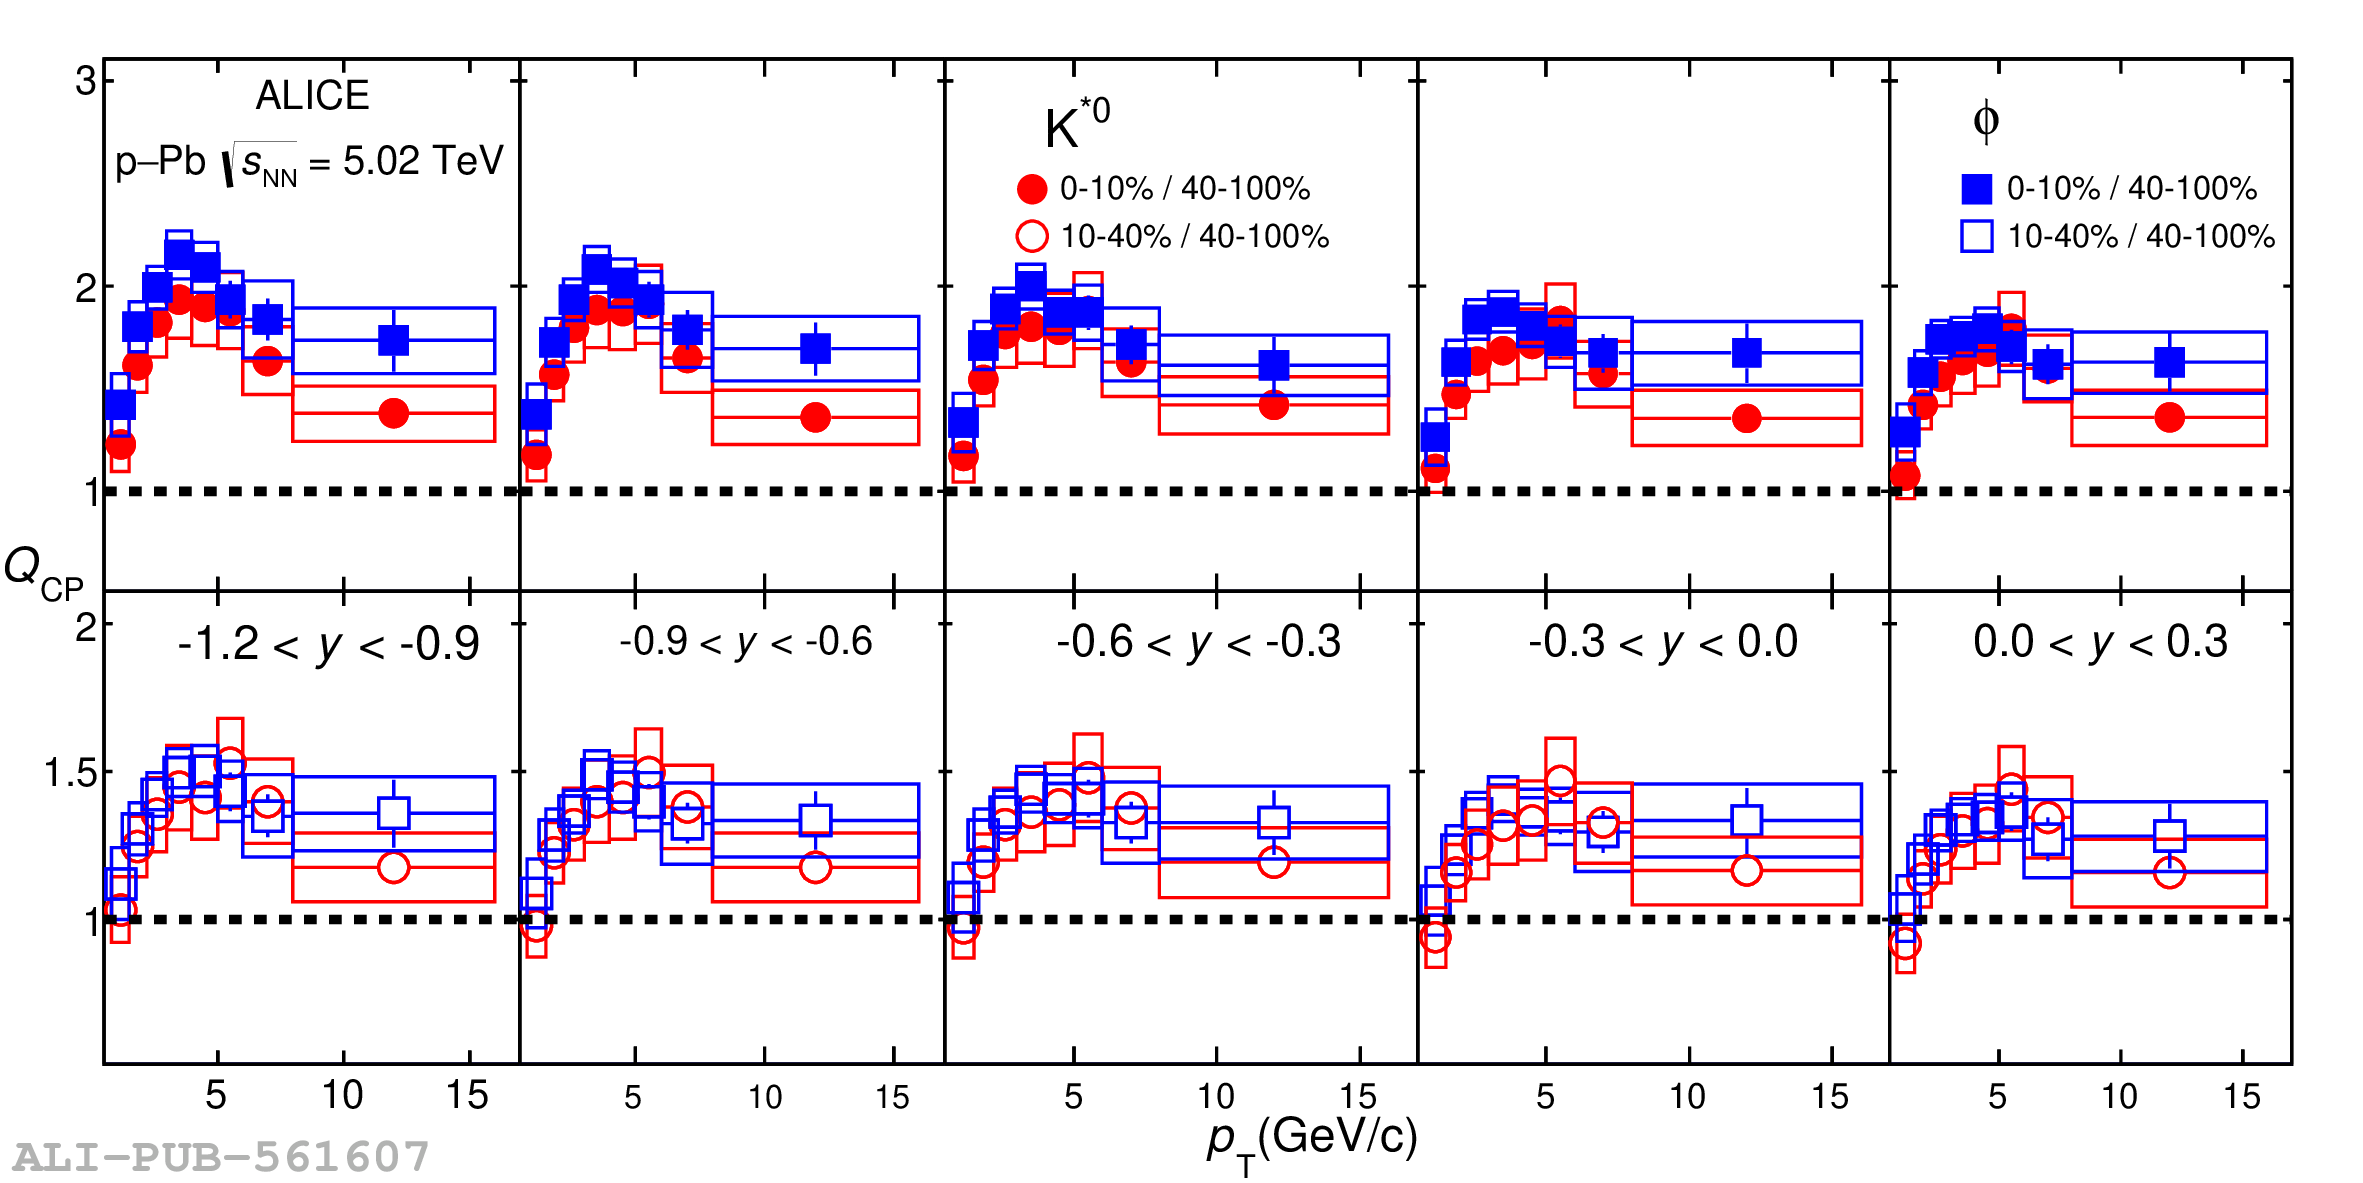 |
Figure 9
The $Q_\mathrm{CP}$ of ${\rm K^{*0}}$ (red circles) and $\phi$ (blue squares) mesons as a function of rapidity for 0$-$10$\%$ / 40$-$100$\%$ (solid markers) and 10$-$40$\%$ / 40$-$100$\%$ (open markers) in p$-$Pb collisions at $\sqrt{s_{\rm NN}}$ = 5.02 TeV. The solid and doted lines represents the linear fit to data. The statistical and systematic uncertainties are represented by vertical bars and boxes on the measurements, respectively. |  |
Figure A.1
The $p_{\rm T}$ integrated yield (d$N/\mathrm{d}y$) (top panels) and mean transverse momentum $\left(\langle\pt\rangle\right)$ (bottom panels) for ${\rm K^{*0}}$ (left panels) and $\phi$ (right panels) mesons as a function of $y$ measured for the multiplicity classes 0$-$10$\%$, 10$-$40$\%$ and 40$-$100$\%$ in p$-$Pb collisions at $\sqrt{s_{\rm NN}}$ = 5.02 TeV. The statistical uncertainties are represented as bars whereas boxes indicate the total systematic uncertainties on the measurements. | 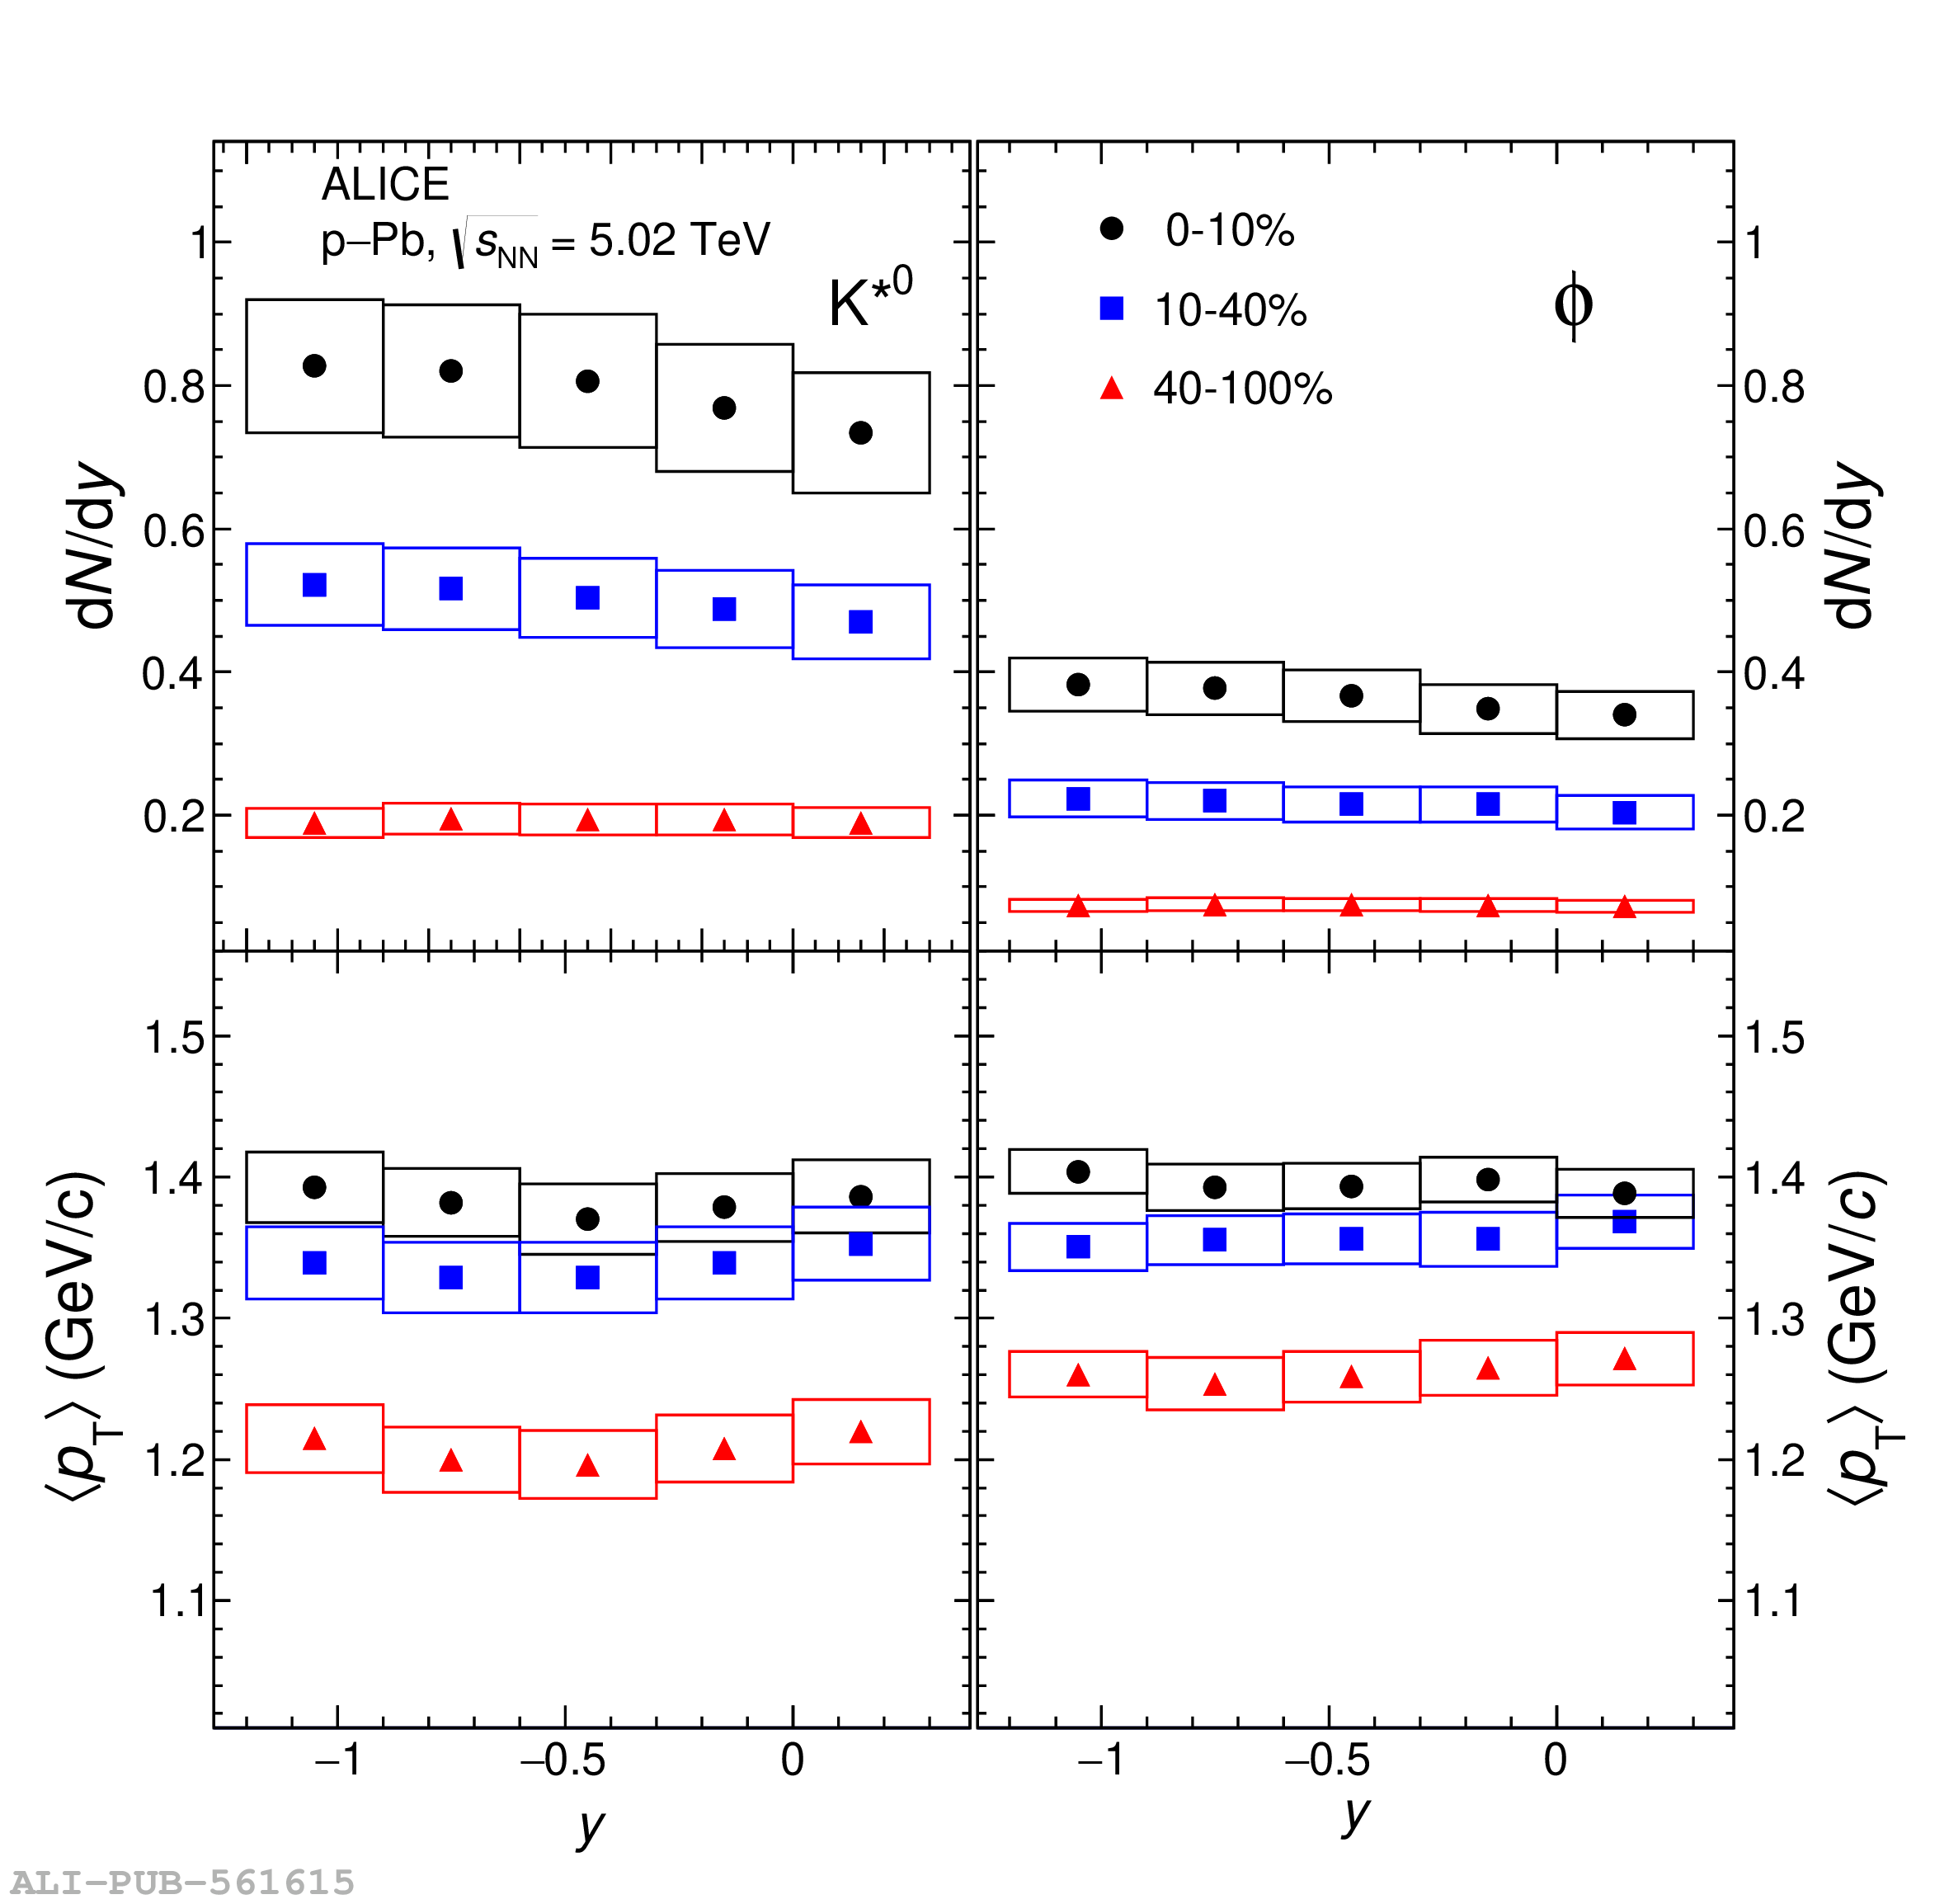 |