The ${Q}_\mathrm{CP}$ of ${\rm K^{*0}}$ (red circles) and $\phi$ (blue squares) mesons as a function of $\pt$ for 0$-$10$\%$ / 40$-$100$\%$ (top panels) and 10$-$40$\%$ / 40$-$100$\%$ (bottom panels) in various rapidity intervals within the range $-$1.2 $<$ $y$ $<$ 0.3 in p$-$Pb collisions at $\sqrt{s_{\rm NN}}$ = 5.02 TeV. The statistical and systematic uncertainties are represented by vertical bars and boxes, respectively. | 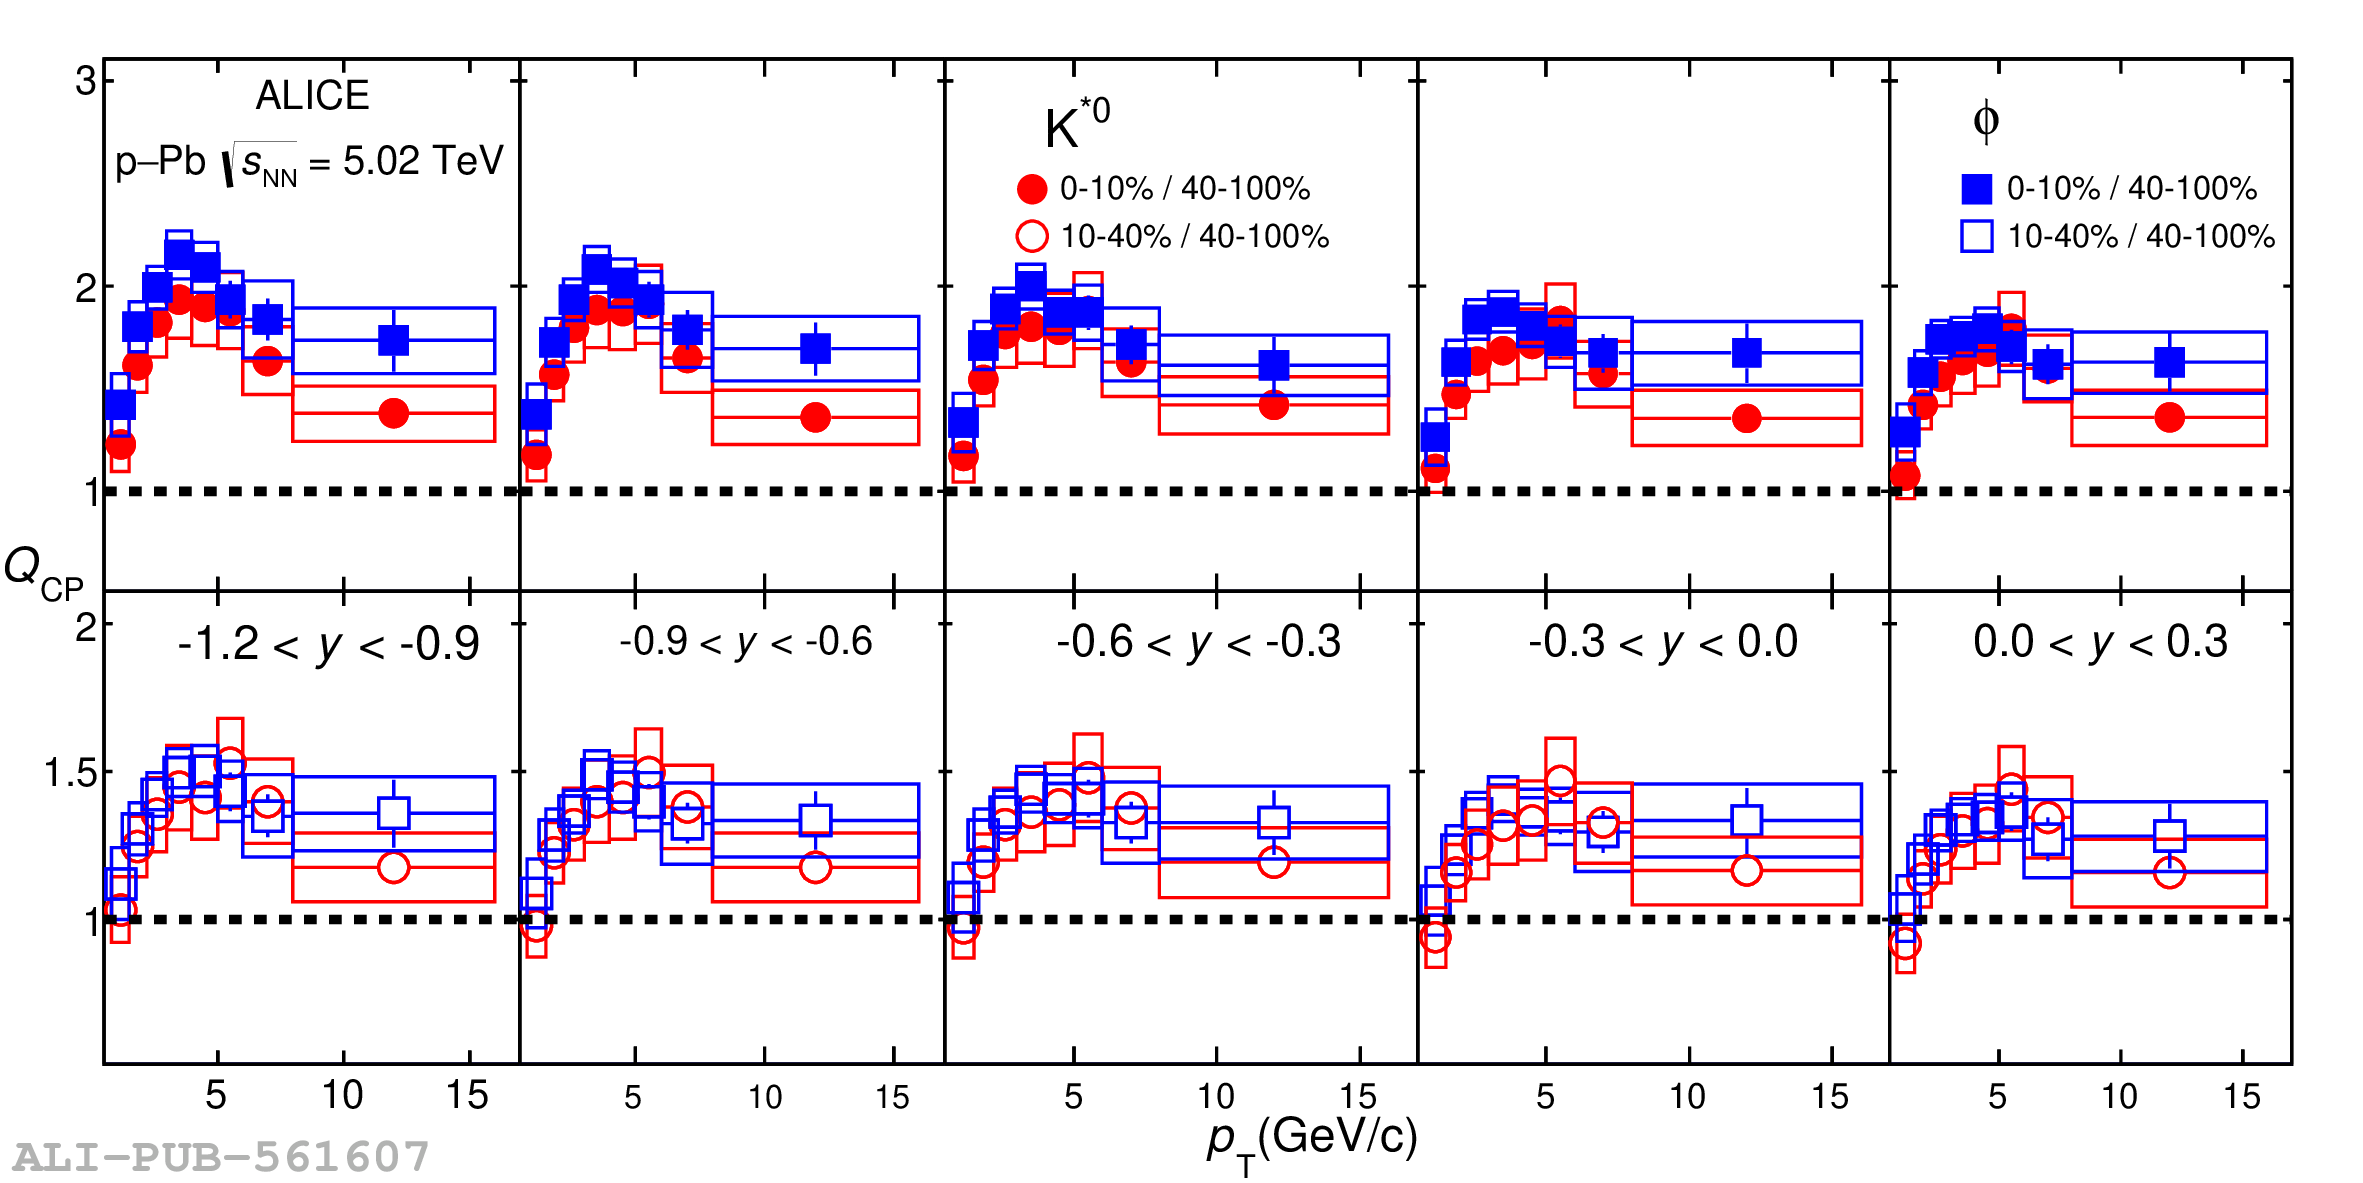 |