Fluctuation measurements are important sources of information on the mechanism of particle production at LHC energies. This article reports the first experimental results on third-order cumulants of the net-proton distributions in Pb$-$Pb collisions at a center-of-mass energy $\sqrt{s_{\rm NN}} = 5.02$ TeV recorded by the ALICE detector. The results on the second-order cumulants of net-proton distributions at $\sqrt{s_{\rm NN}} = 2.76$ and $5.02$ TeV are also discussed in view of effects due to the global and local baryon number conservation. The results demonstrate the presence of long-range rapidity correlations between protons and antiprotons. Such correlations originate from the early phase of the collision. The experimental results are compared with HIJING and EPOS model calculations, and the dependence of the fluctuation measurements on the phase-space coverage is examined in the context of lattice quantum chromodynamics (LQCD) and hadron resonance gas (HRG) model estimations. The measured third-order cumulants are consistent with zero within experimental uncertainties of about 4% and are described well by LQCD and HRG predictions.
Phys. Lett. B 844 (2023) 137545
HEP Data
e-Print: arXiv:2206.03343 | PDF | inSPIRE
CERN-EP-2022-111
Figure group
Figure 1
(Left) Correlation between the reconstructed ($N_{\rm p}^{\rm rec}$) and the generated ($N_{\rm p}^{\rm gen}$) number of protons for the most central Pb--Pb collisions simulated using the HIJING model . (Right) Distribution of reconstructed proton number for a fixed value of $N_{\rm p}^{\rm gen}=36$, where the fit demonstrates the deviation from a binomial efficiency loss. | 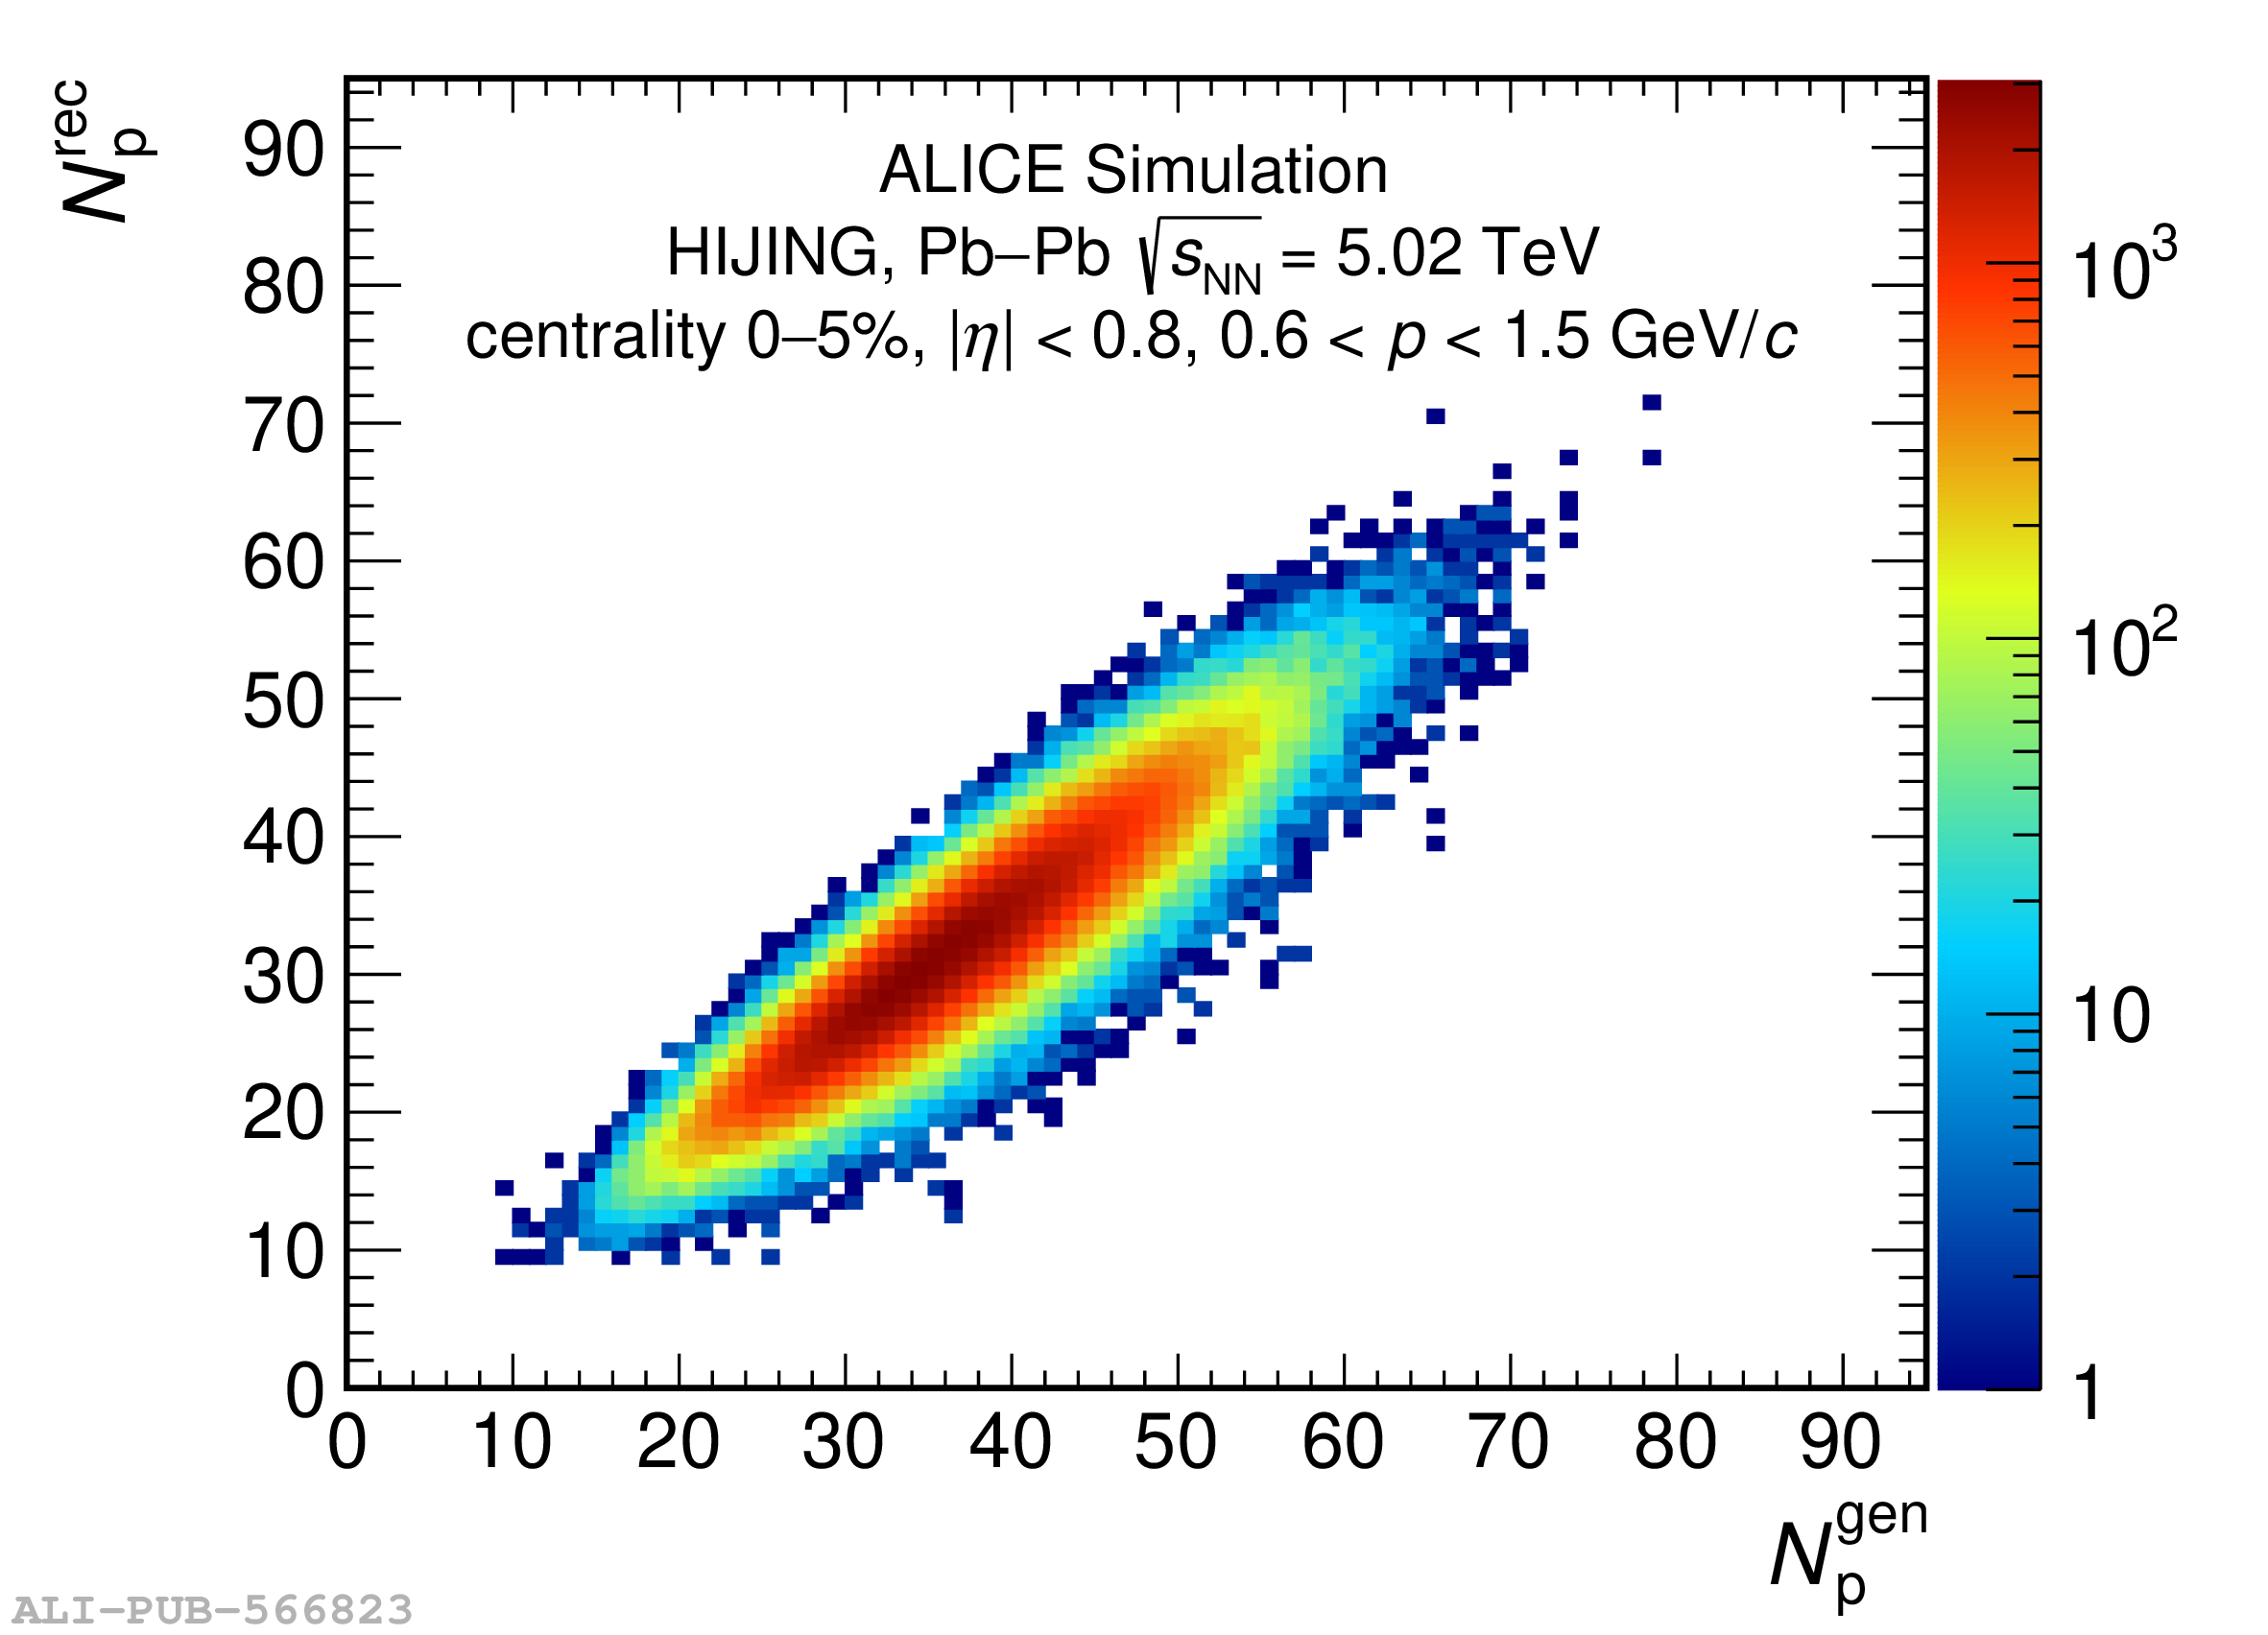 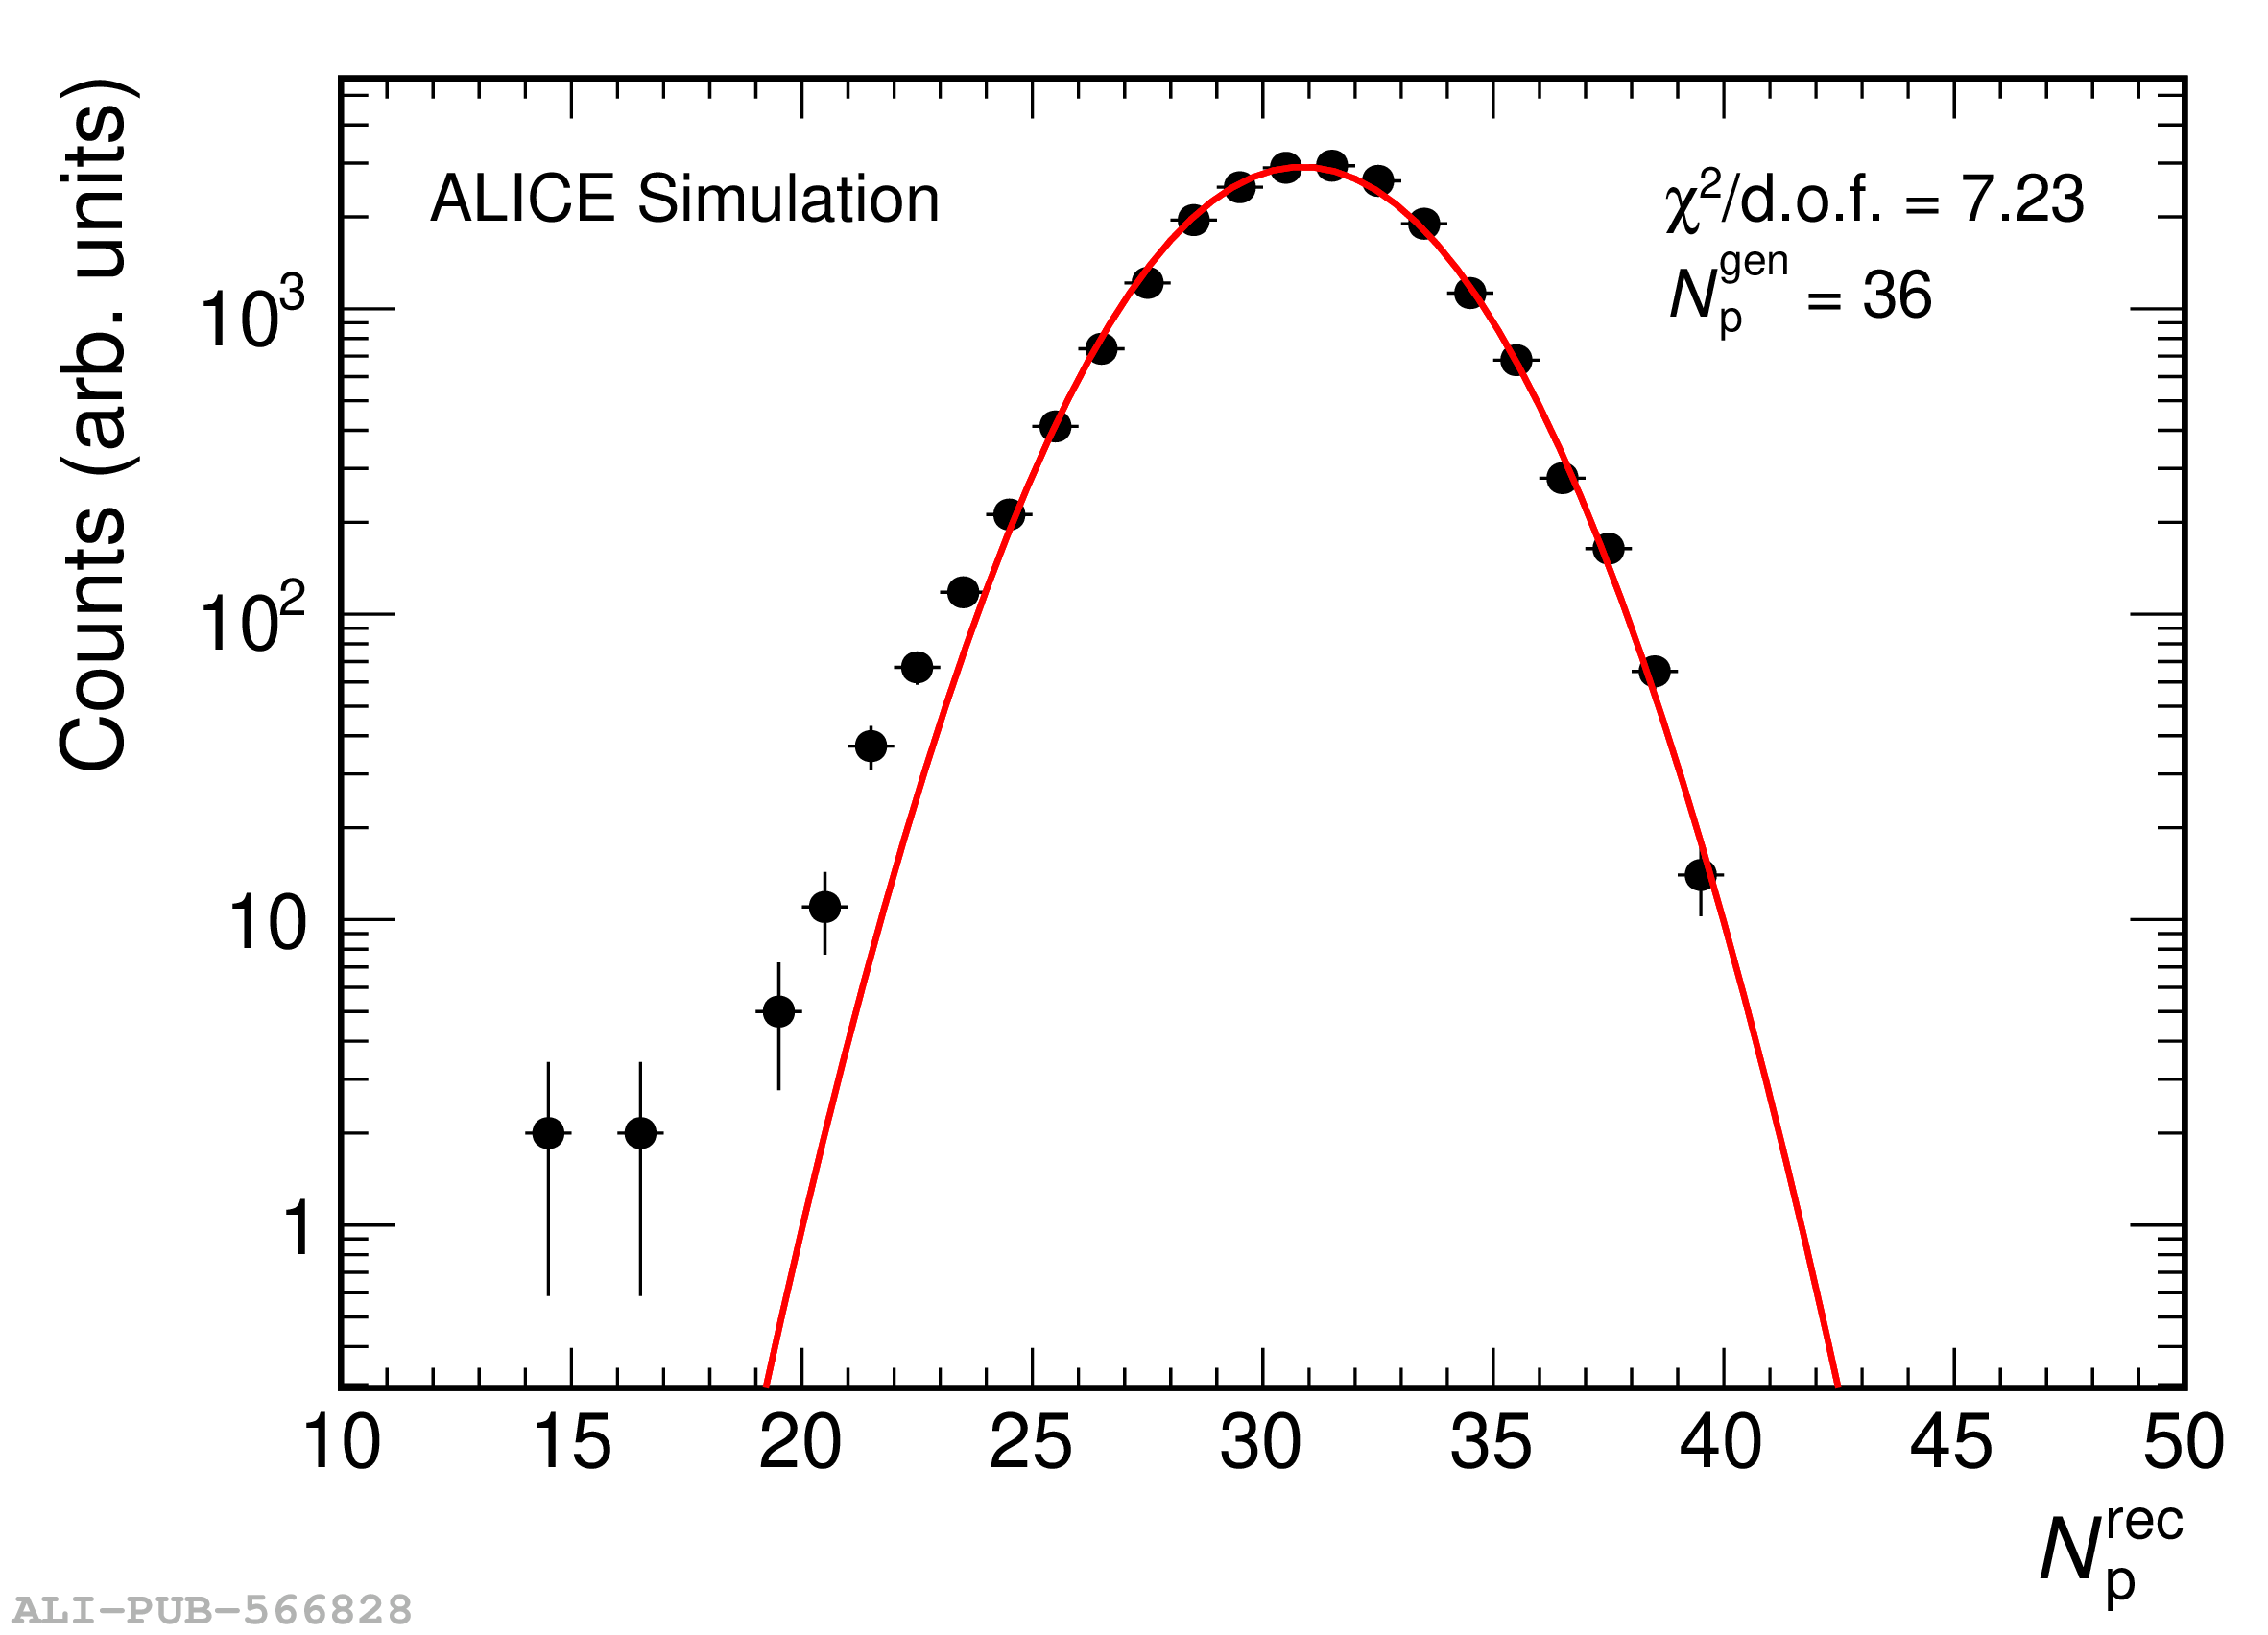 |
Figure 2
HIJING model based calculations of the normalized second-order cumulants of net protons as a function of pseudorapidity window ($\Delta\eta$) (left) and ratio of third- to second-order cumulants (right) of net protons as a function of collision centrality at $\snn=5.02$ TeV. The results at the generated and reconstructed level are shown by the green closed and open circles, respectively. The error bars represent statistical uncertainties. The results after efficiency correction assuming binomial efficiency losses are shown by black open squares. | 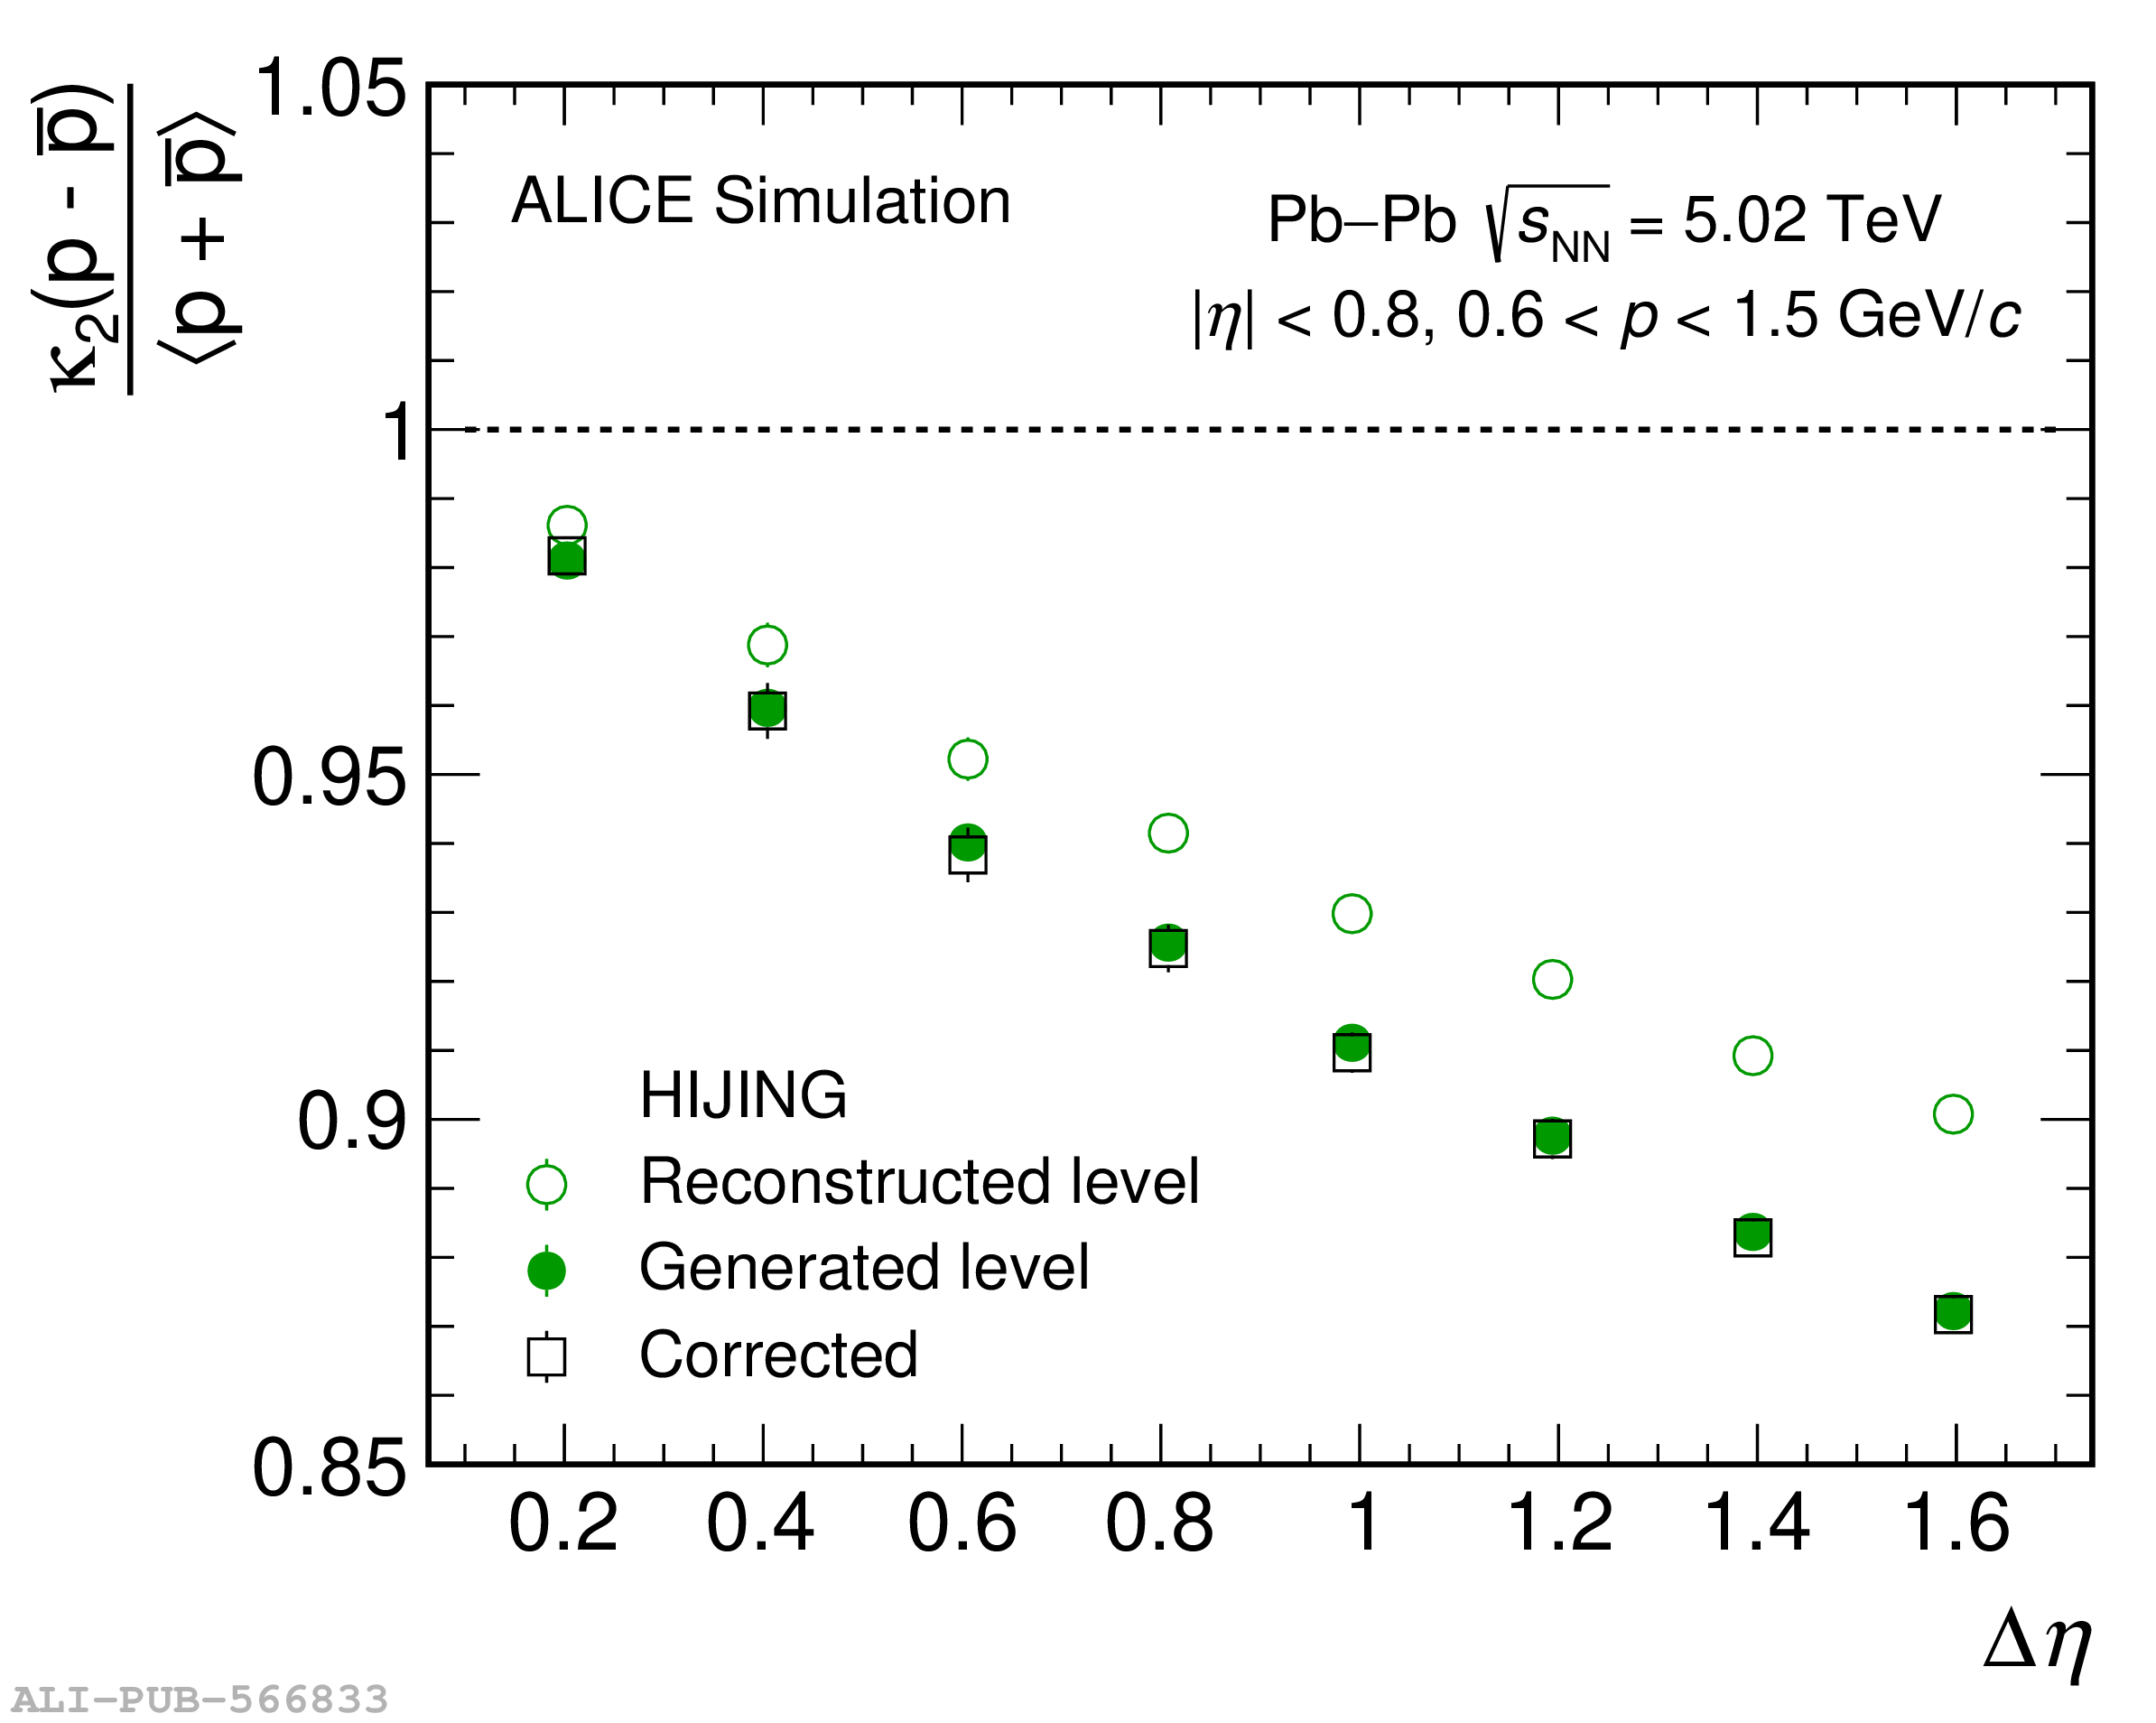 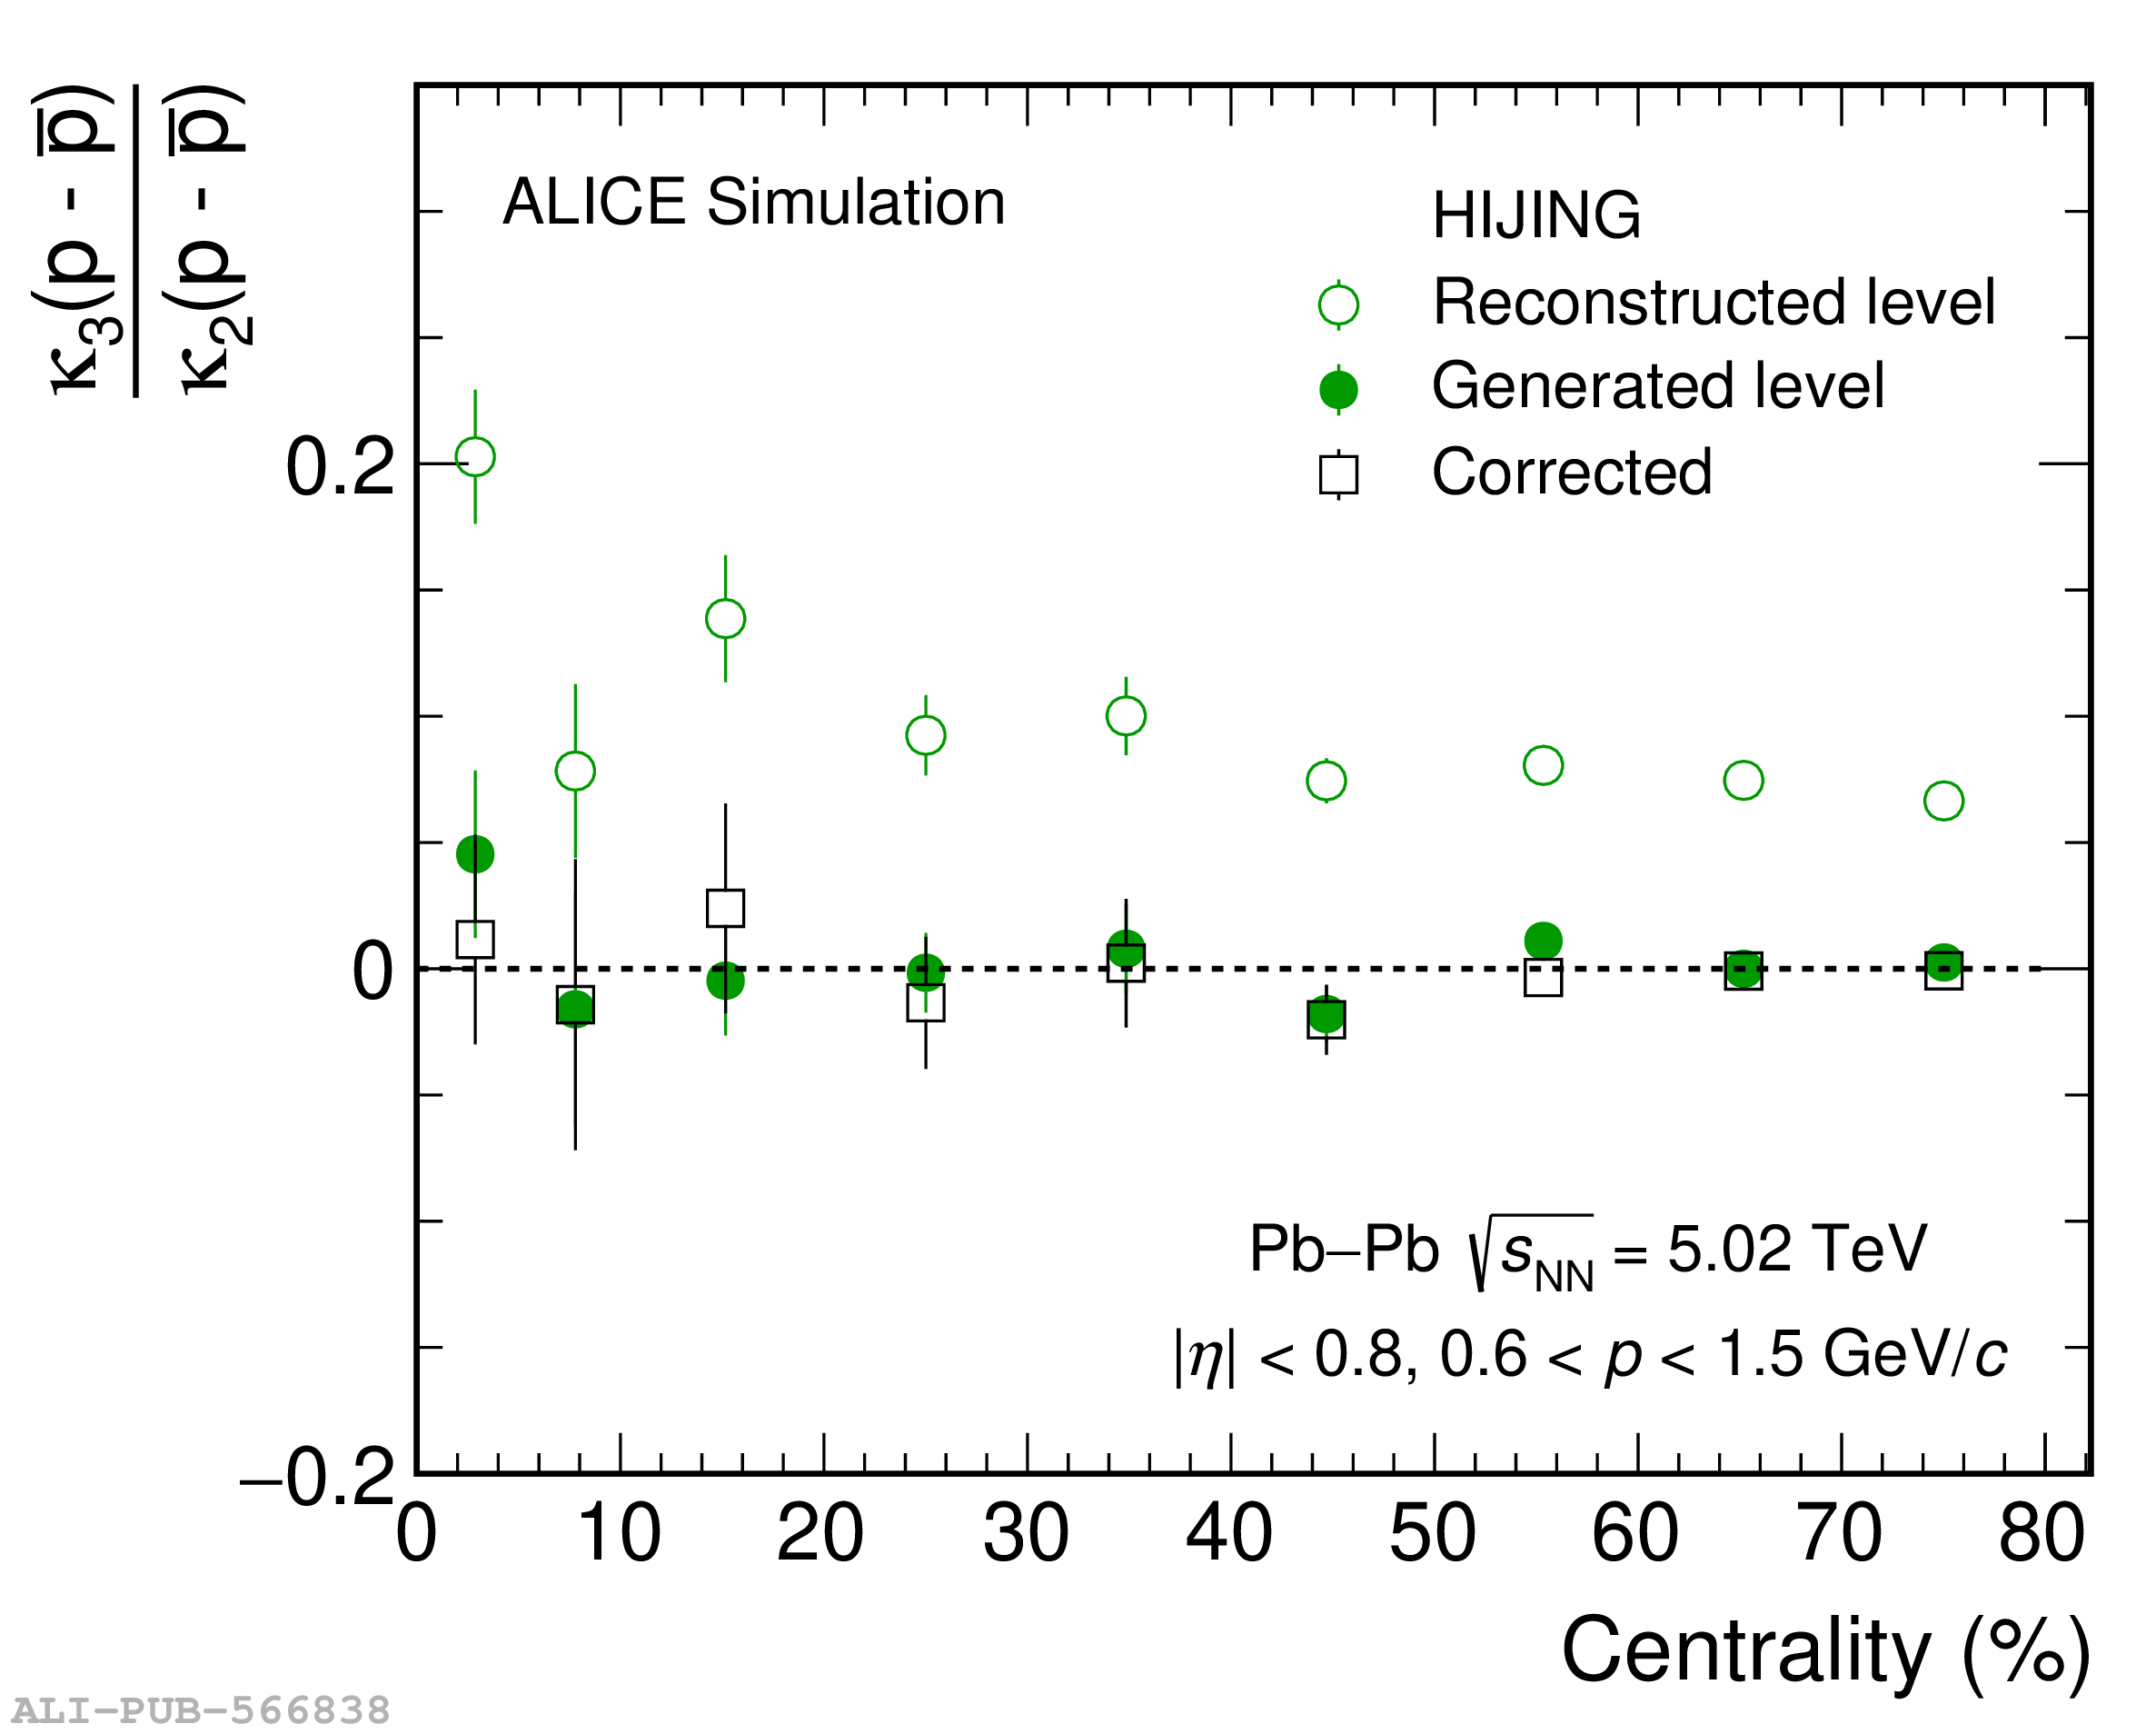 |
Figure 3
Pseudorapidity interval dependence of the second-order cumulants of net-pions (left) and net-kaons (right) normalized to the means (see text). The ALICE data are shown as solid black circles while the blue solid and dashed lines indicate the results from HIJING model calculations with and without resonance contributions, respectively. The error bars represent statistical uncertainties and the boxes around the data points represent the total systematic uncertainties. |  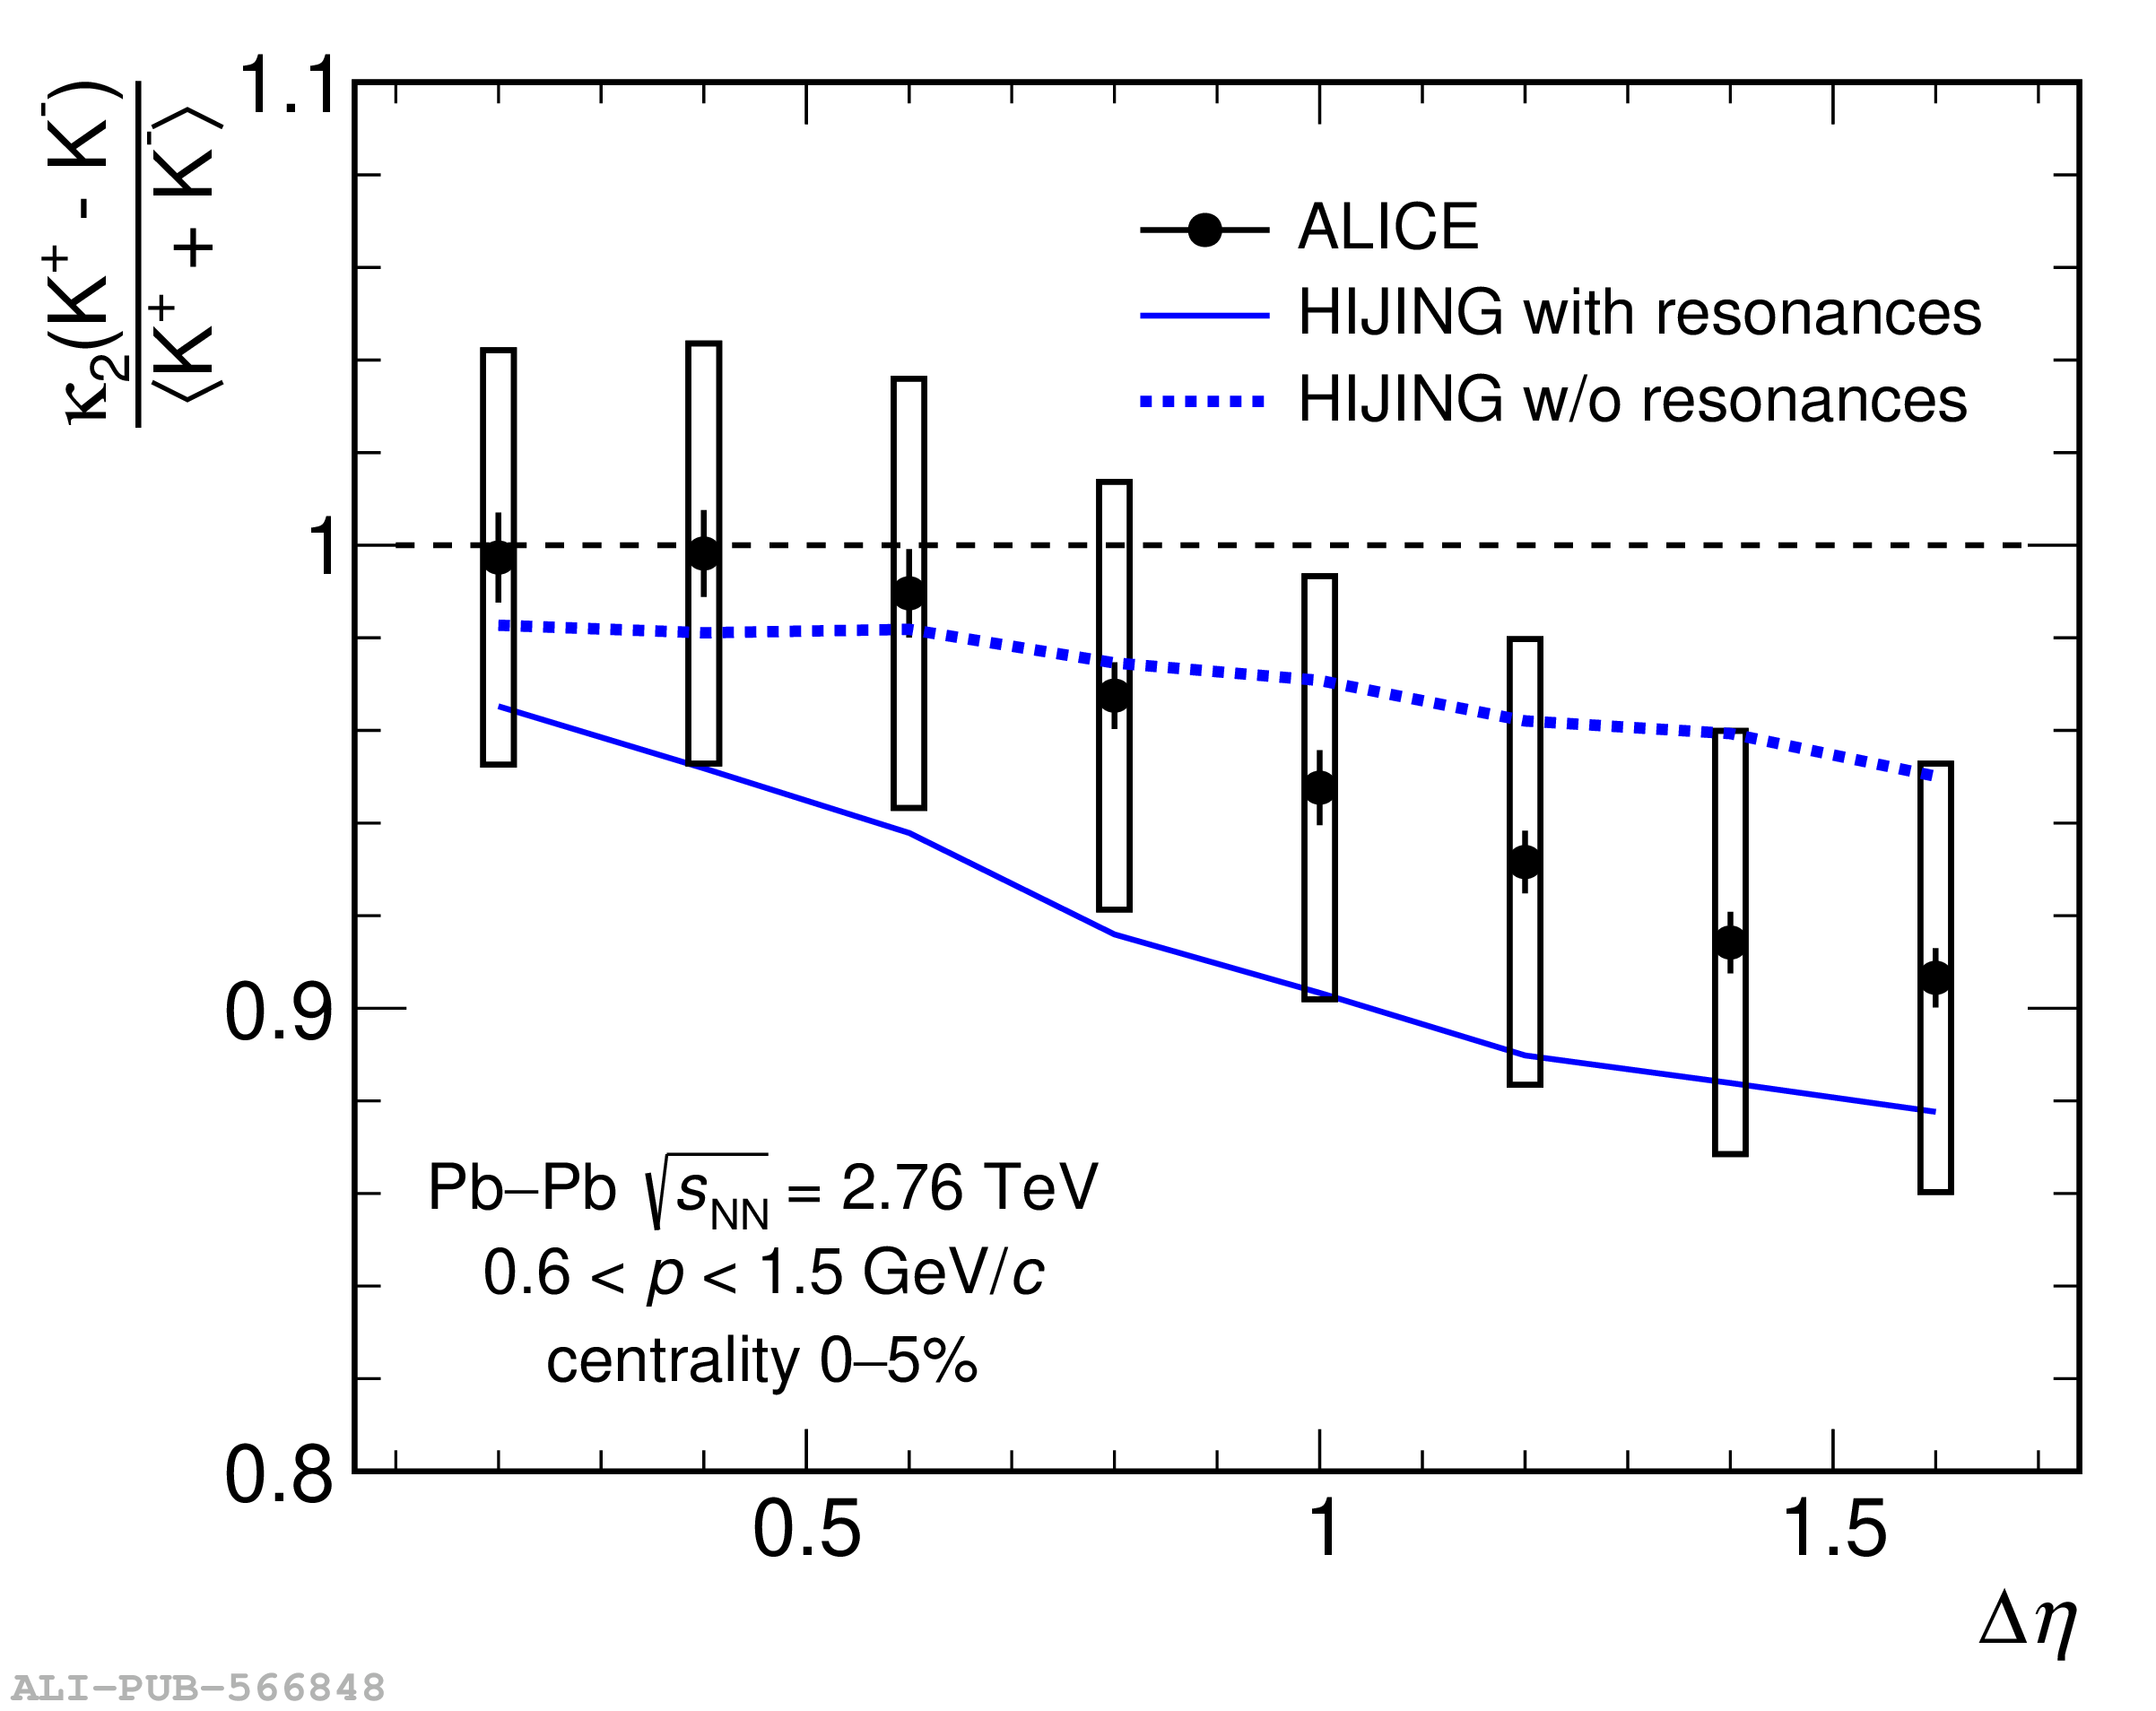 |
Figure 4
Centrality (left) and pseudorapidity interval (right) dependence of the normalized second-order cumulants of net protons. The ALICE data are shown by black and red markers for $\snn = 2.76$ and $5.02$ TeV, respectively, while the colored shaded areas indicate the results from HIJING and EPOS model calculations at $\snn =5.02$ TeV. The Skellam baseline is shown by the horizontal dashed black line. In the right panel the expectation from global baryon number conservation is shown as a pink band and the dashed colored lines represent the predictions of the model with local baryon number conservation . | 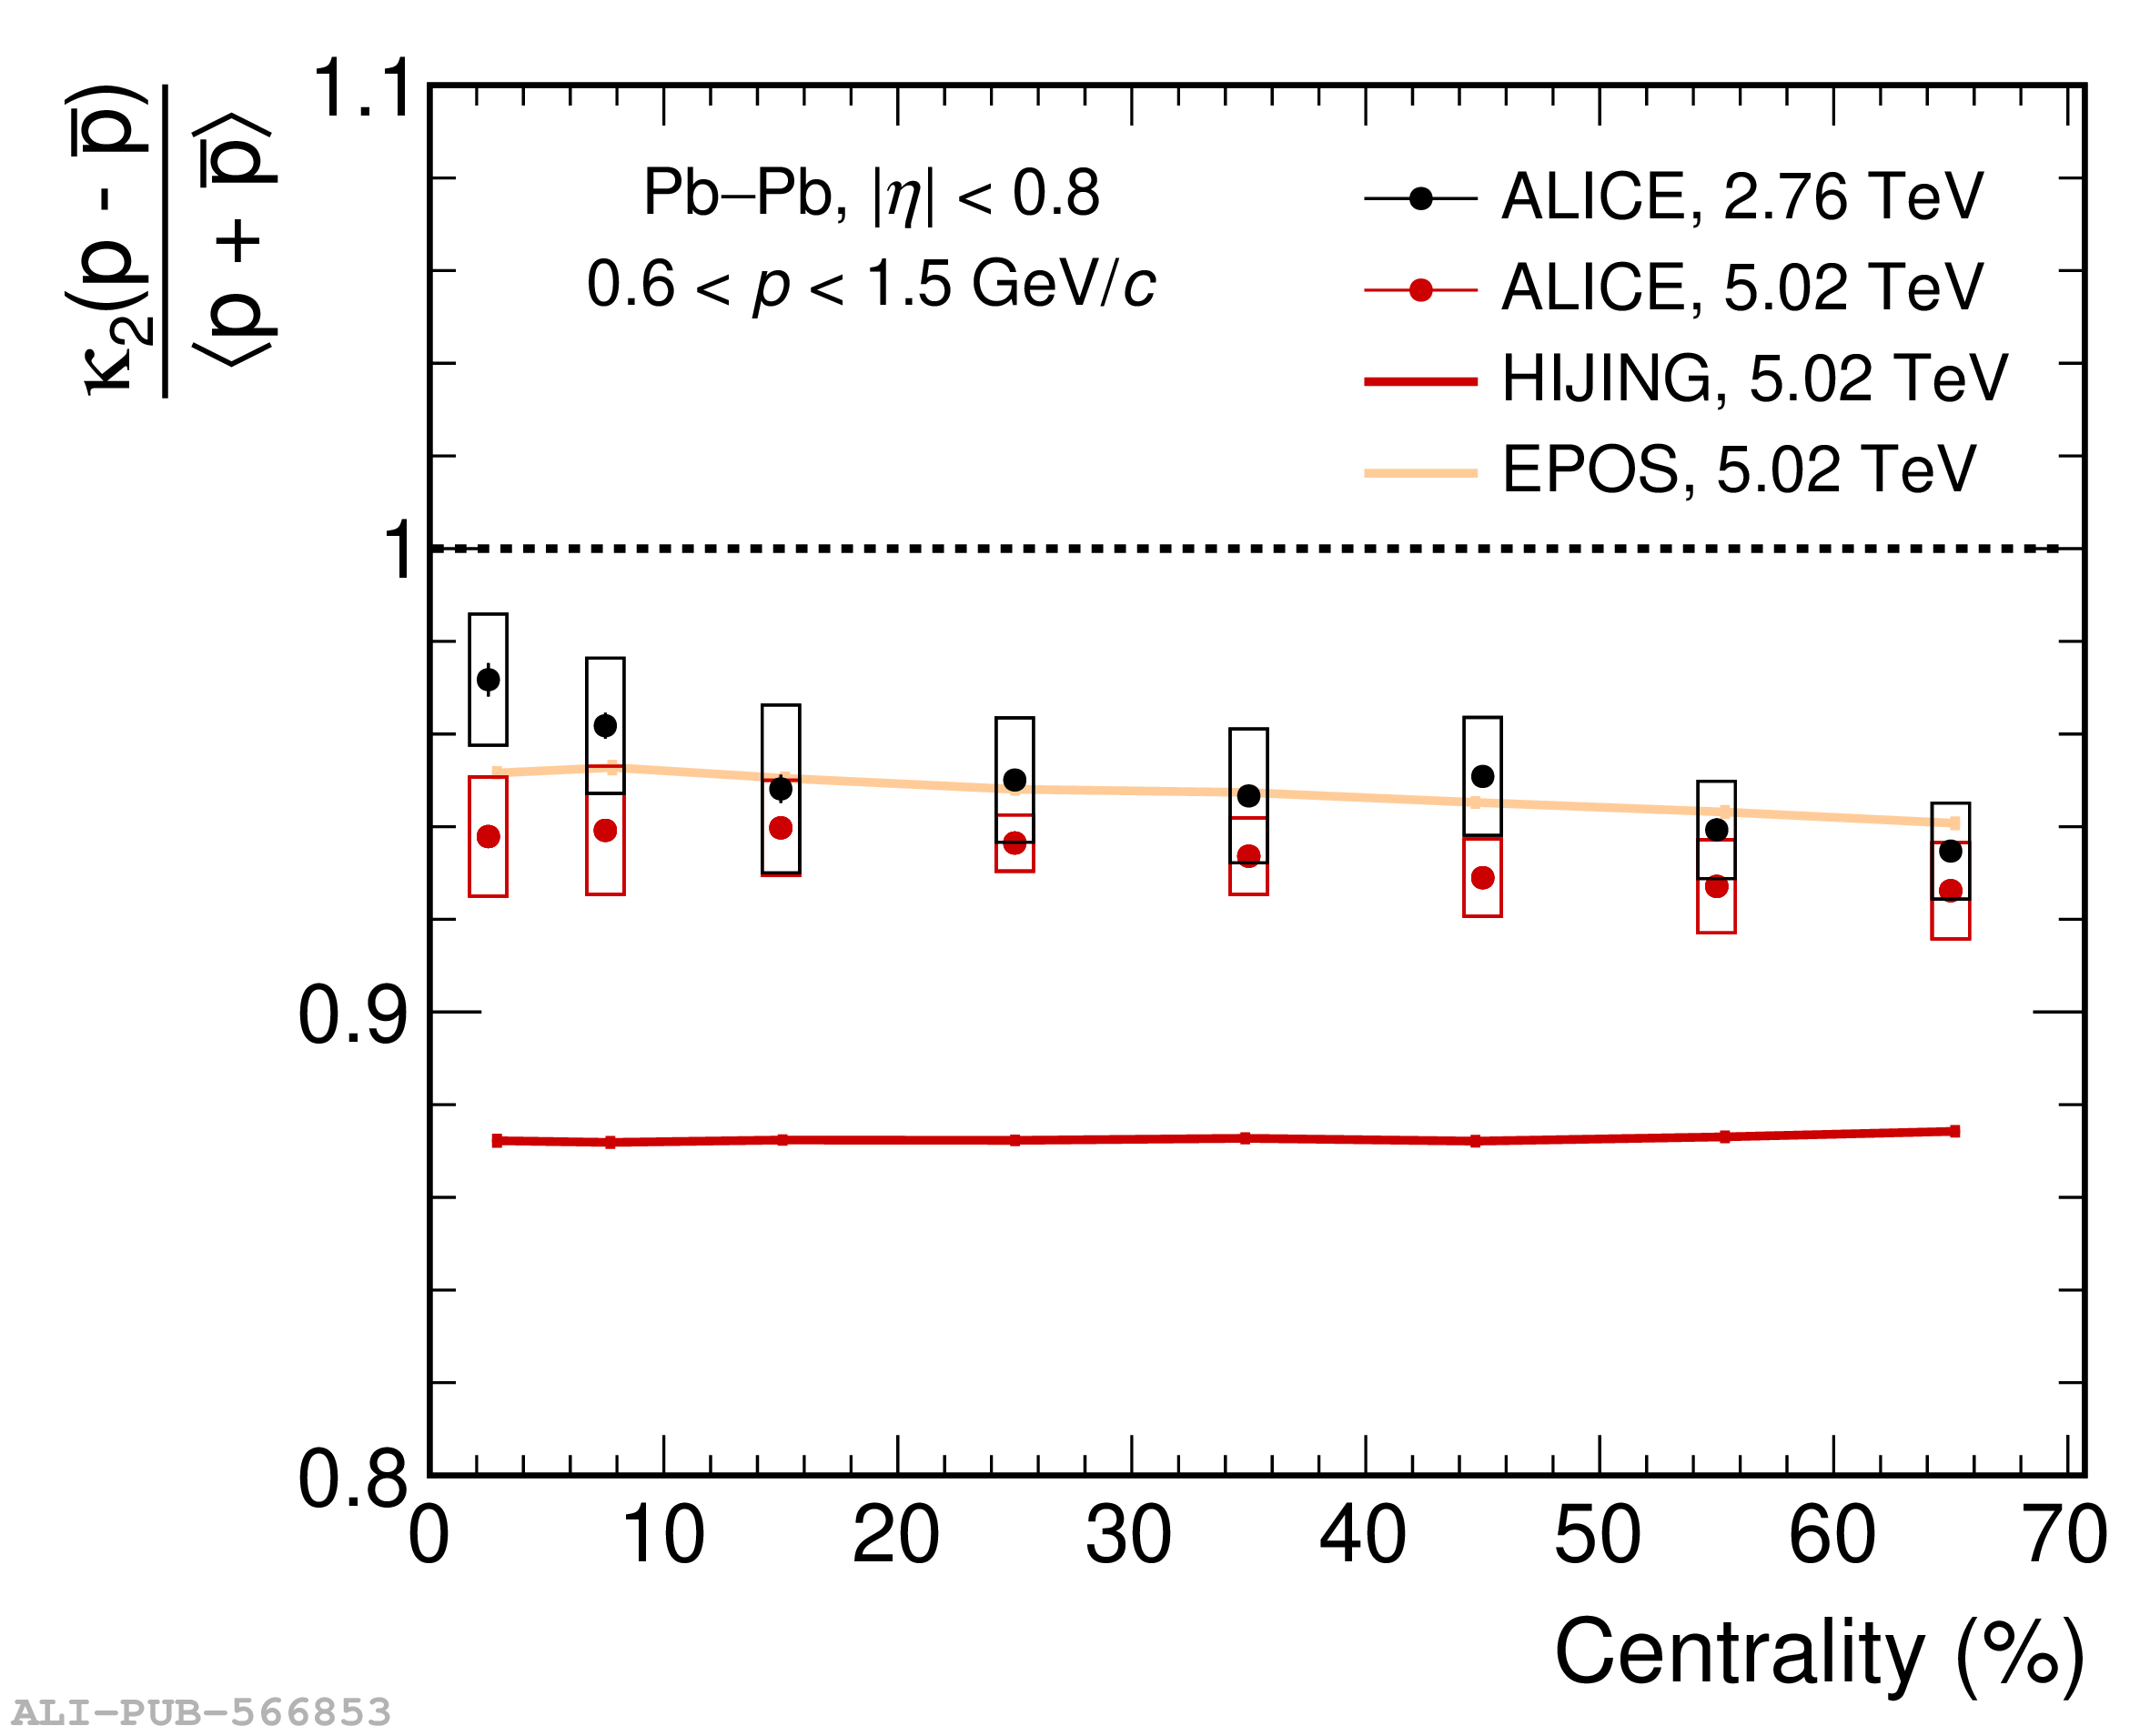 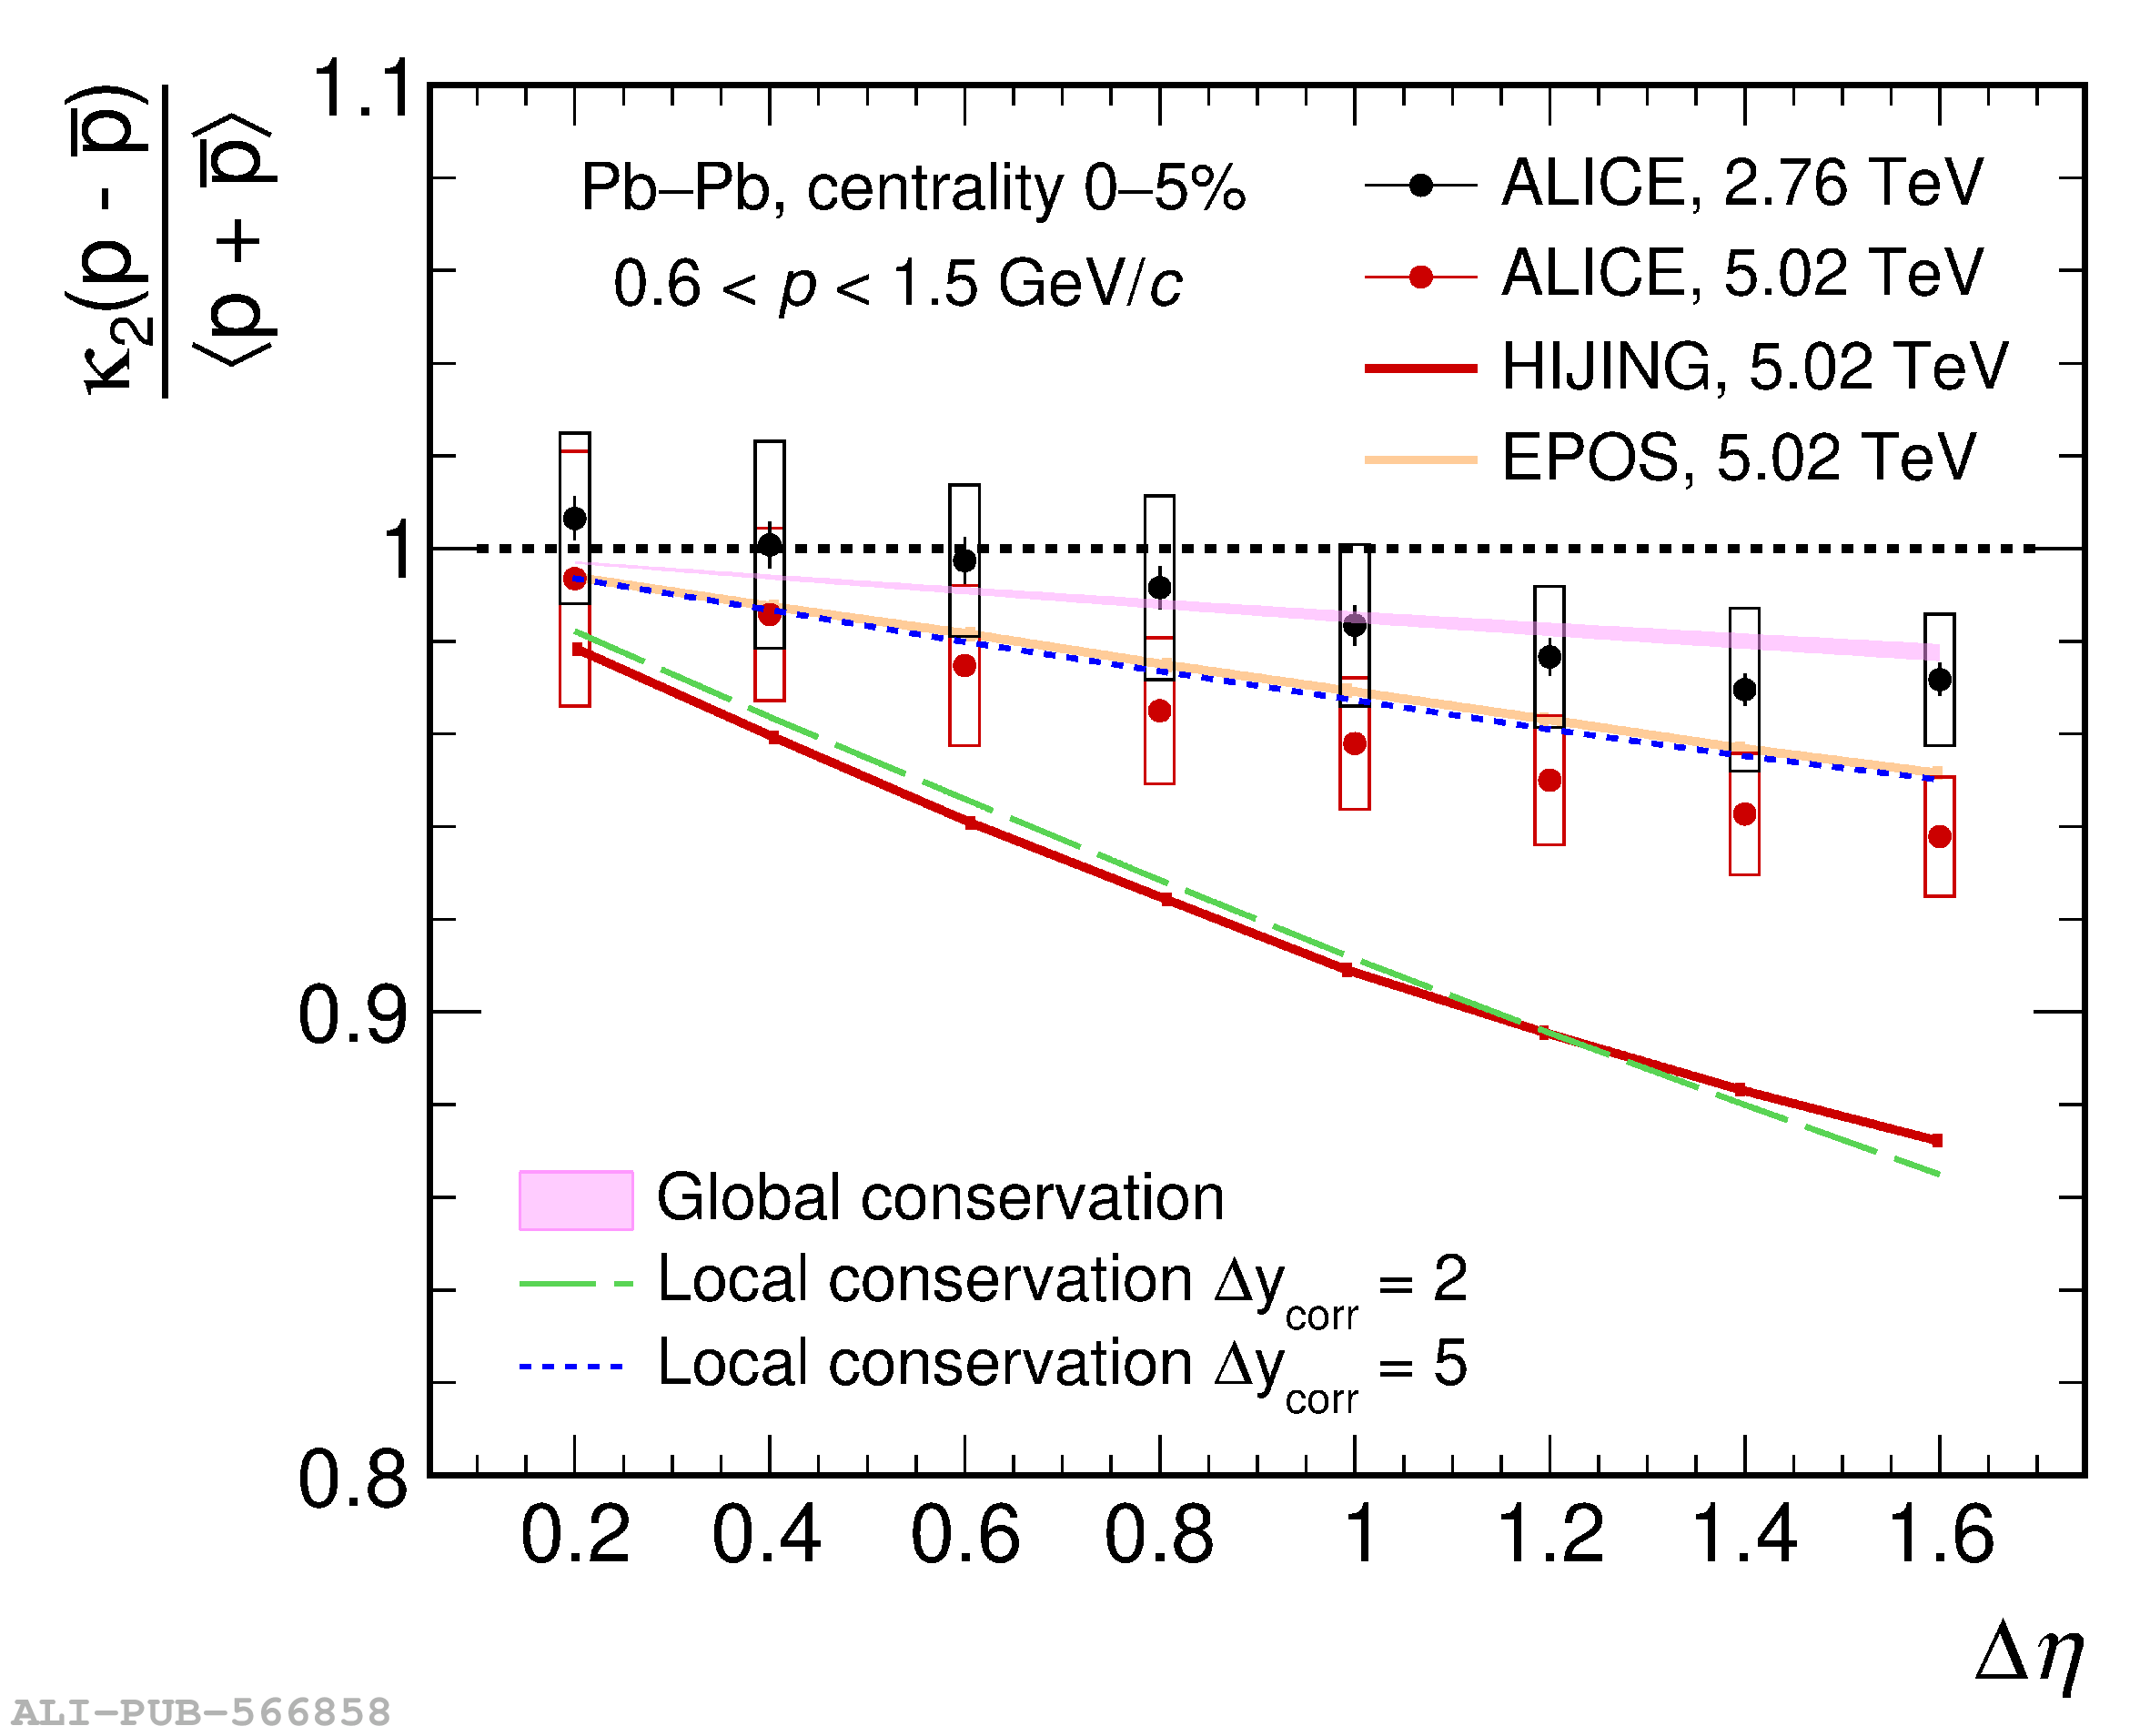 |
Figure 5
Centrality (left) and pseudorapidity interval (right) dependence of the normalized second-order cumulants of net protons for \mbox{$\snn = 5.02$ TeV} and two momentum intervals for the protons. The ALICE data are shown by red and blue markers for $0.6 < p < 1.5$ GeV/c and $0.6 < p < 2.0$ GeV/c, respectively. The colored shaded areas indicate the results from the HIJING and EPOS model calculations. In the right panel, in addition, the dashed colored lines represent the predictions from the model with local baryon number conservation with $\Delta y_{\rm corr}=5$ . | 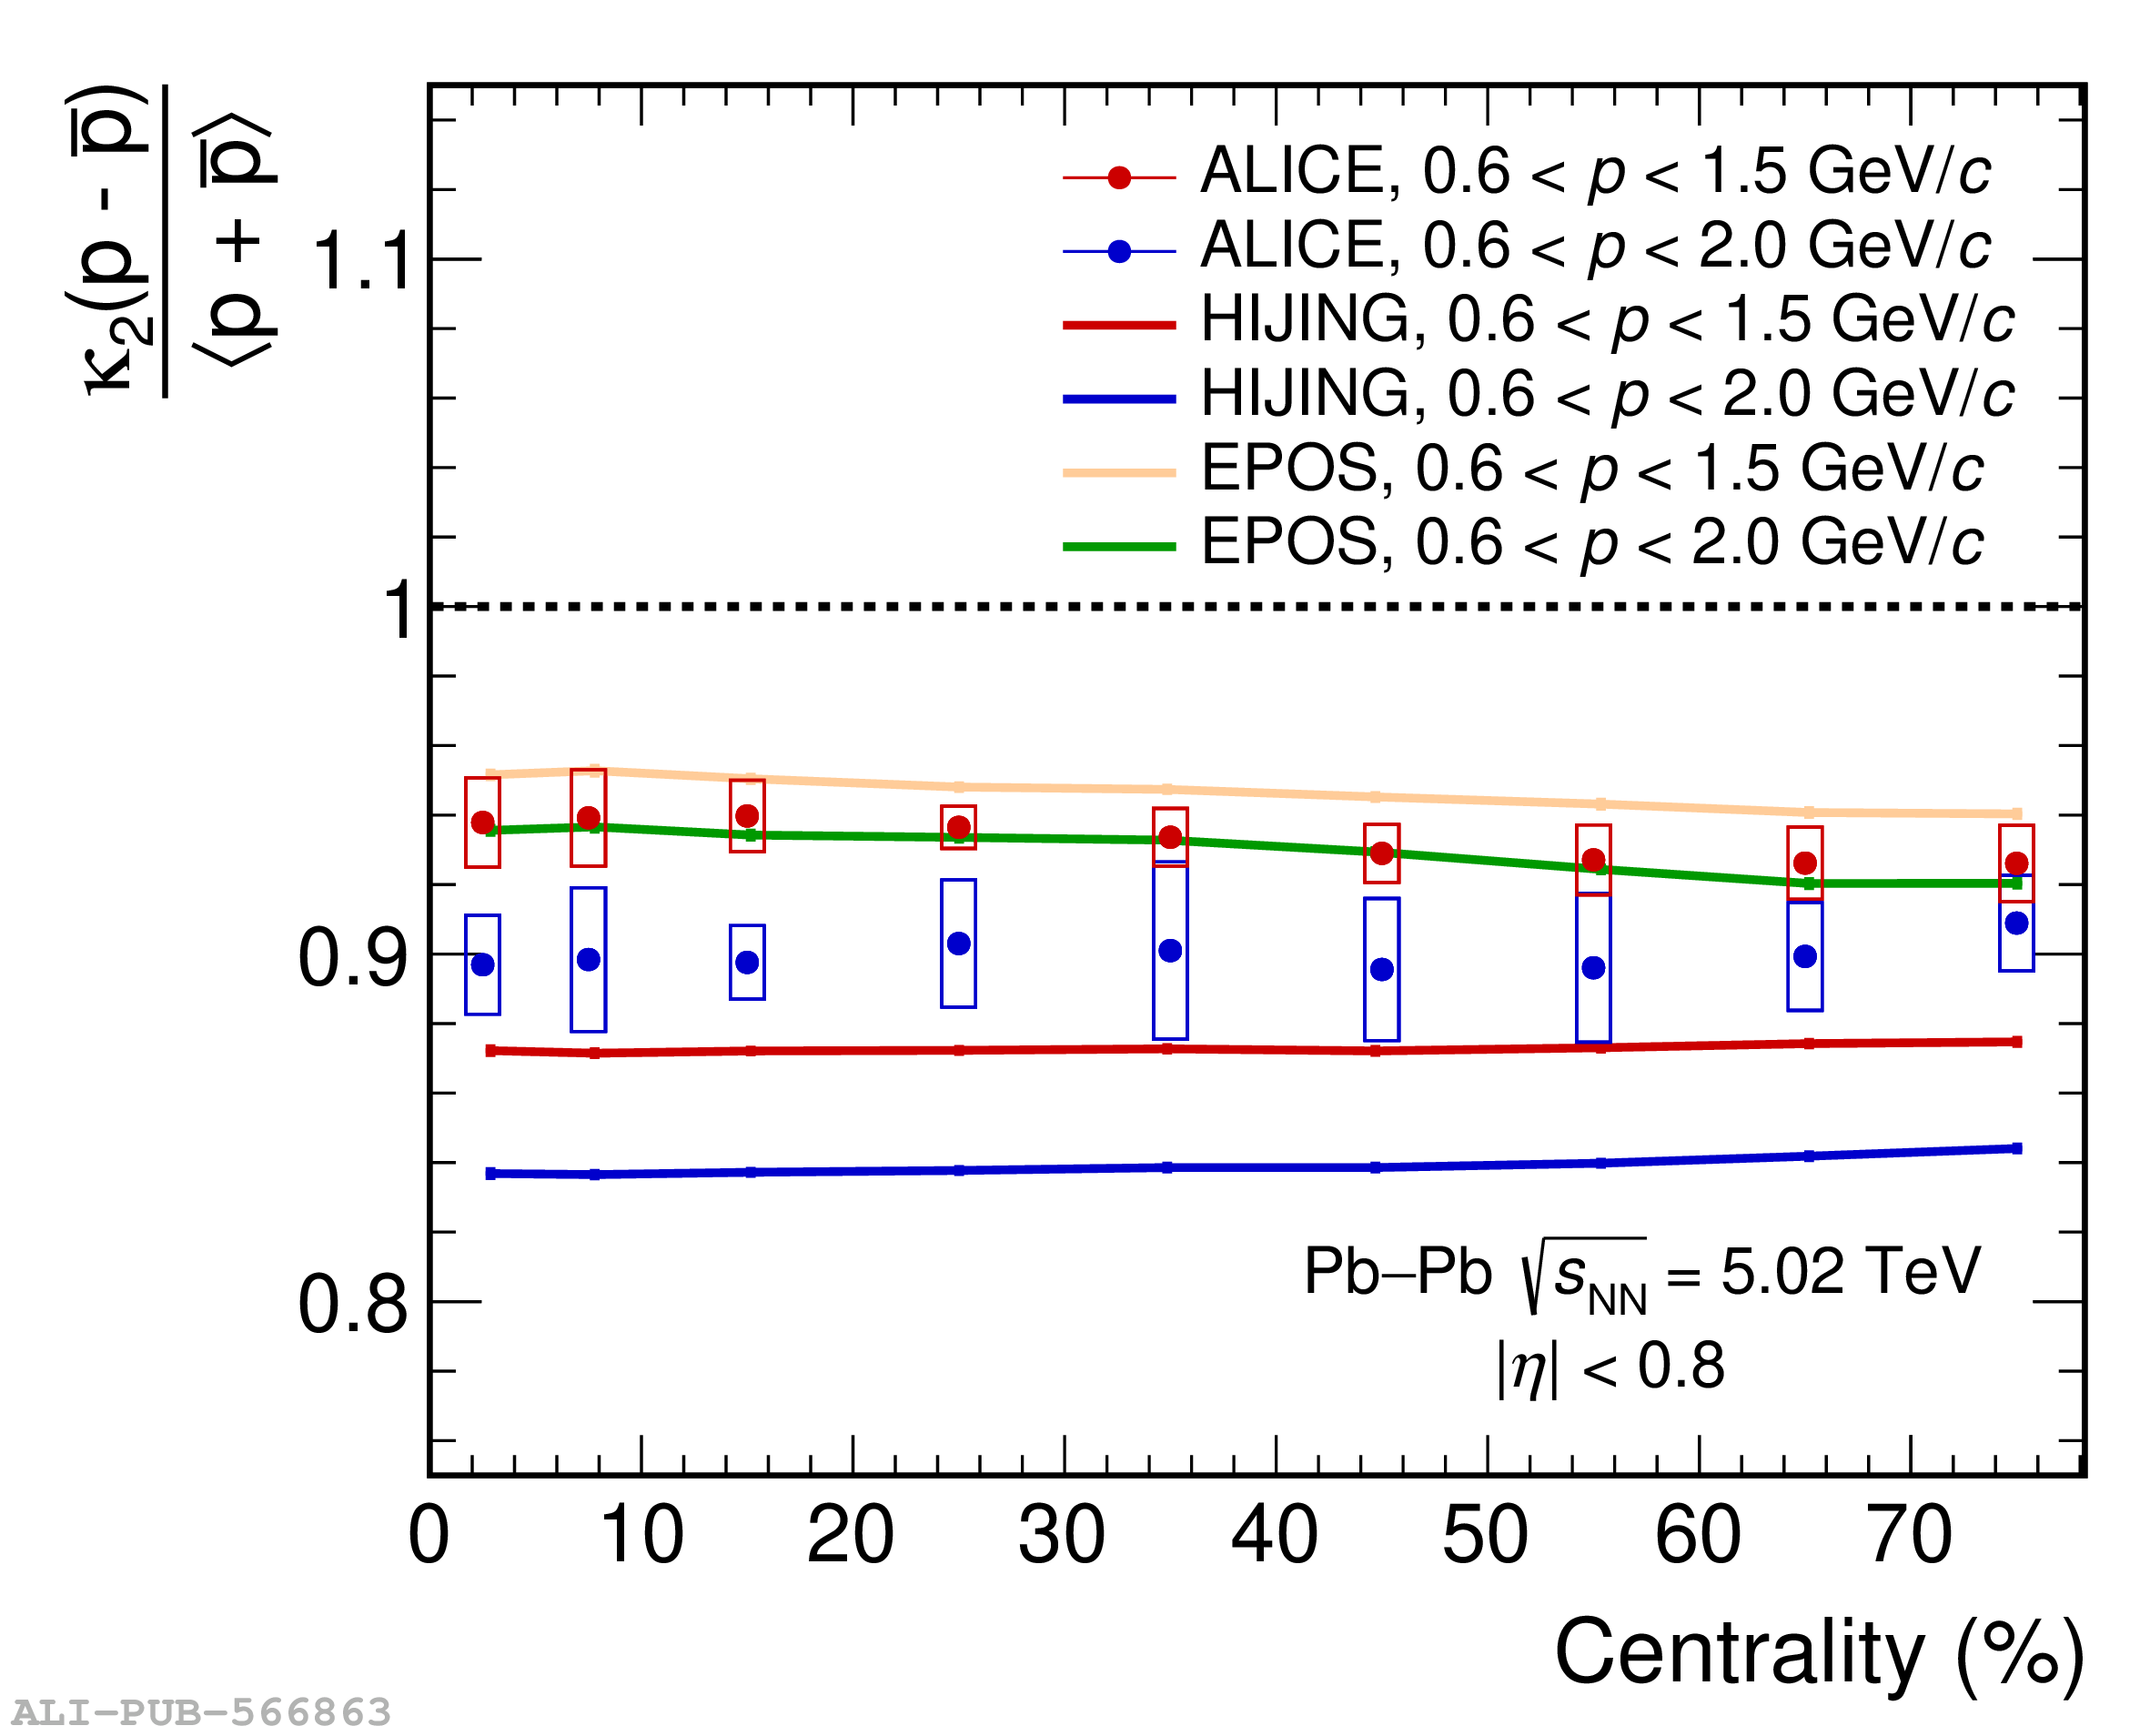 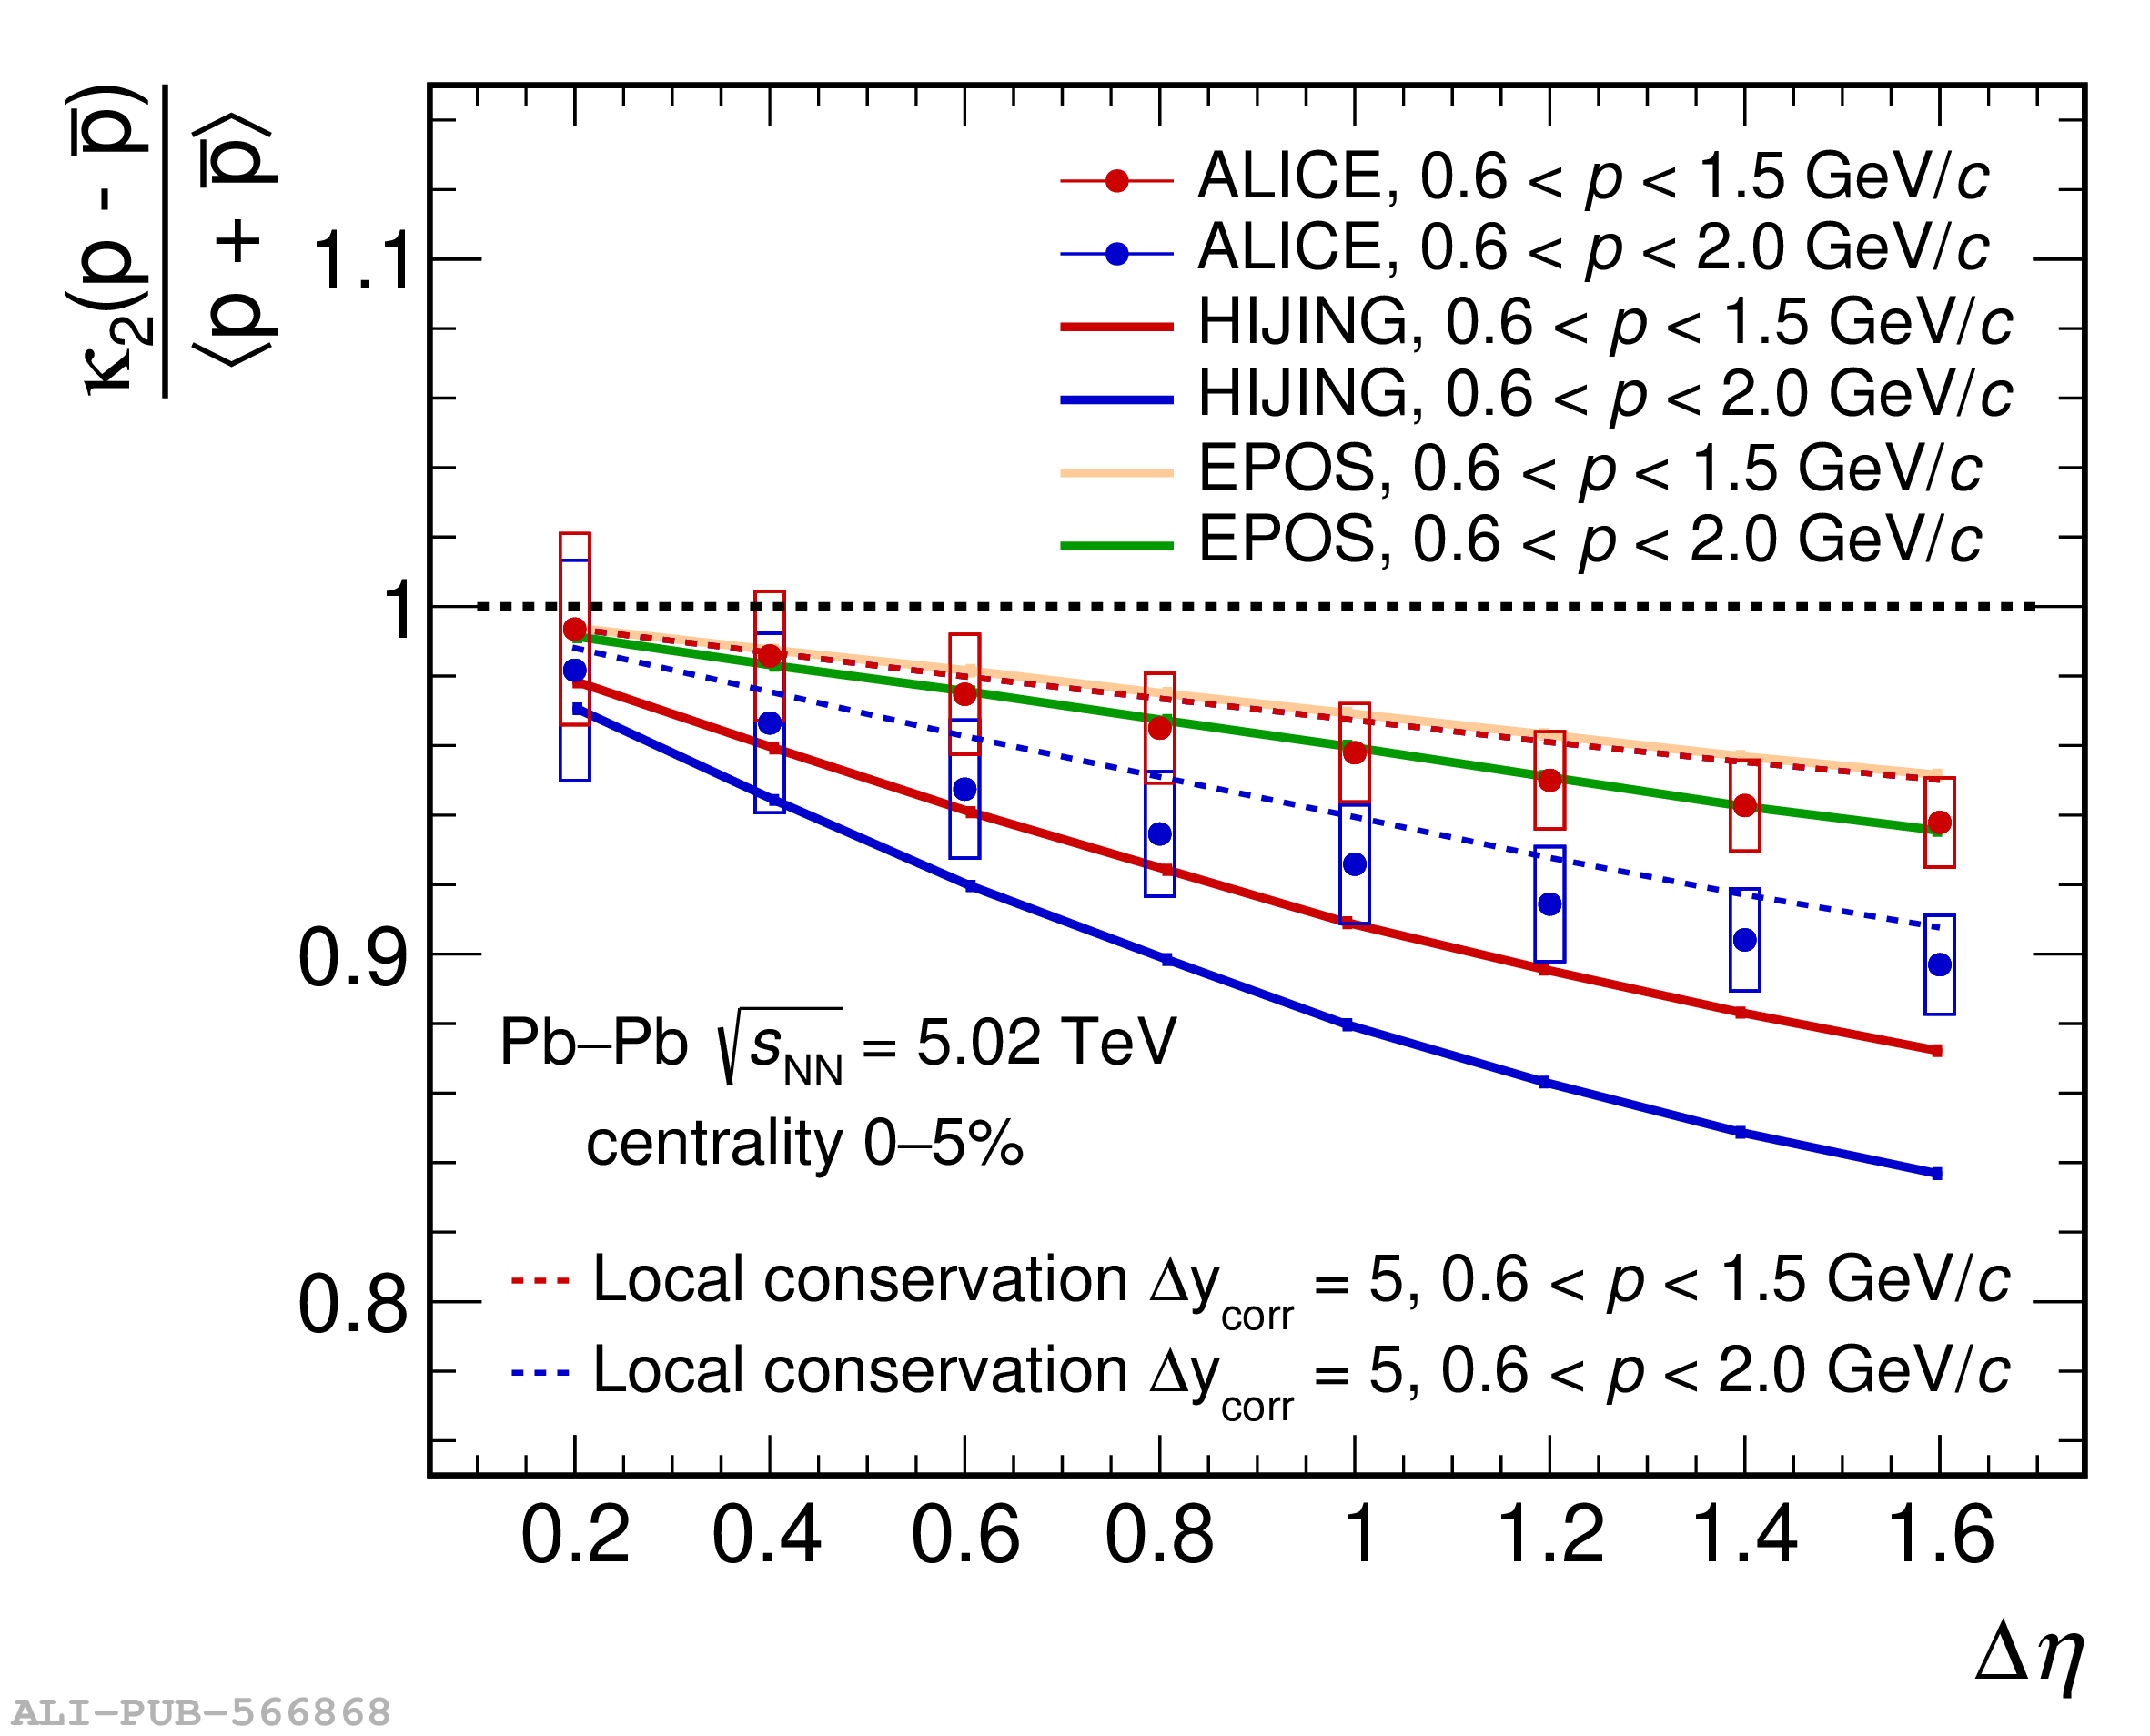 |
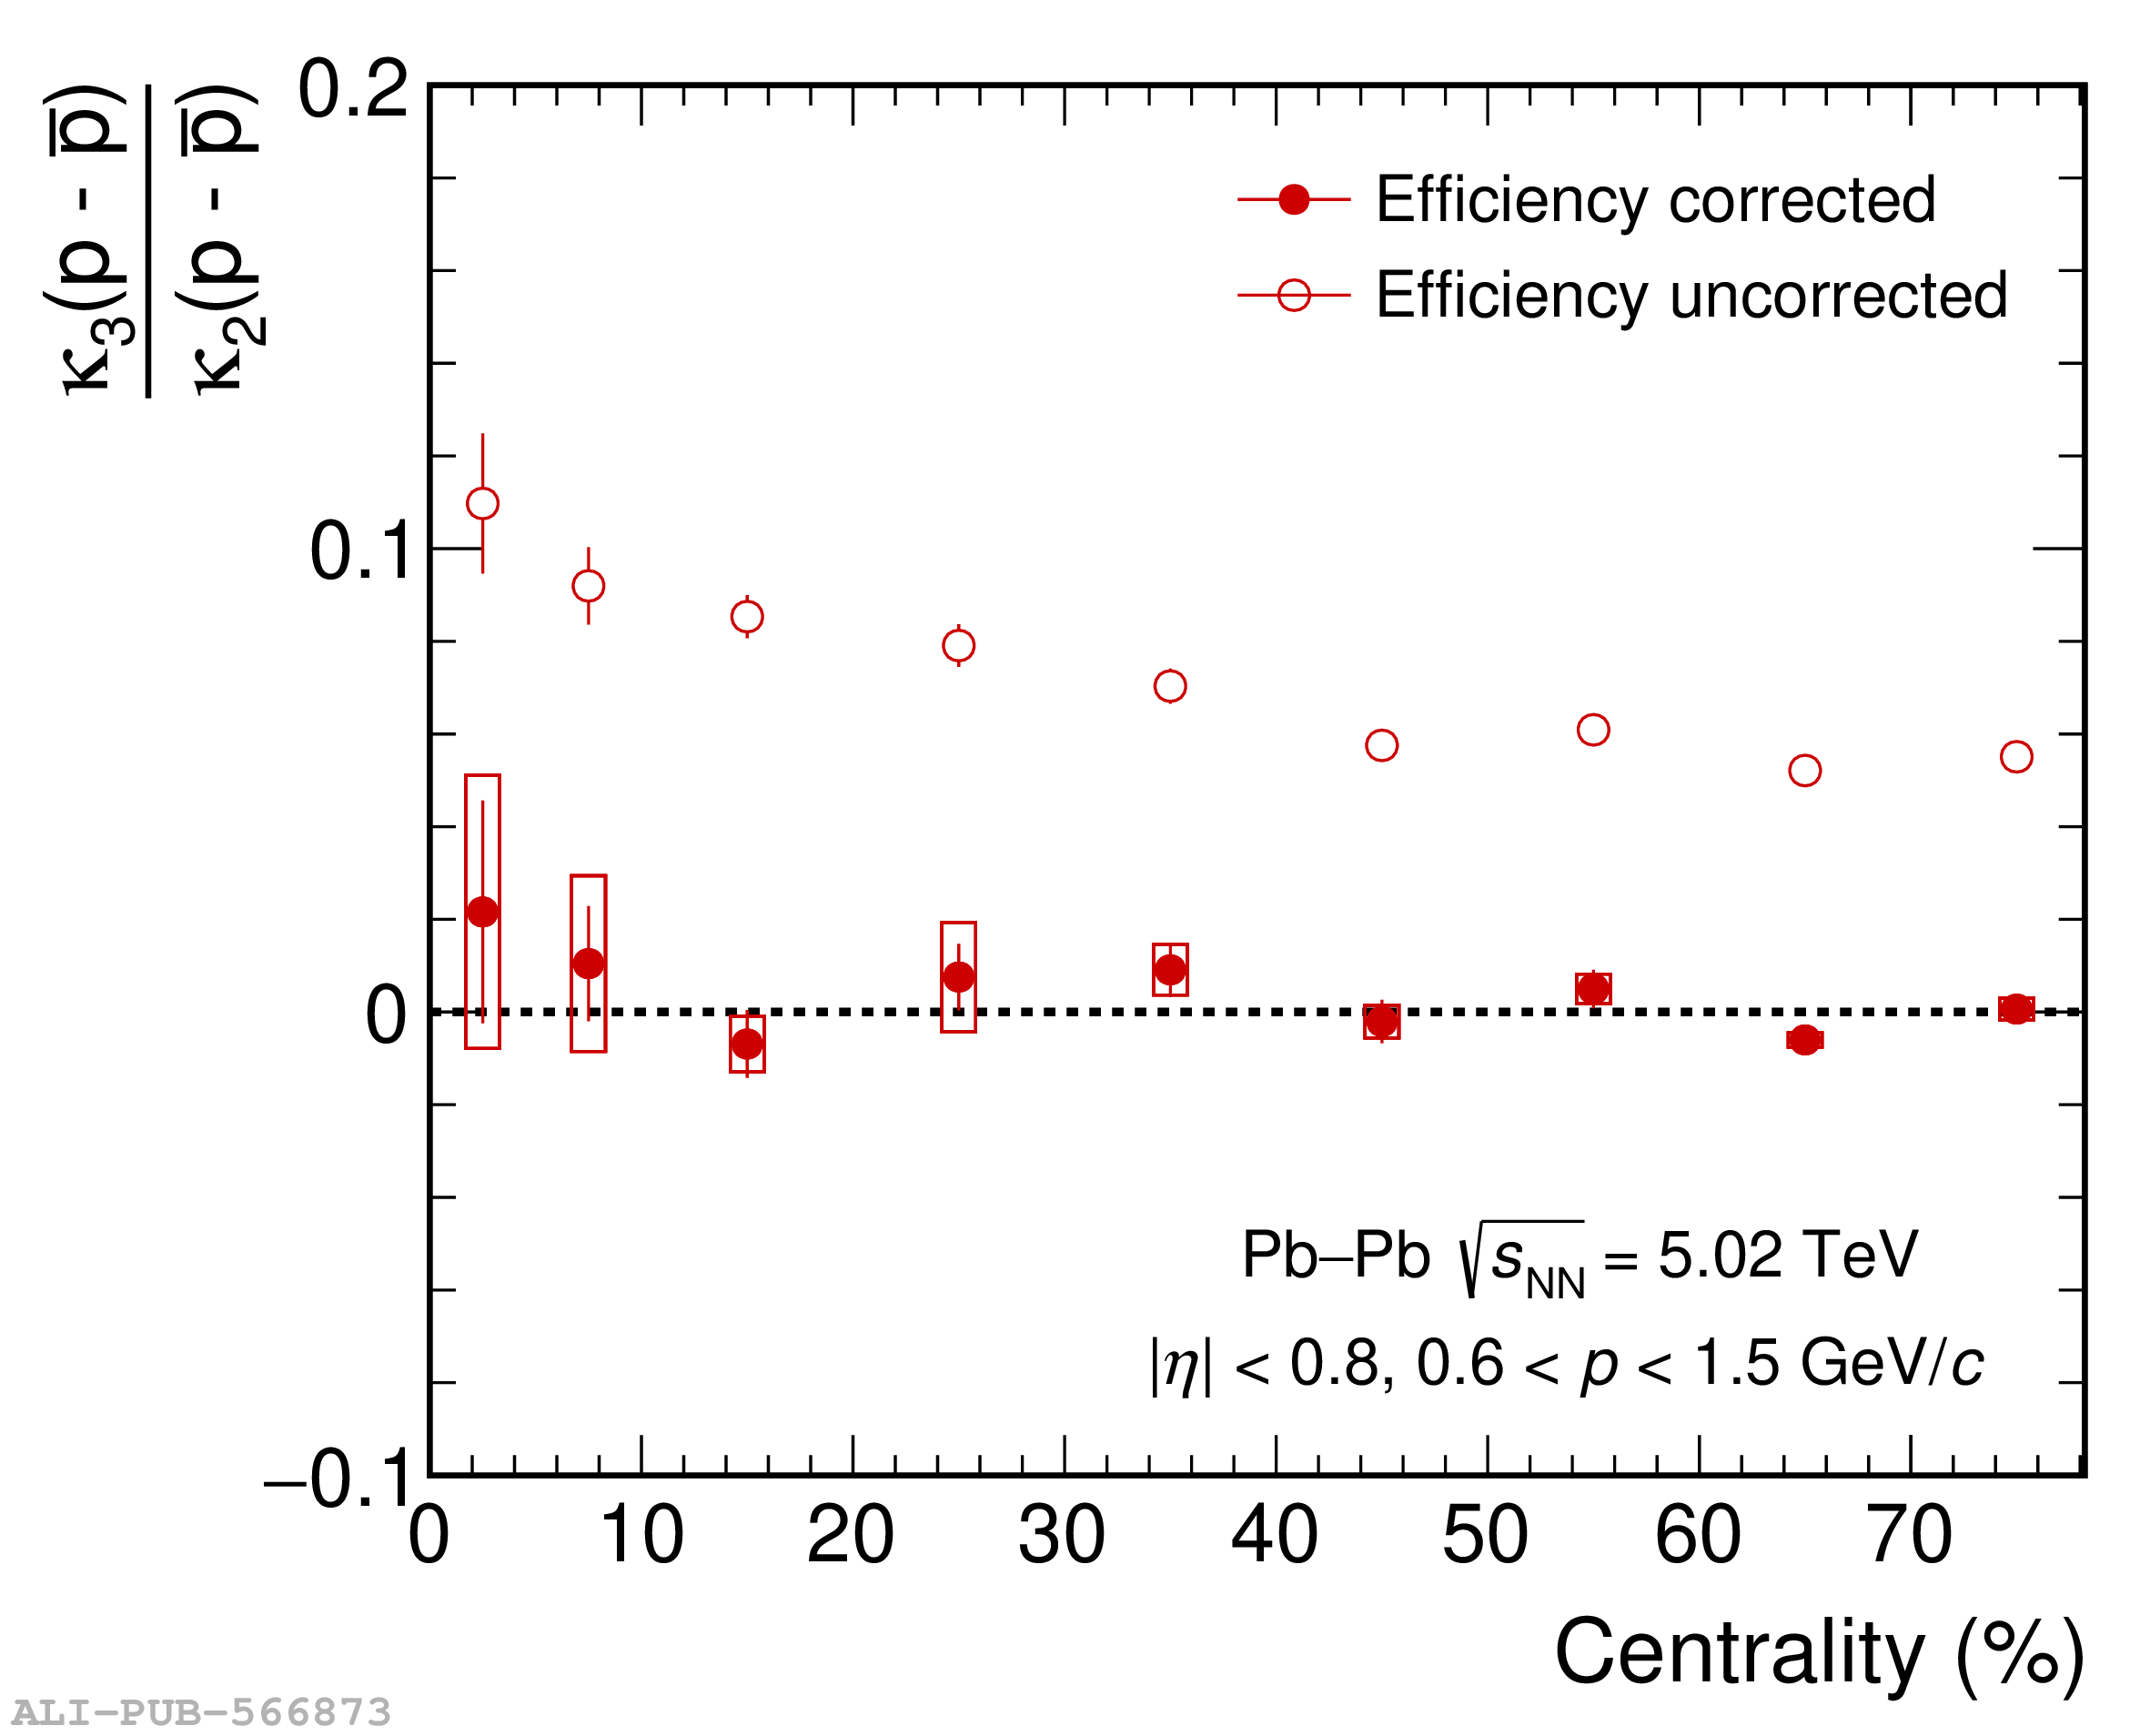

Figure 7
Centrality (left) and pseudorapidity interval (right) dependence of the ratio of third- to second-order cumulants for net protons at $\snn=5.02$ TeV. The ALICE data are shown by red markers, while the colored shaded bands represent the results from HIJING and EPOS model calculations. | 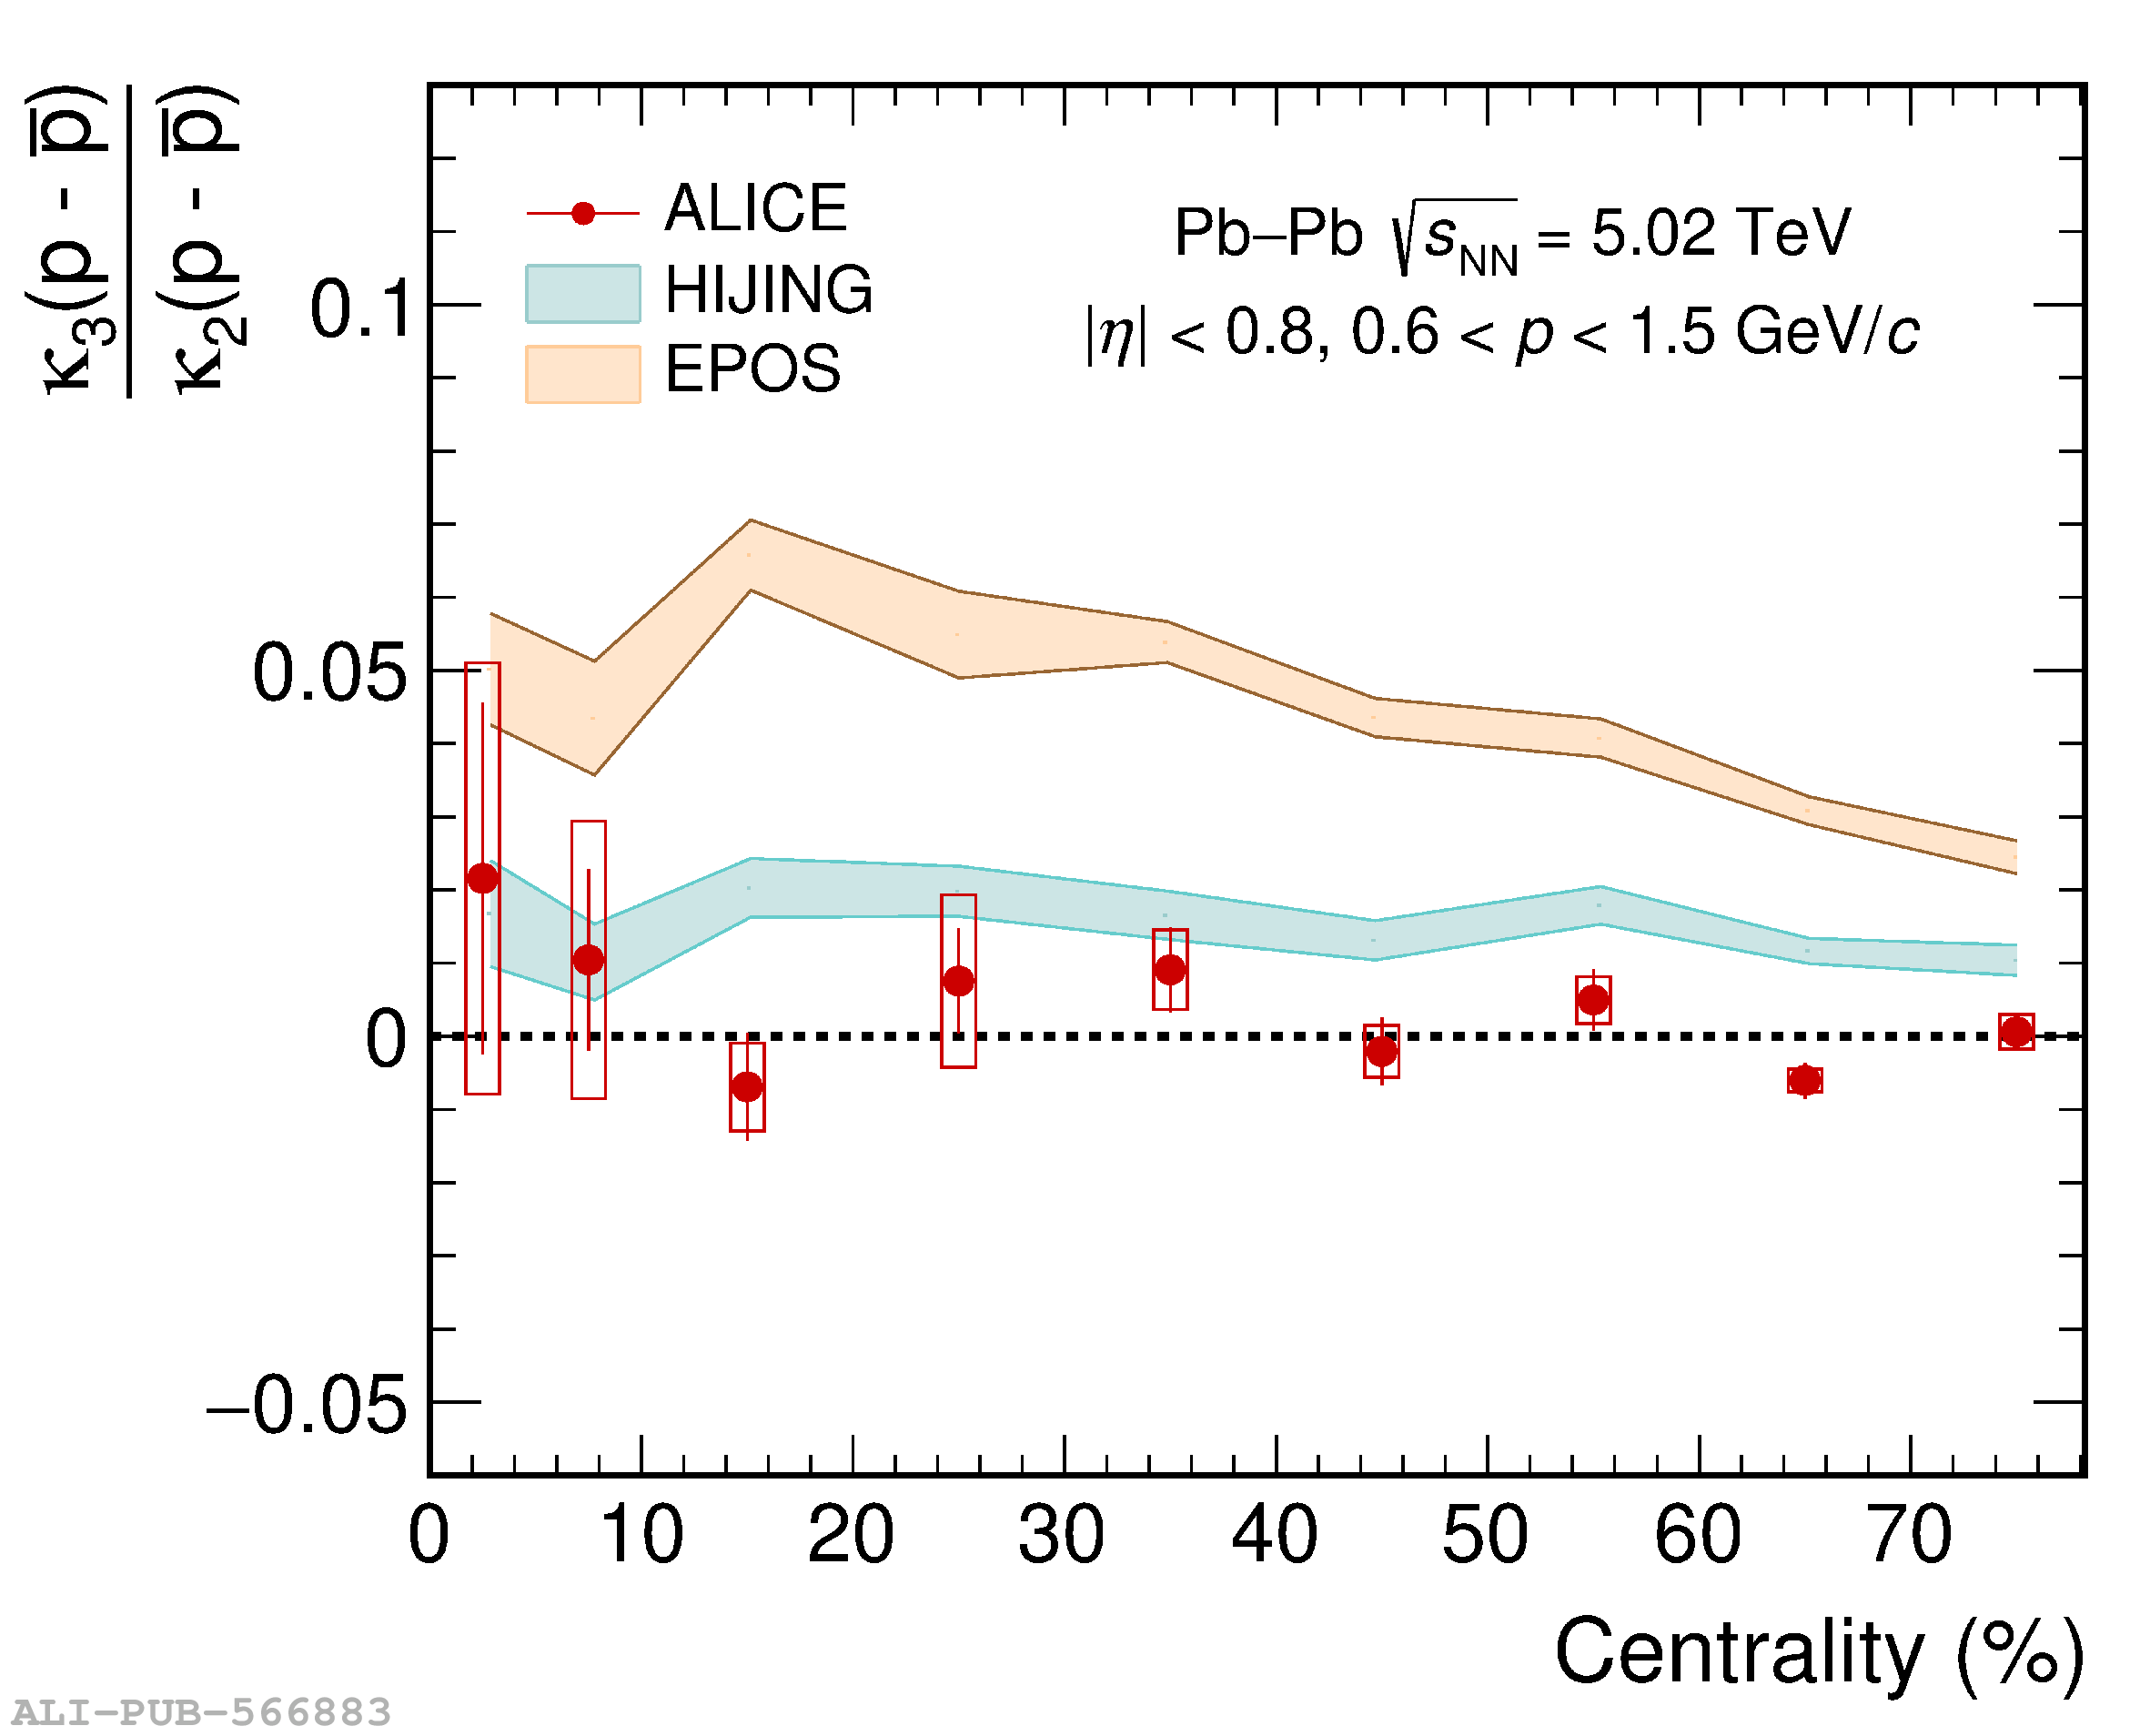 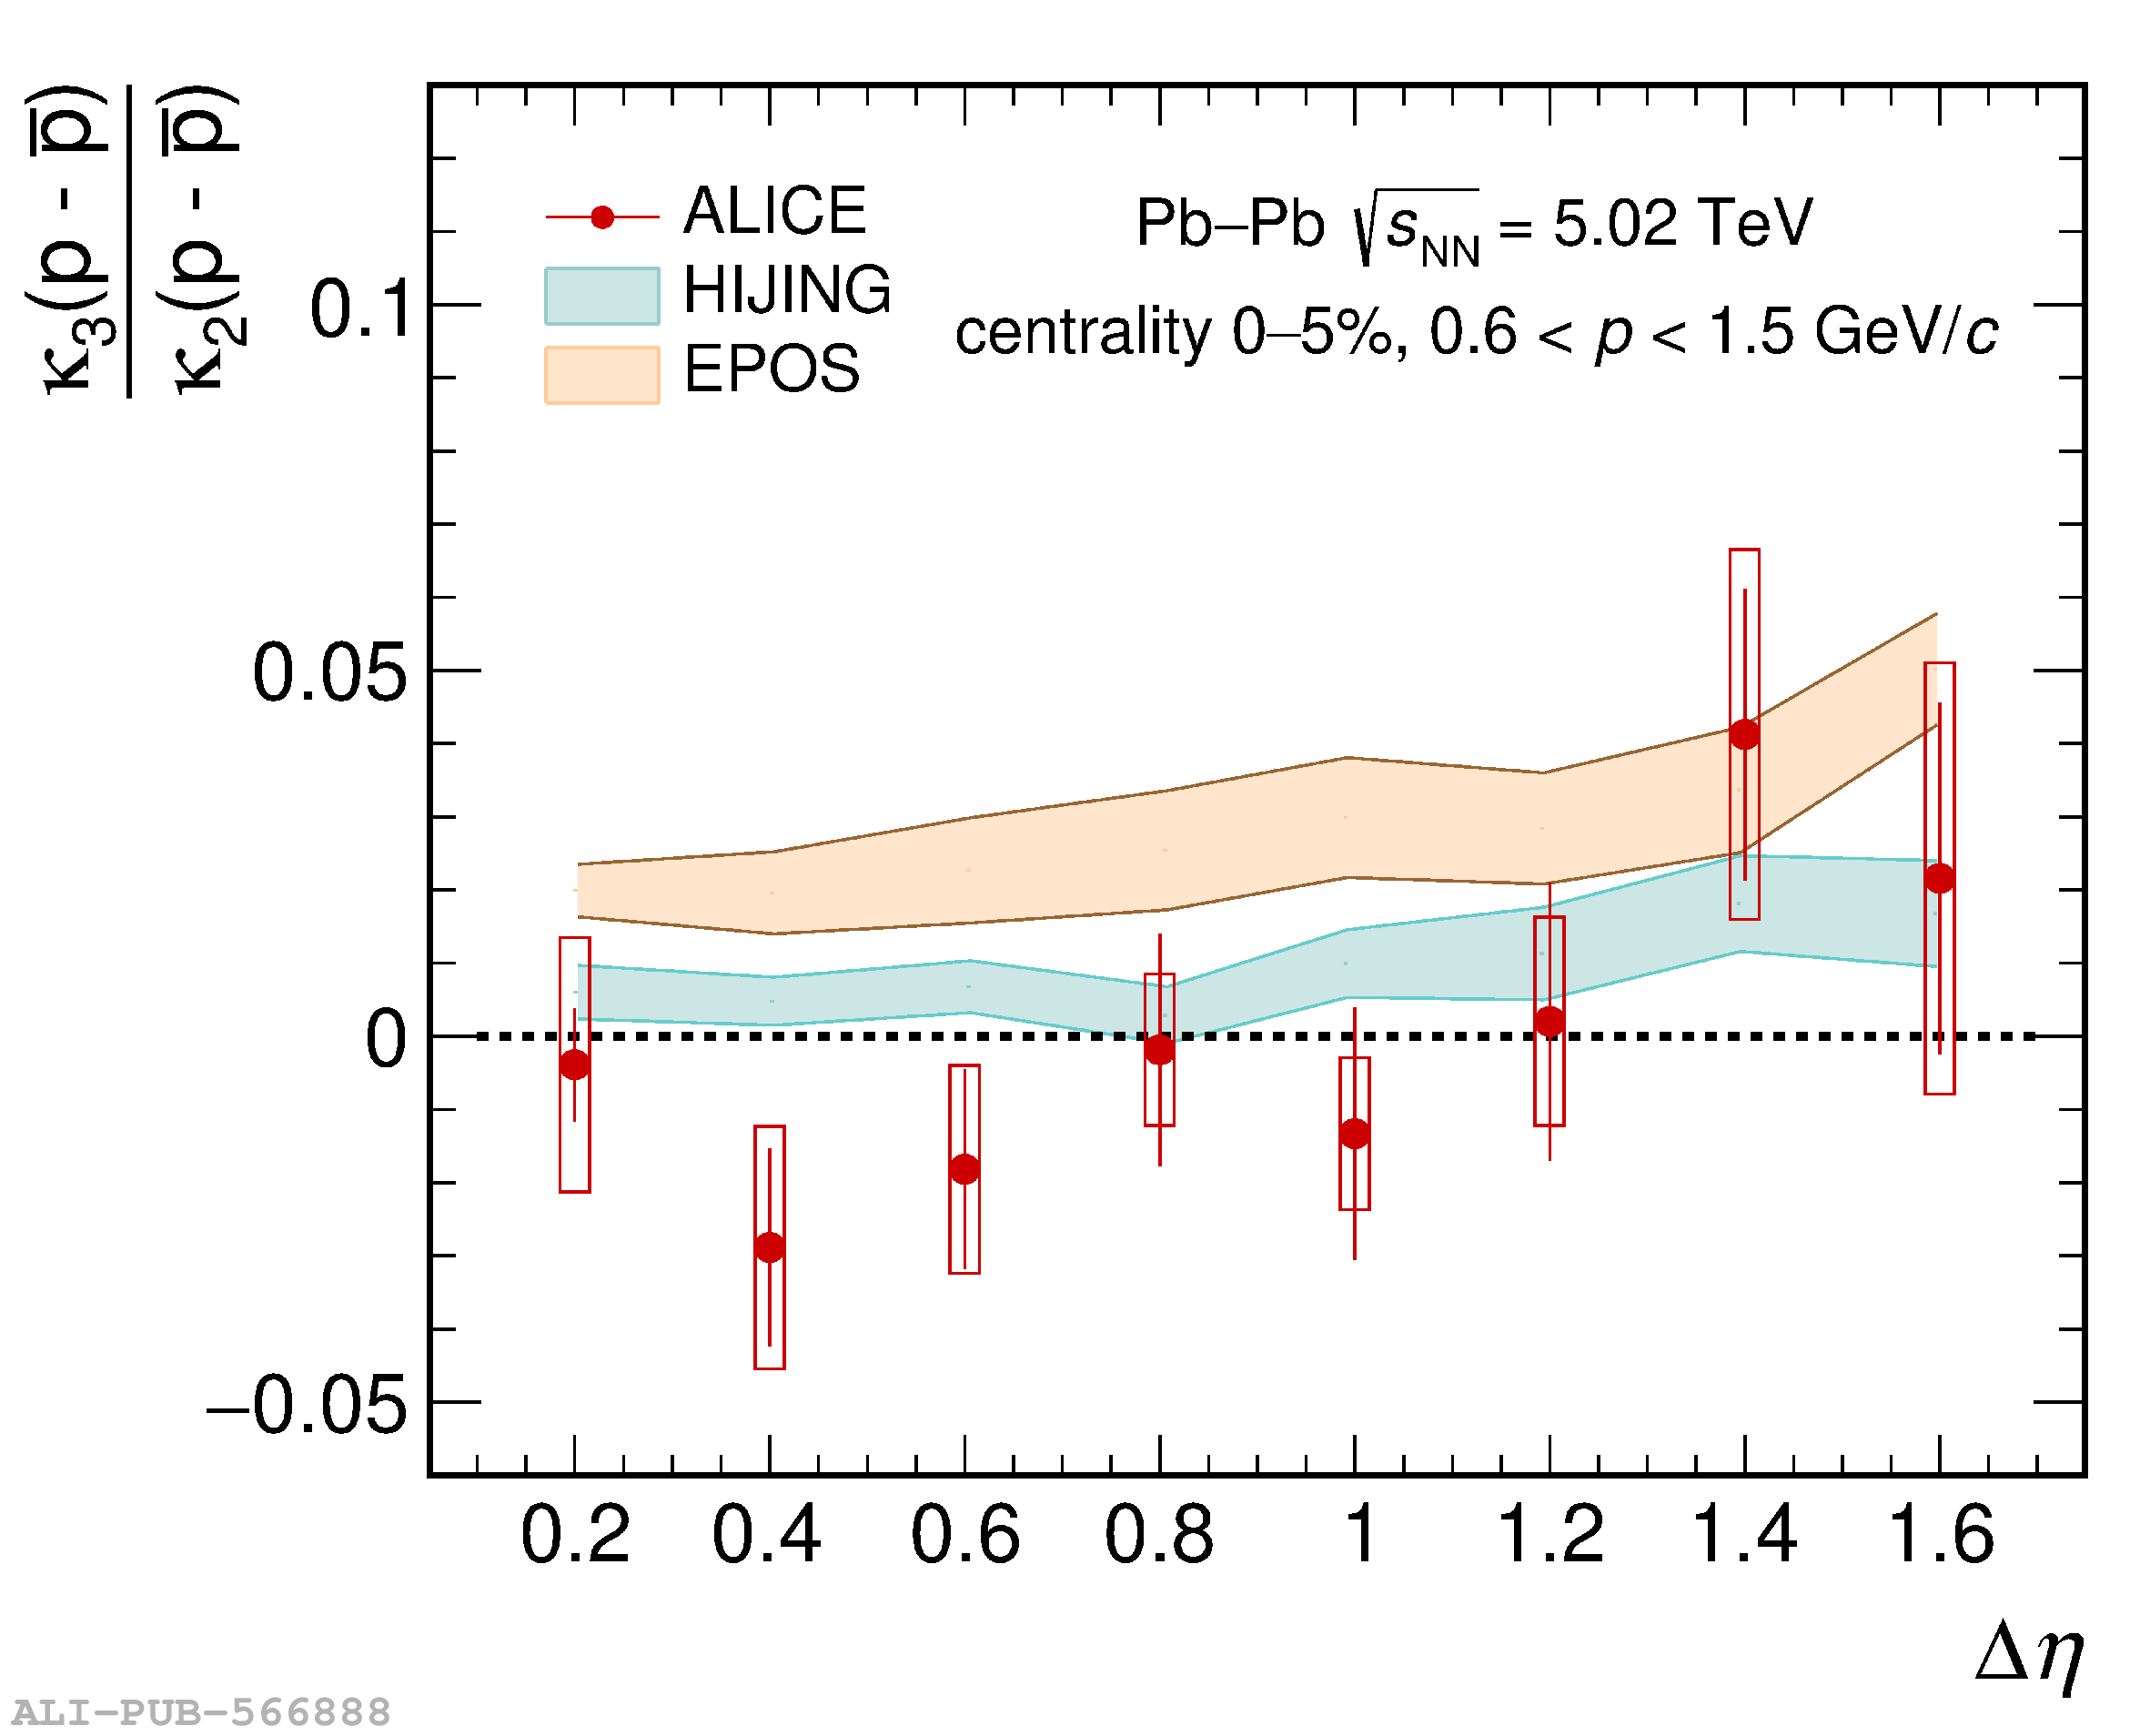 |