Pseudorapidity interval dependence of the second-order cumulants of net-pions (left) and net-kaons (right) normalized to the means (see text). The ALICE data are shown as solid black circles while the blue solid and dashed lines indicate the results from HIJING model calculations with and without resonance contributions, respectively. The error bars represent statistical uncertainties and the boxes around the data points represent the total systematic uncertainties. |  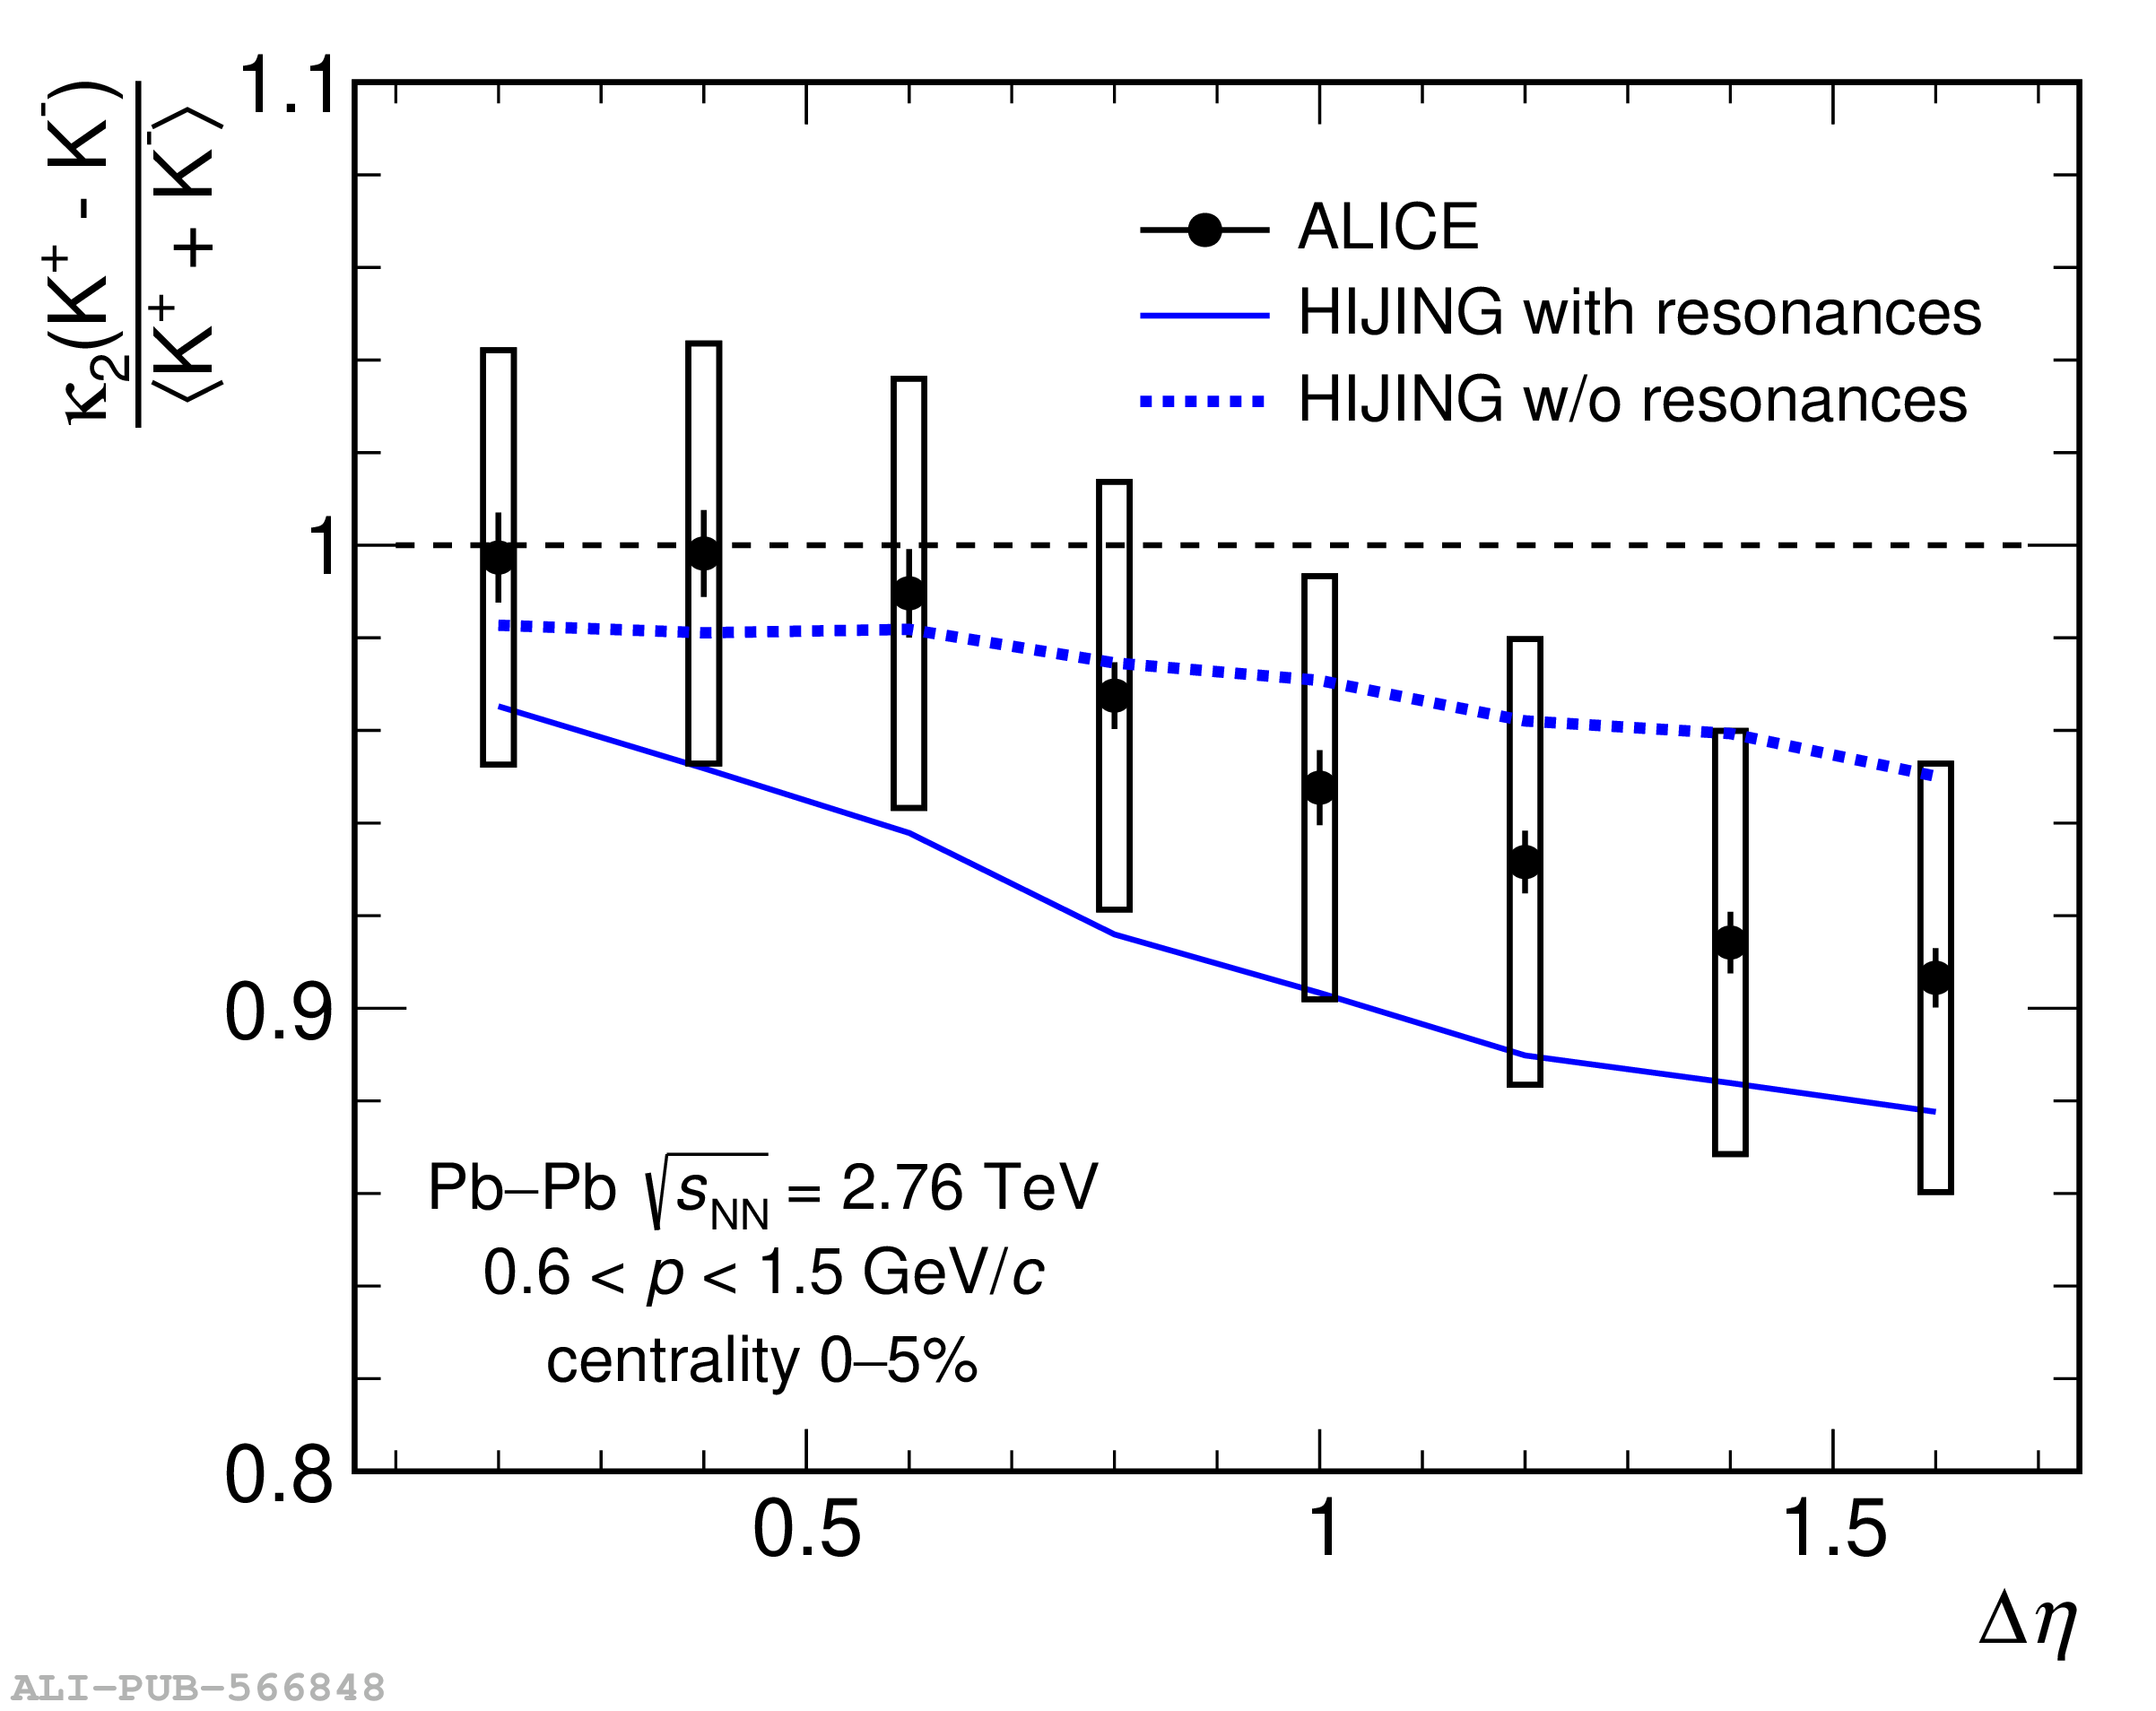 |