Near-side jet-like peak yield as a function of the $\it{p}^{\rm{LP}}_{\rm{T,min}}$ (left) and $\it{p}^{\rm{jet}}_{\rm{T,min}}$ (right). The filled circles show measurement with ALICE. The statistical and systematic uncertainties are shown as vertical bars and boxes, respectively. The measurements are compared with model descriptions from $\pythiam$, $\pythiashoving$, and $\epos$ for both selections. The total uncertainty of the ratio is represented by the gray band centered around unity. | 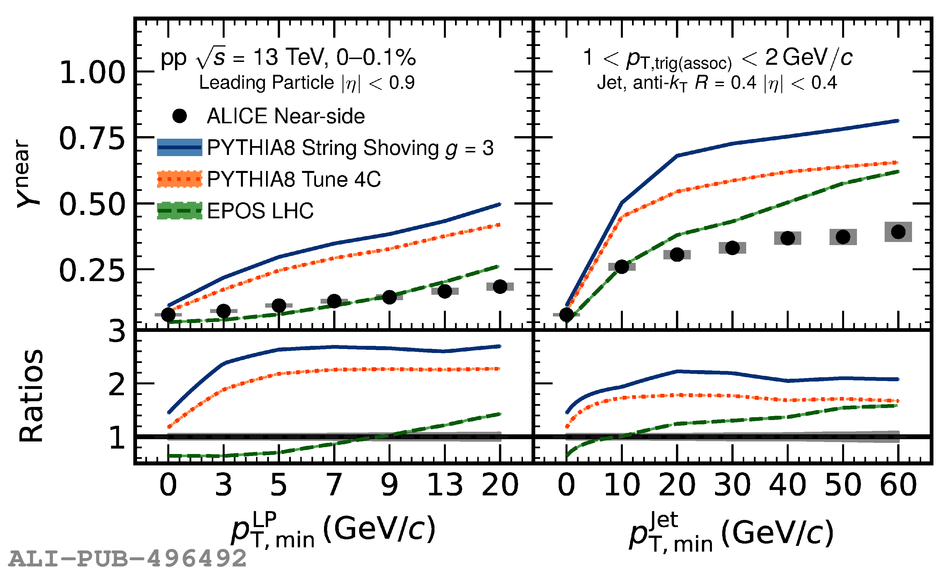 |