Fully corrected near-side ridge yield as a function transverse momentum. The open blue boxes denote the measurement by ALICE. The statistical and systematic uncertainties are shown as vertical bars and boxes, respectively. The CMS measurement is represented by filled circles and extends down to lower $\pt$ due to the larger $\Delta\eta$ acceptance (see Sec. \ref{sec:ana}). The three lines show model predictions from $\pythiam$ (blue dotted line), $\pythiashoving$ (orange line), and $\epos$ (green dashed line). | 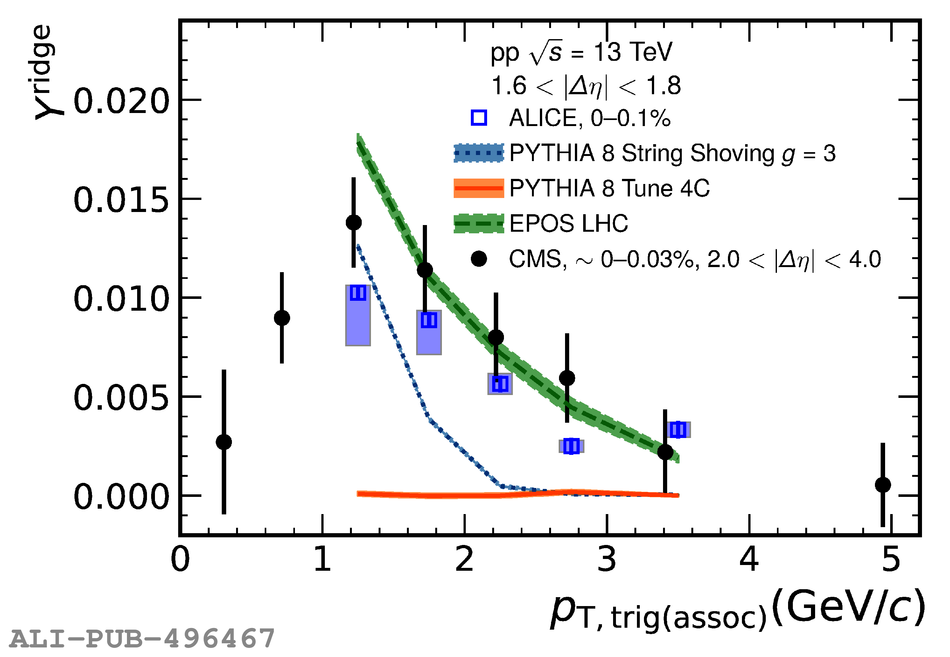 |