Spherical harmonics components (left) $C_{00}$ and (right) $\Re C_{11}$ of the \LamKchP correlation function for the 0--10\% centrality interval shown with results from the THERMINATOR 2 simulation implemented with different shifts in the outward direction, $\mu_{\mathrm{out}}$, as described in the text Statistical (lines) and systematic (boxes) uncertainties are shown for the experimental data | 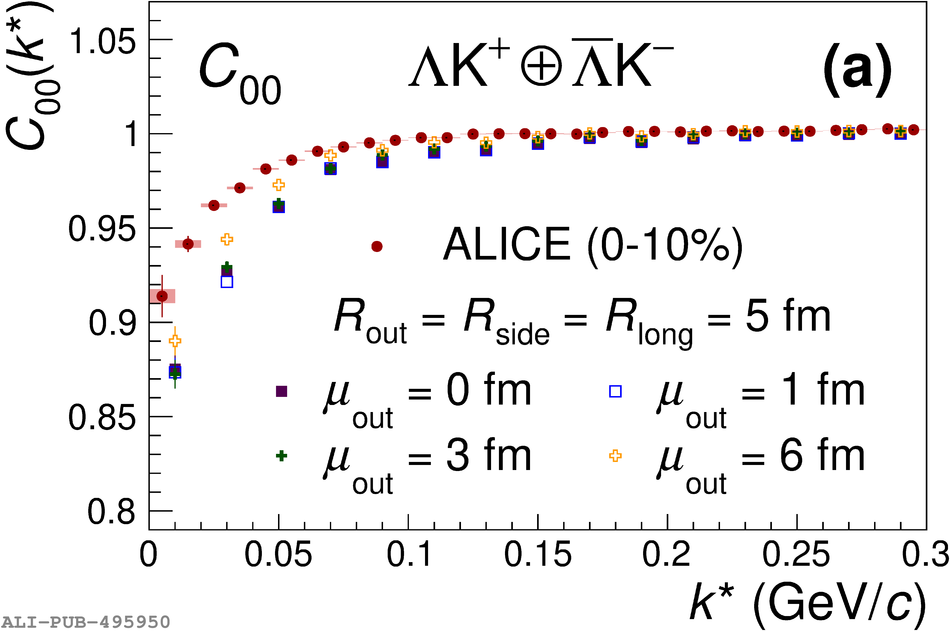 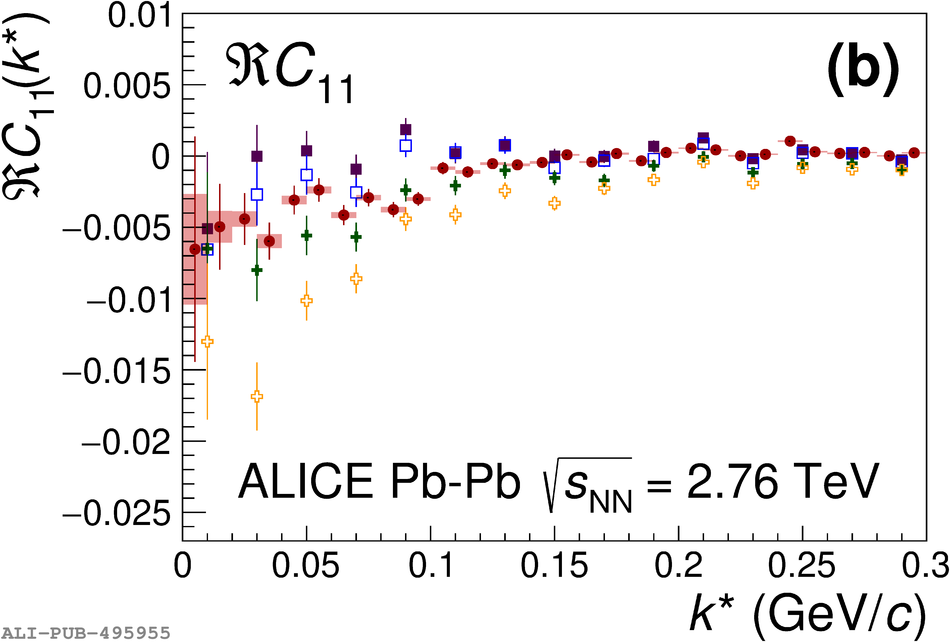 |