THERMINATOR 2 simulation (open squares) together with experimental data (closed circles) Statistical (lines) and systematic (boxes) uncertainties are shown for the experimental data Results are shown for \LamKchP (left), \LamKchM (middle), and \LamKs (right) Rows differentiate the different centrality intervals (0--10\% in the top, 10--30\% in the middle, and 30--50\% in the bottom) A sixth-order polynomial fit to the simulation is shown as a dashed curve. This polynomial is scaled to match the experimental data and is drawn as a solid curve | 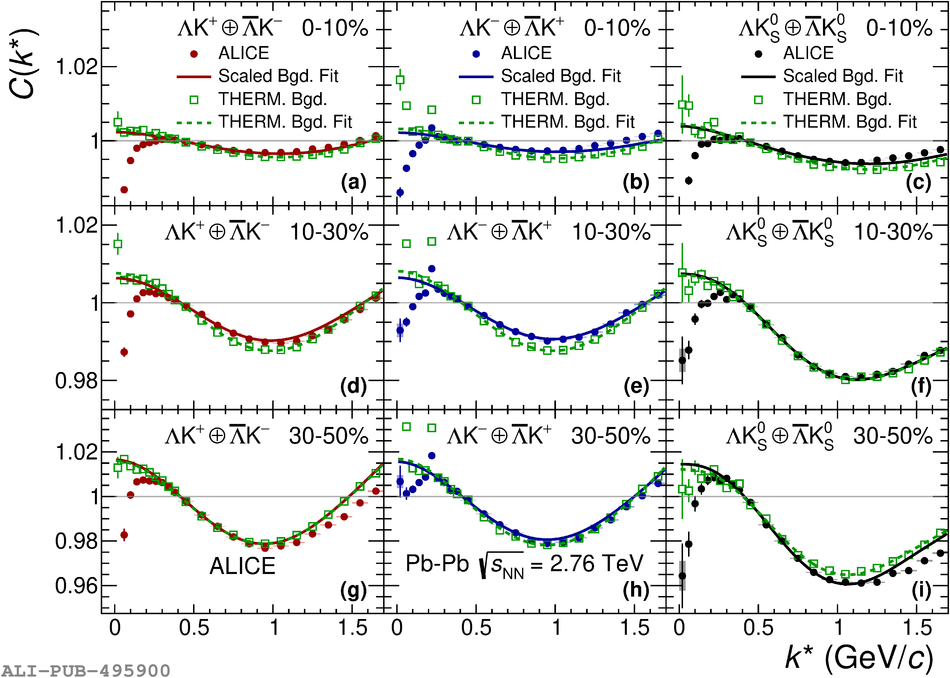 |