Inclusive J/$\psi$ $Q_{\rm PC}$ as a function of $p_{\rm T}$ for various centrality classes at backward (left) and forward (right) rapidity compared to the theoretical calculations . The vertical error bars represent the statistical uncertainties and the boxes around the data points the uncorrelated systematic uncertainties. The boxes centered at $Q_{\rm PC} = 1$ are the systematic uncertainties due to pile-up, $\langle T_{\rm pPb} \rangle$, and $F_{\rm norm}$. | 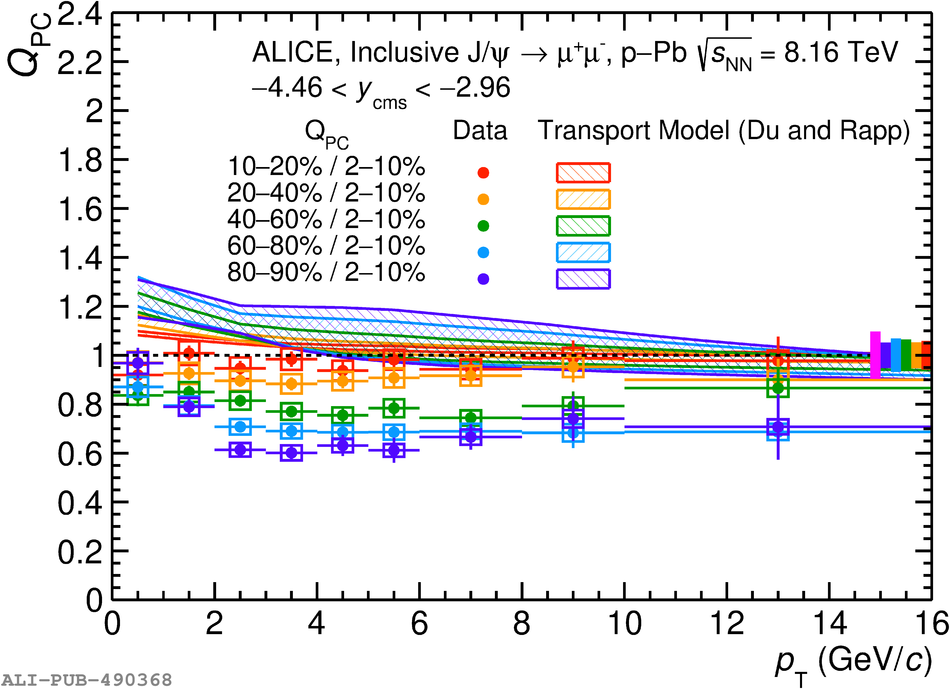  |