Fit to the dimuon invariant mass distribution for the p--Pb (top panels) and Pb--p (bottom panels) data sets, for the 20--40\% (left panels) and 60--80\% (right panels) ZN centrality classes. The extended Crystal Ball function is used to describe the $\jpsi$ and $\psip$ signals, while a Variable Width Gaussian function is used for the background. The red line represents the total fit. |  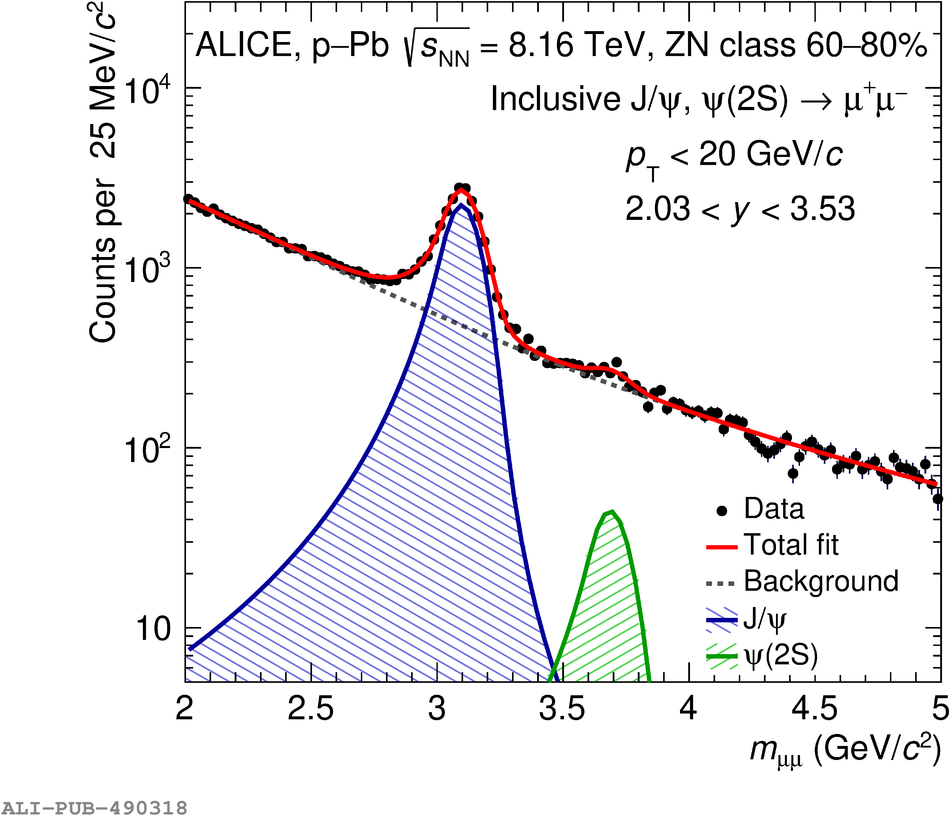 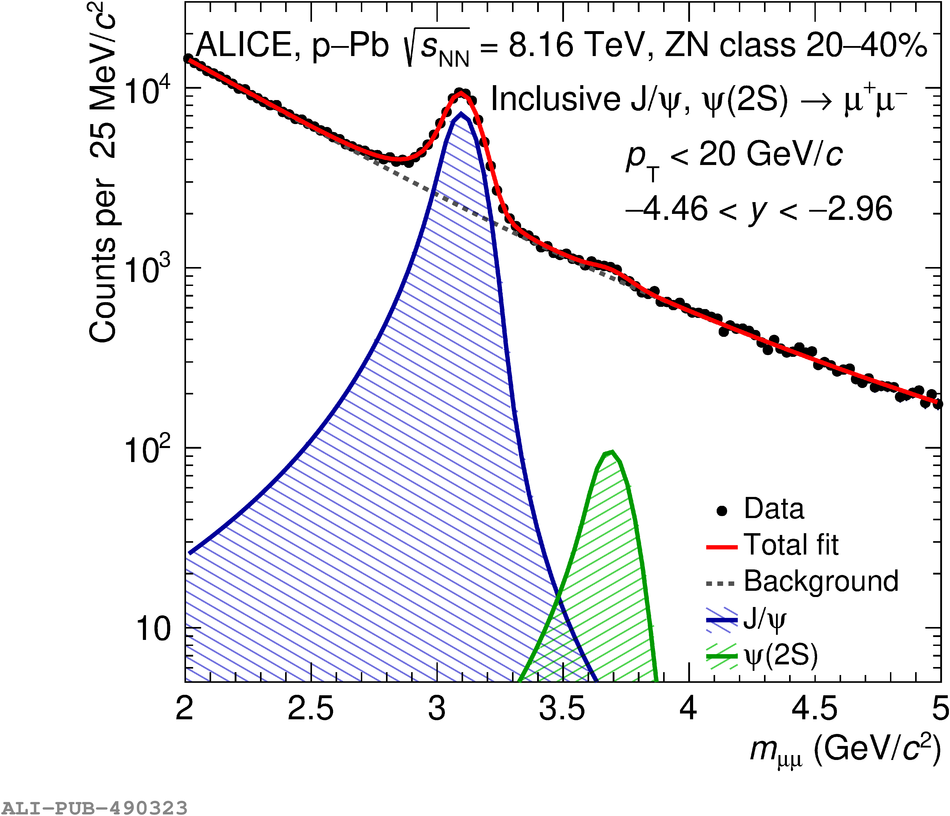 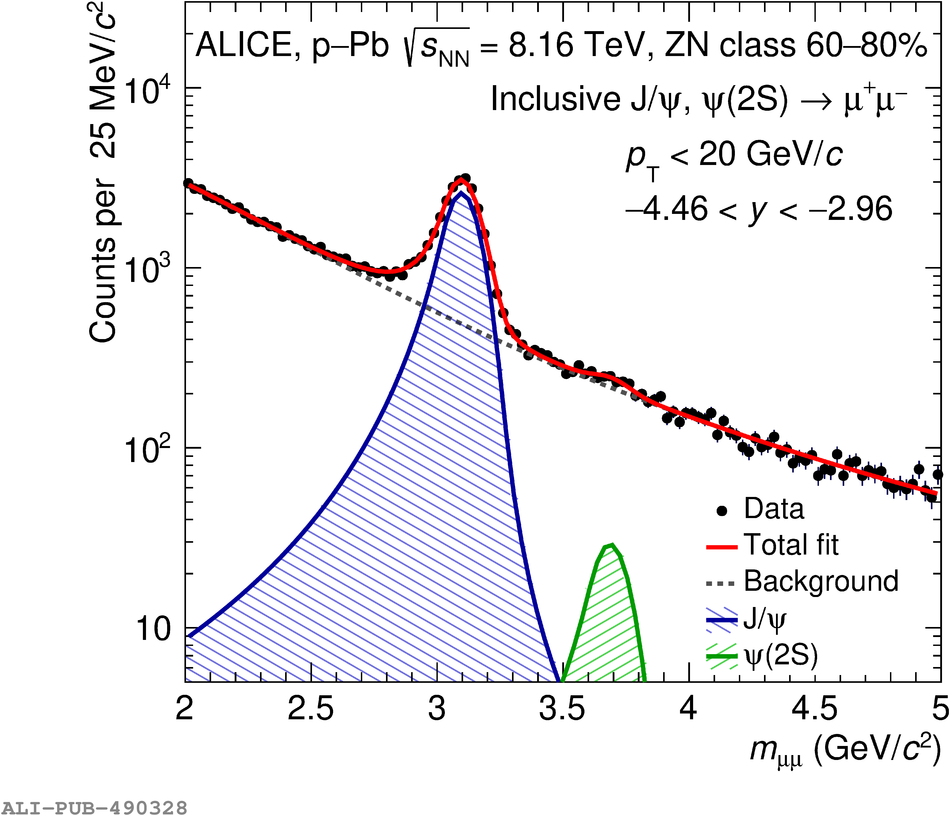 |