Distribution of the sum of amplitudes in the two VZERO arrays (black histogram) in Pb-Pb collisions at $\sqrt{s_{\rm NN}}=2.76$ TeV. The red line shows the fit with a Glauber model. The shaded areas define the different centrality classes of hadronic collisions. The inset shows the low amplitude part of the distribution. | 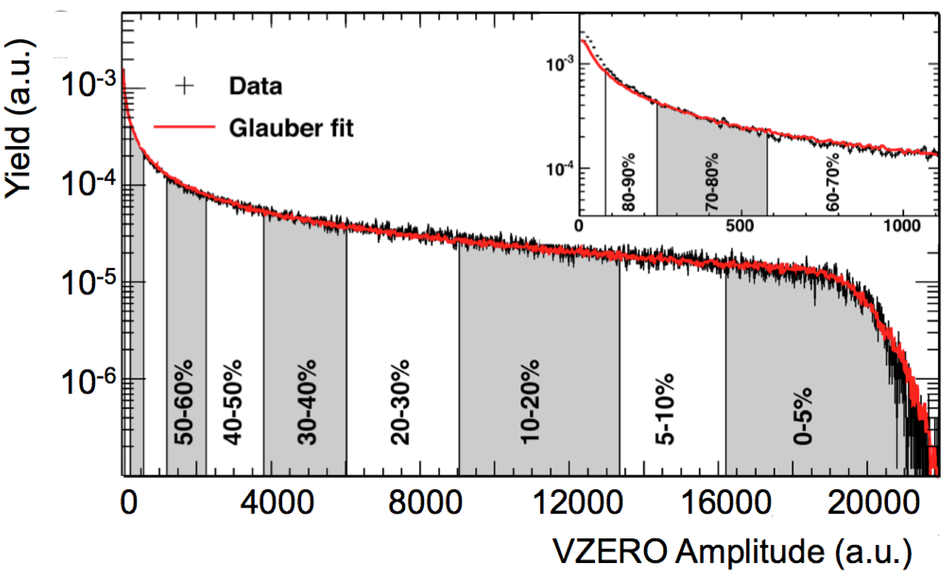 |