The $\pbarp$ ratio in pp collisions at $\sqrt{s} = 0.9$, $2.76$ and $7$ TeV as a function of the relative charged-particle pseudorapidity density. The data points are compared with prediction of PYTHIA (Perugia2011). The vertical bars (boxes) represent the statistical (systematic) uncertainty. Ratio of model to data is shown below using uncertainties added in quadrature. | 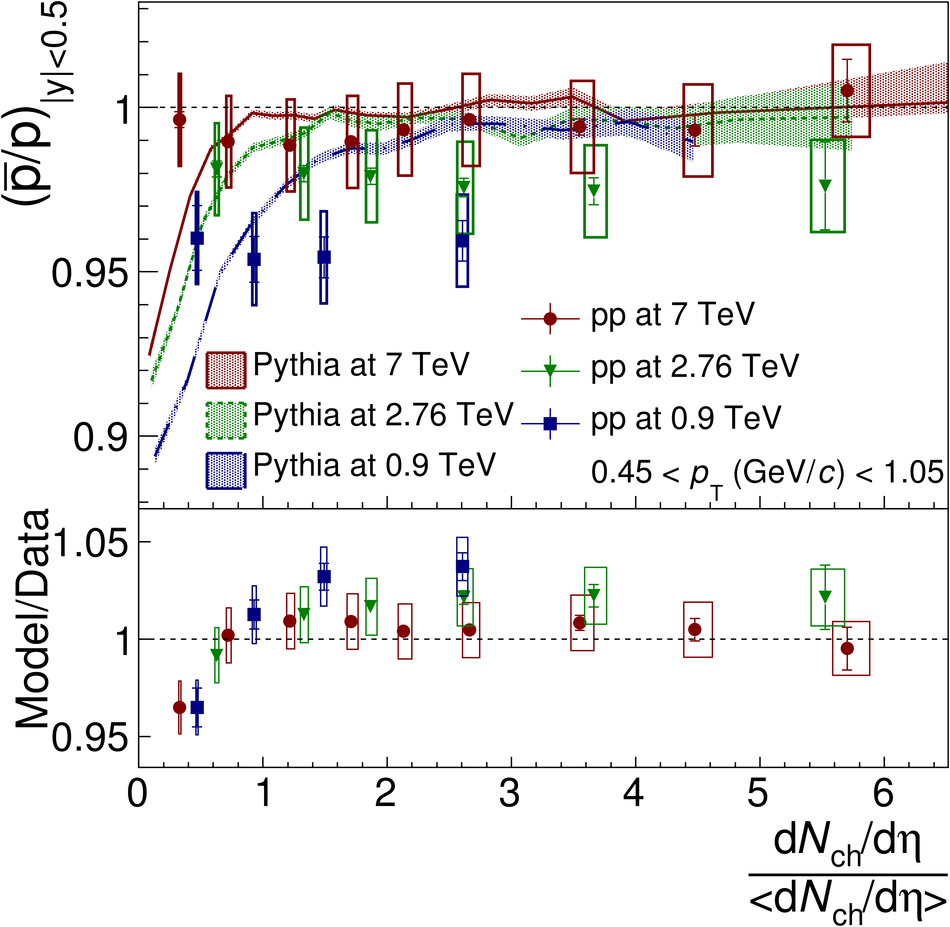 |