The nuclear modification factor $\Raa$ as a function of $\pt$ for different particle species. Results for $0-5\%$ (left) and $60-80\%$ (right) collision centralities are shown. Statistical and systematic uncertainties are plotted as vertical error bars and boxes around the points, respectively. The total normalization uncertainty (pp and PbPb) is indicated by the black boxes in the top panels [$Phys. Lett. B 720, 52 (2013)$]. | 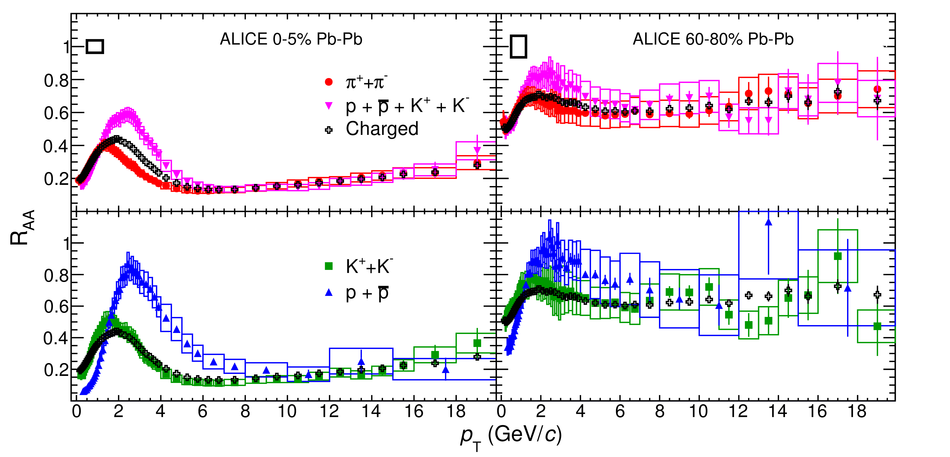 |