Top: Enhancements in the rapidity range $|y|< 0.5$ as a function of the mean number of participants $\avNpart$, showing LHC (ALICE, full symbols), RHIC and SPS (open symbols) data. The LHC data use interpolated pp values (see text). Boxes on the dashed line at unity indicate statistical and systematic uncertainties on the pp or p-Be reference. Error bars on the data points represent the corresponding uncertainties for all the heavy-ion measurements and those for p-Pb at the SPS.
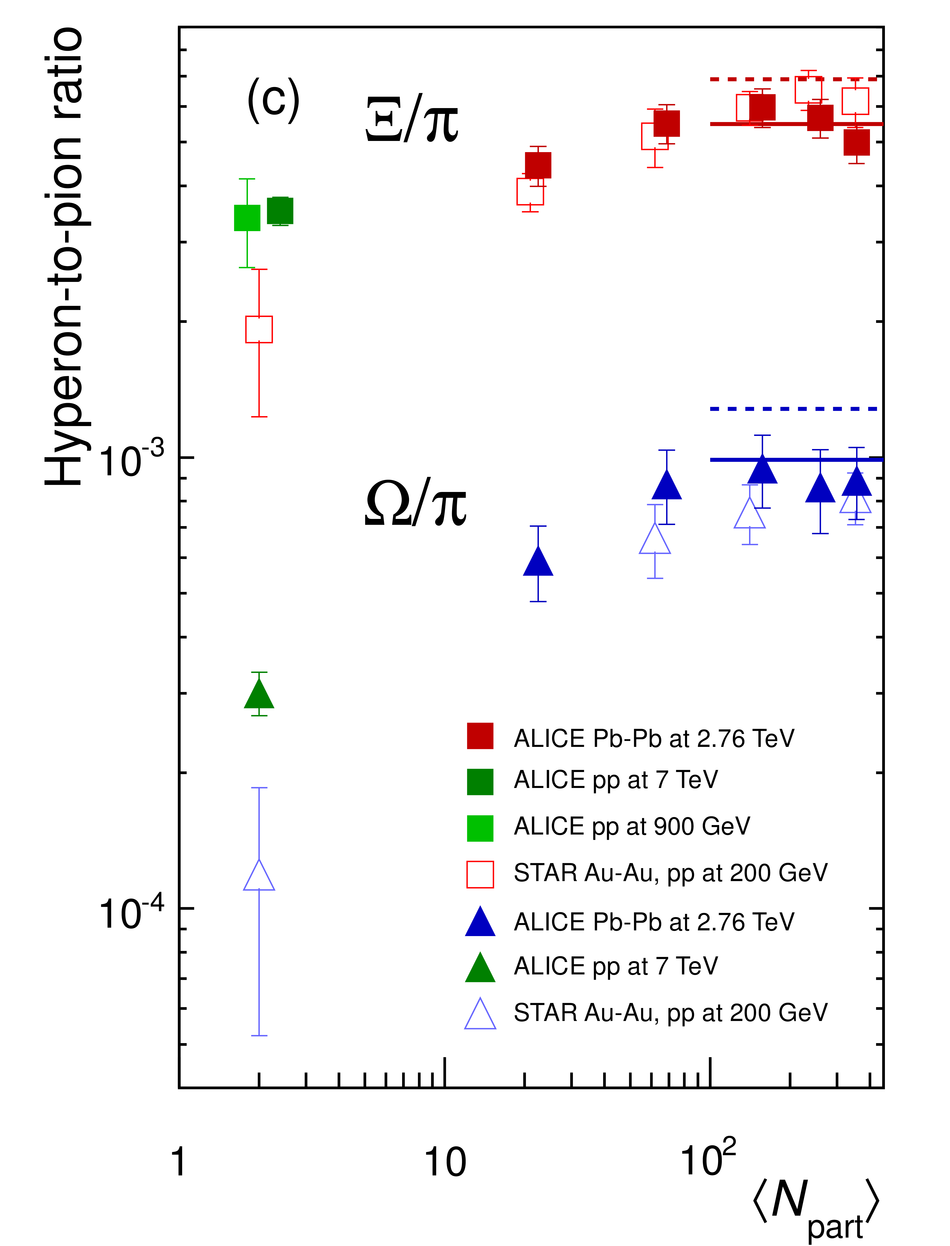
Bottom: Hyperon-to-pion ratios as a function of $\avNpart$, for A-A and pp collisions at LHC and RHIC energies. The lines mark thermal model predictions. | 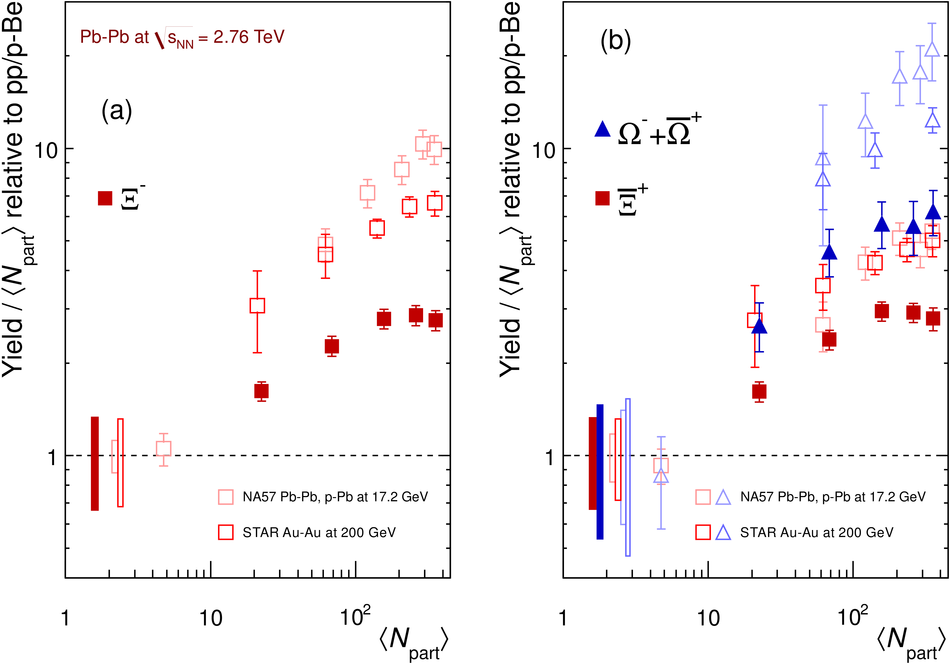 |