Schema of the HLT components The colored boxes represent processes accelerated by GPU/FPGA (green), normal processes (blue), processes that produced HLT output that is stored (dark blue), entities that store data (purple), asynchronous failure-resilient processes (dark red), classical QA components that use the original HLT data flow (brown), input (orange), and sensor data (red) Incoming data are passed through by the \mbox{C-RORC} FPGA cards or processed internally The input nodes locally merge data from all links belonging to one event The compute nodes then merge all fragments belonging to one event and run the reconstruction The bottom of the diagram shows the asynchronous online calibration chain with a feedback loop as described in Section \ref{sec:calibration} | 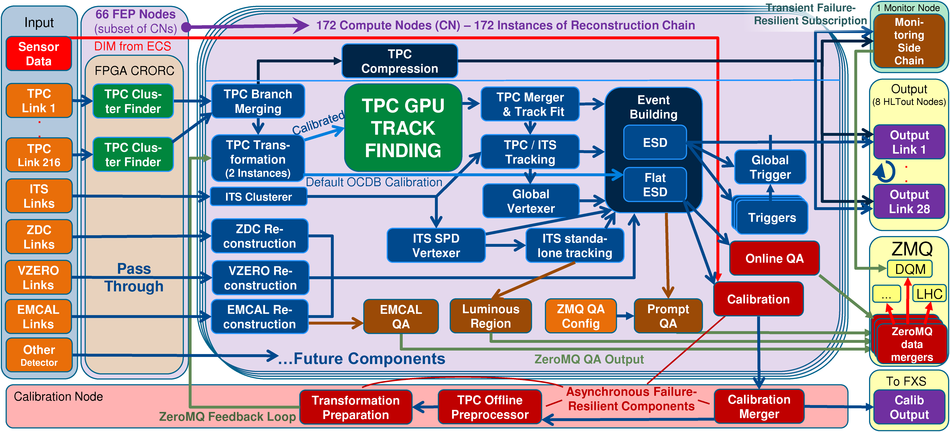 |