Measurements of the production of electrons from heavy-flavour hadron decays in pp collisions at $\sqrt{s} = 13$ TeV at midrapidity with the ALICE detector are presented down to a transverse momentum ($p_{\rm T}$) of 0.2 GeV$/c$ and up to $p_{\rm T} = 35$ GeV$/c$, which is the largest momentum range probed for inclusive electron measurements in ALICE. In p$-$Pb collisions, the production cross section and the nuclear modification factor of electrons from heavy-flavour hadron decays are measured in the $p_{\rm T}$ range $0.5 <~ p_{\rm T} <~ 26$ GeV$/c$ at $\sqrt{s_{\rm NN}} = 8.16$ TeV. The nuclear modification factor is found to be consistent with unity within the statistical and systematic uncertainties. In both collision systems, first measurements of the yields of electrons from heavy-flavour hadron decays in different multiplicity intervals normalised to the multiplicity-integrated yield (self-normalised yield) at midrapidity are reported as a function of the self-normalised charged-particle multiplicity estimated at midrapidity. The self-normalised yields in pp and p$-$Pb collisions grow faster than linear with the self-normalised multiplicity. A strong $p_{\rm T}$ dependence is observed in pp collisions, where the yield of high-$p_{\rm T}$ electrons increases faster as a function of multiplicity than the one of low-$p_{\rm T}$ electrons. The measurement in p$-$Pb collisions shows no $p_{\rm T}$ dependence within uncertainties. The self-normalised yields in pp and p$-$Pb collisions are compared with measurements of other heavy-flavour, light-flavour, and strange particles, and with Monte Carlo simulations.
JHEP 08 (2023) 006
HEP Data
e-Print: arXiv:2303.13349 | PDF | inSPIRE
CERN-EP-2023-041
Figure group
Figure 1
TPC d$E/$d$x$ signal, expressed in terms of deviation from the expected electron energy loss as a function of momentum (left panel) and fit of the measured $n^{\rm{TPC}}_{\sigma,\rm{e}}$ distribution after the $n^{\rm{TOF}}_{\sigma,\rm{e}}$ requirement in the momentum range 2.9 $< p <$ 3.0 \GeVc (right panel) in pp collisions at $\sqrt{s}$ $=$ 13 TeV for the low-$B$ field data set. | 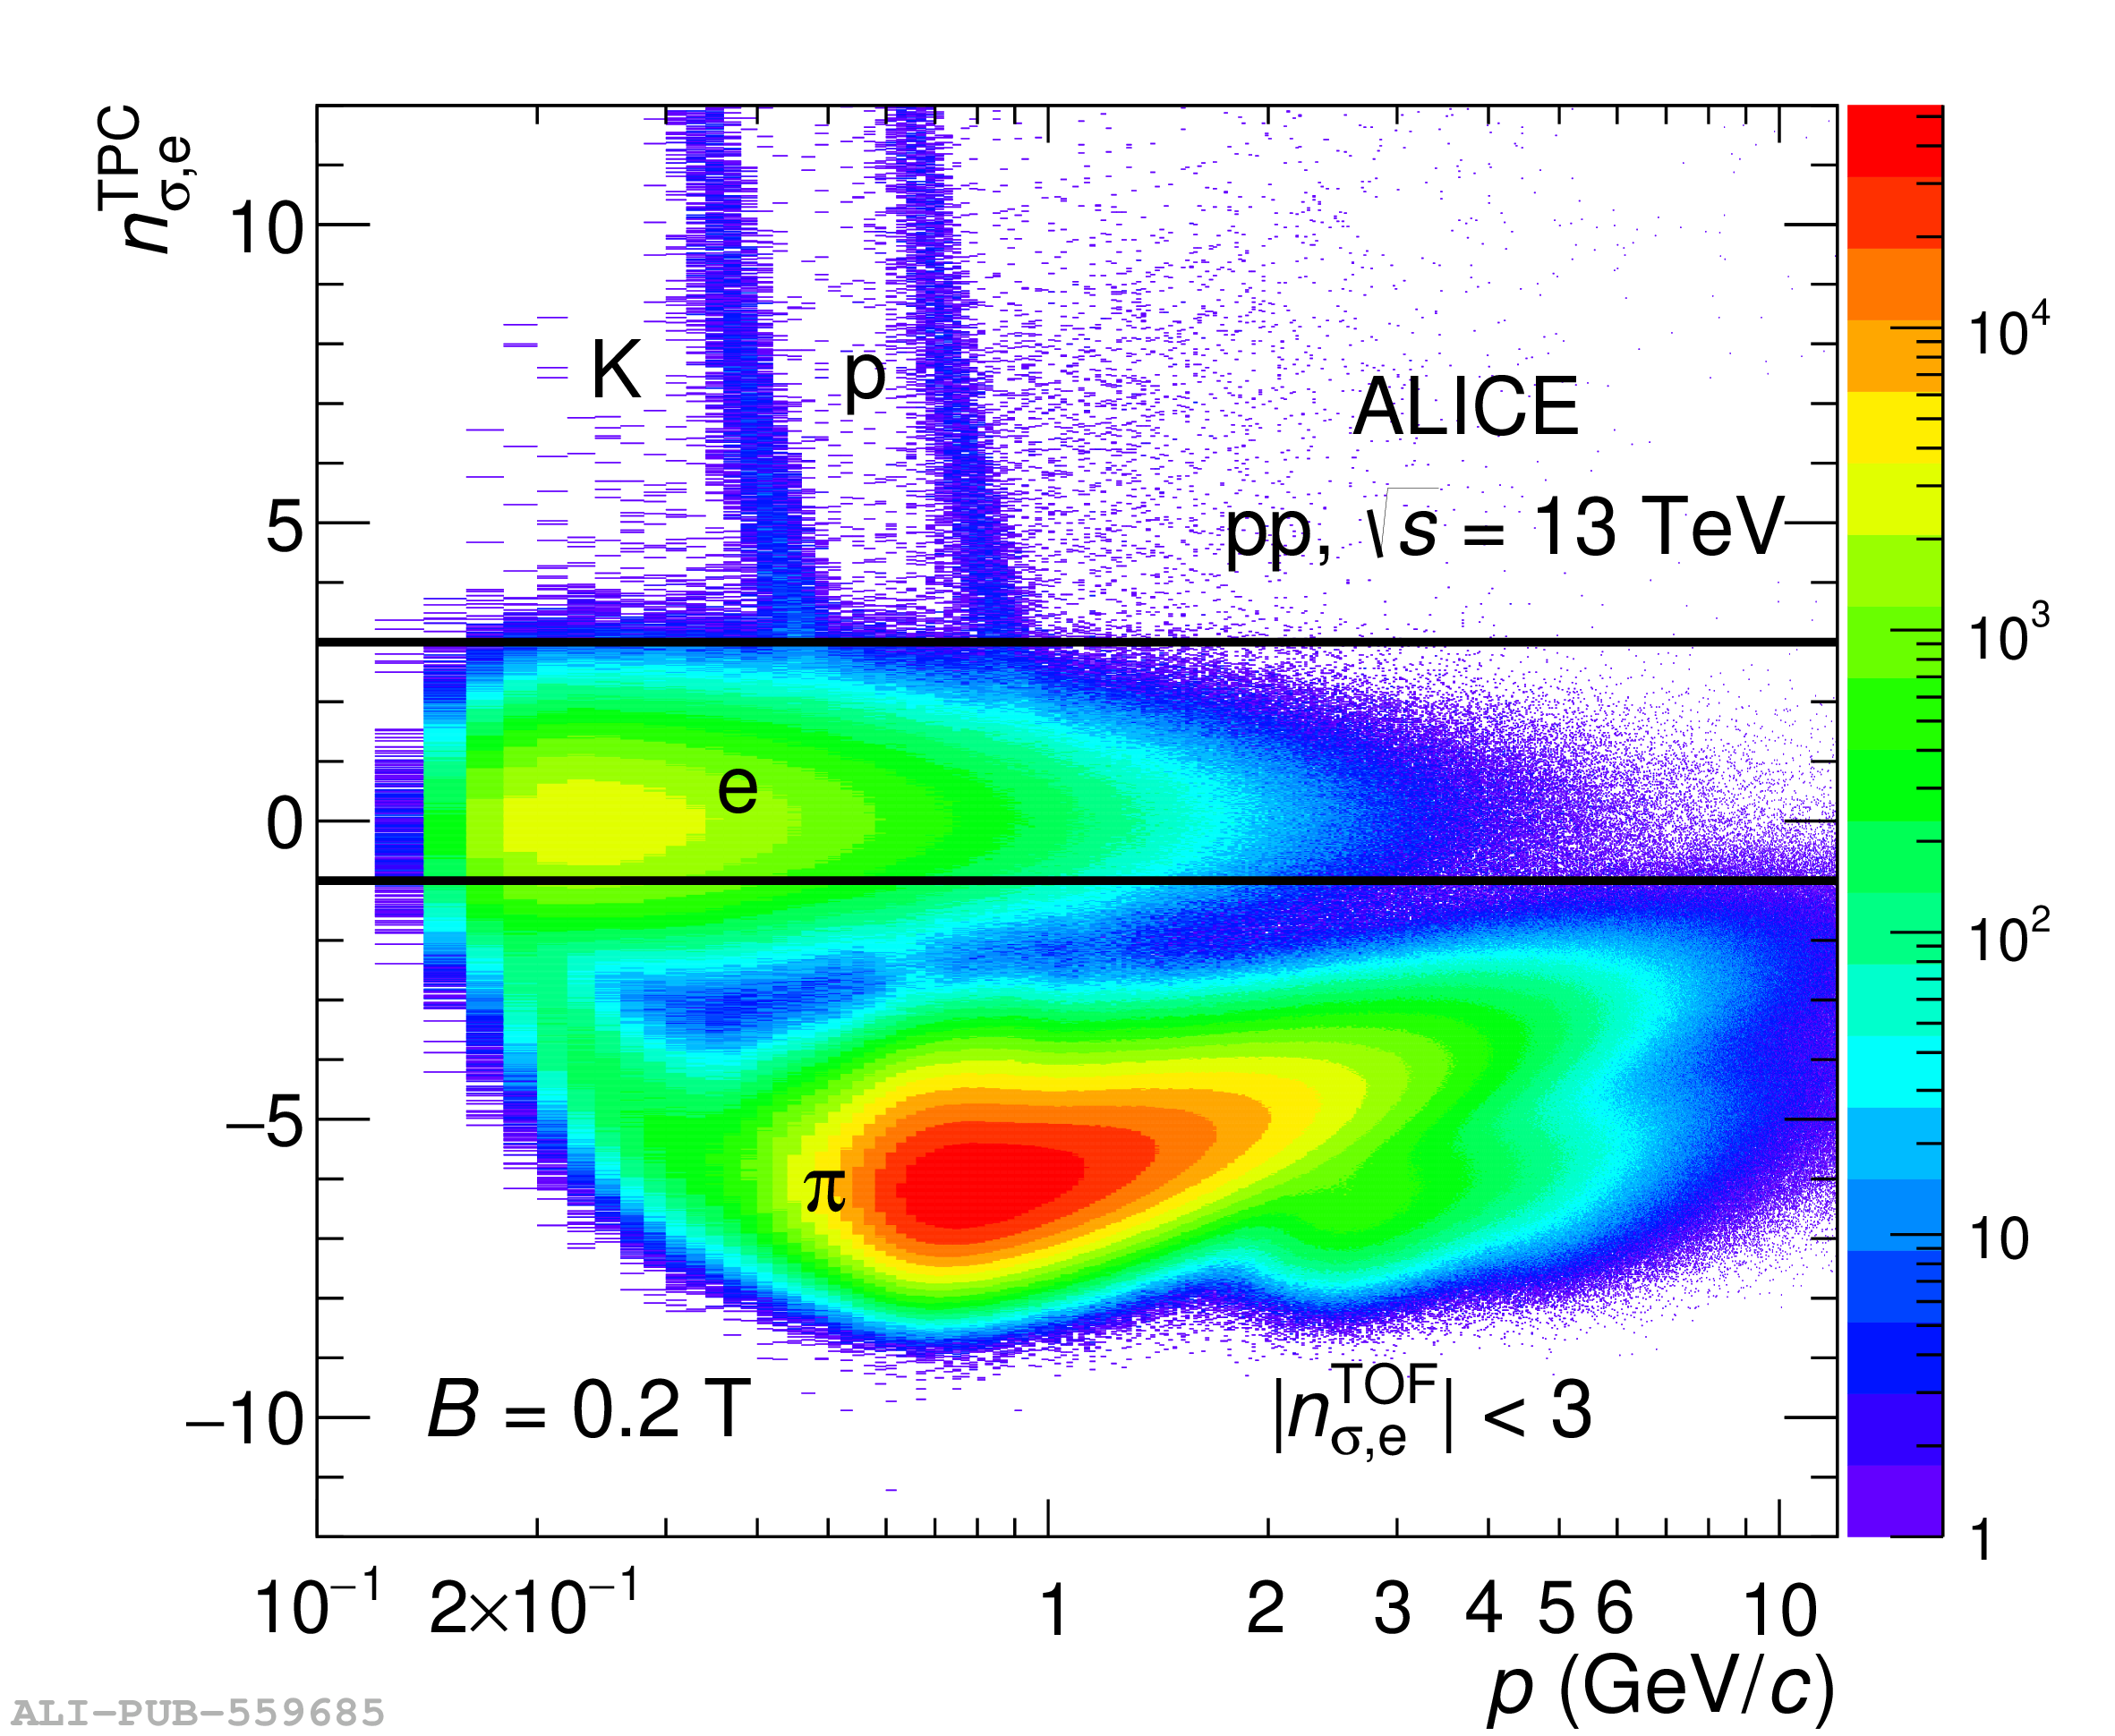 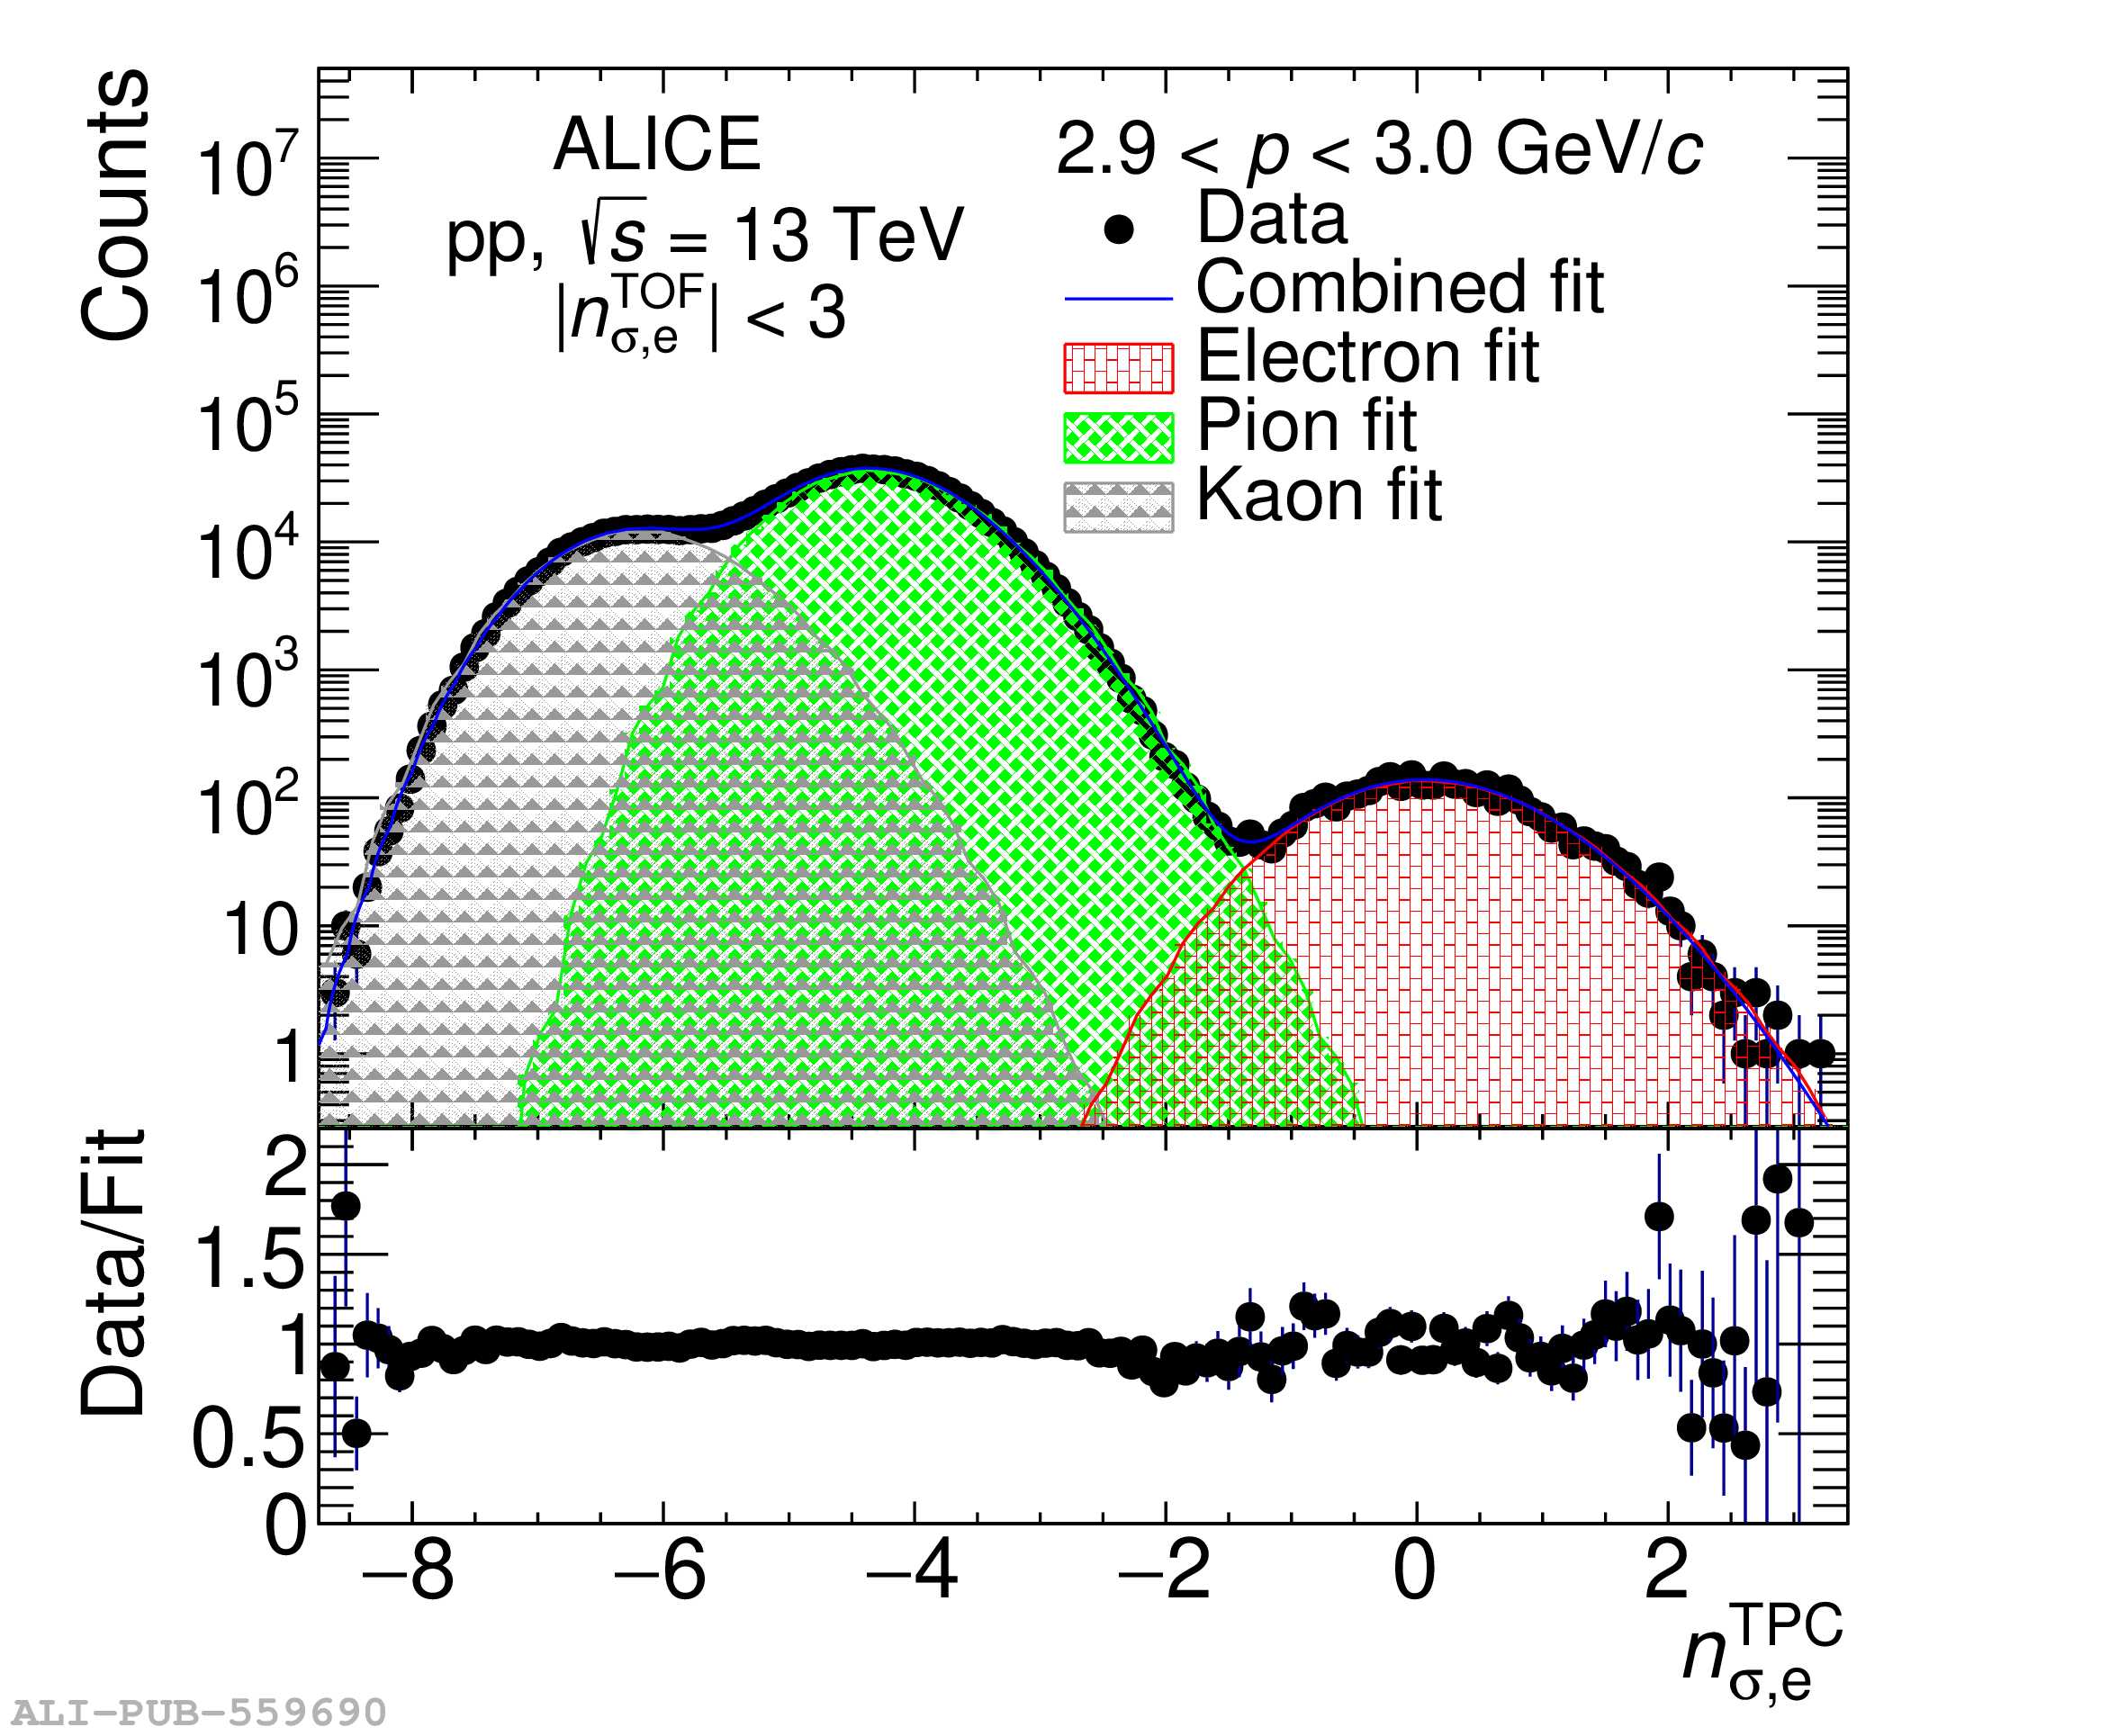 |
Figure 4
Total reconstruction efficiency of electrons from heavy-flavour hadron decays using the TPC and TOF or the TPC and EMCal detectors in pp collisions at $\sqrt{s}= 13$ TeV with nominal and low magnetic field (left panel) and in \pPb collisions at $\sqrtsNN=8.16$ TeV (right panel). | 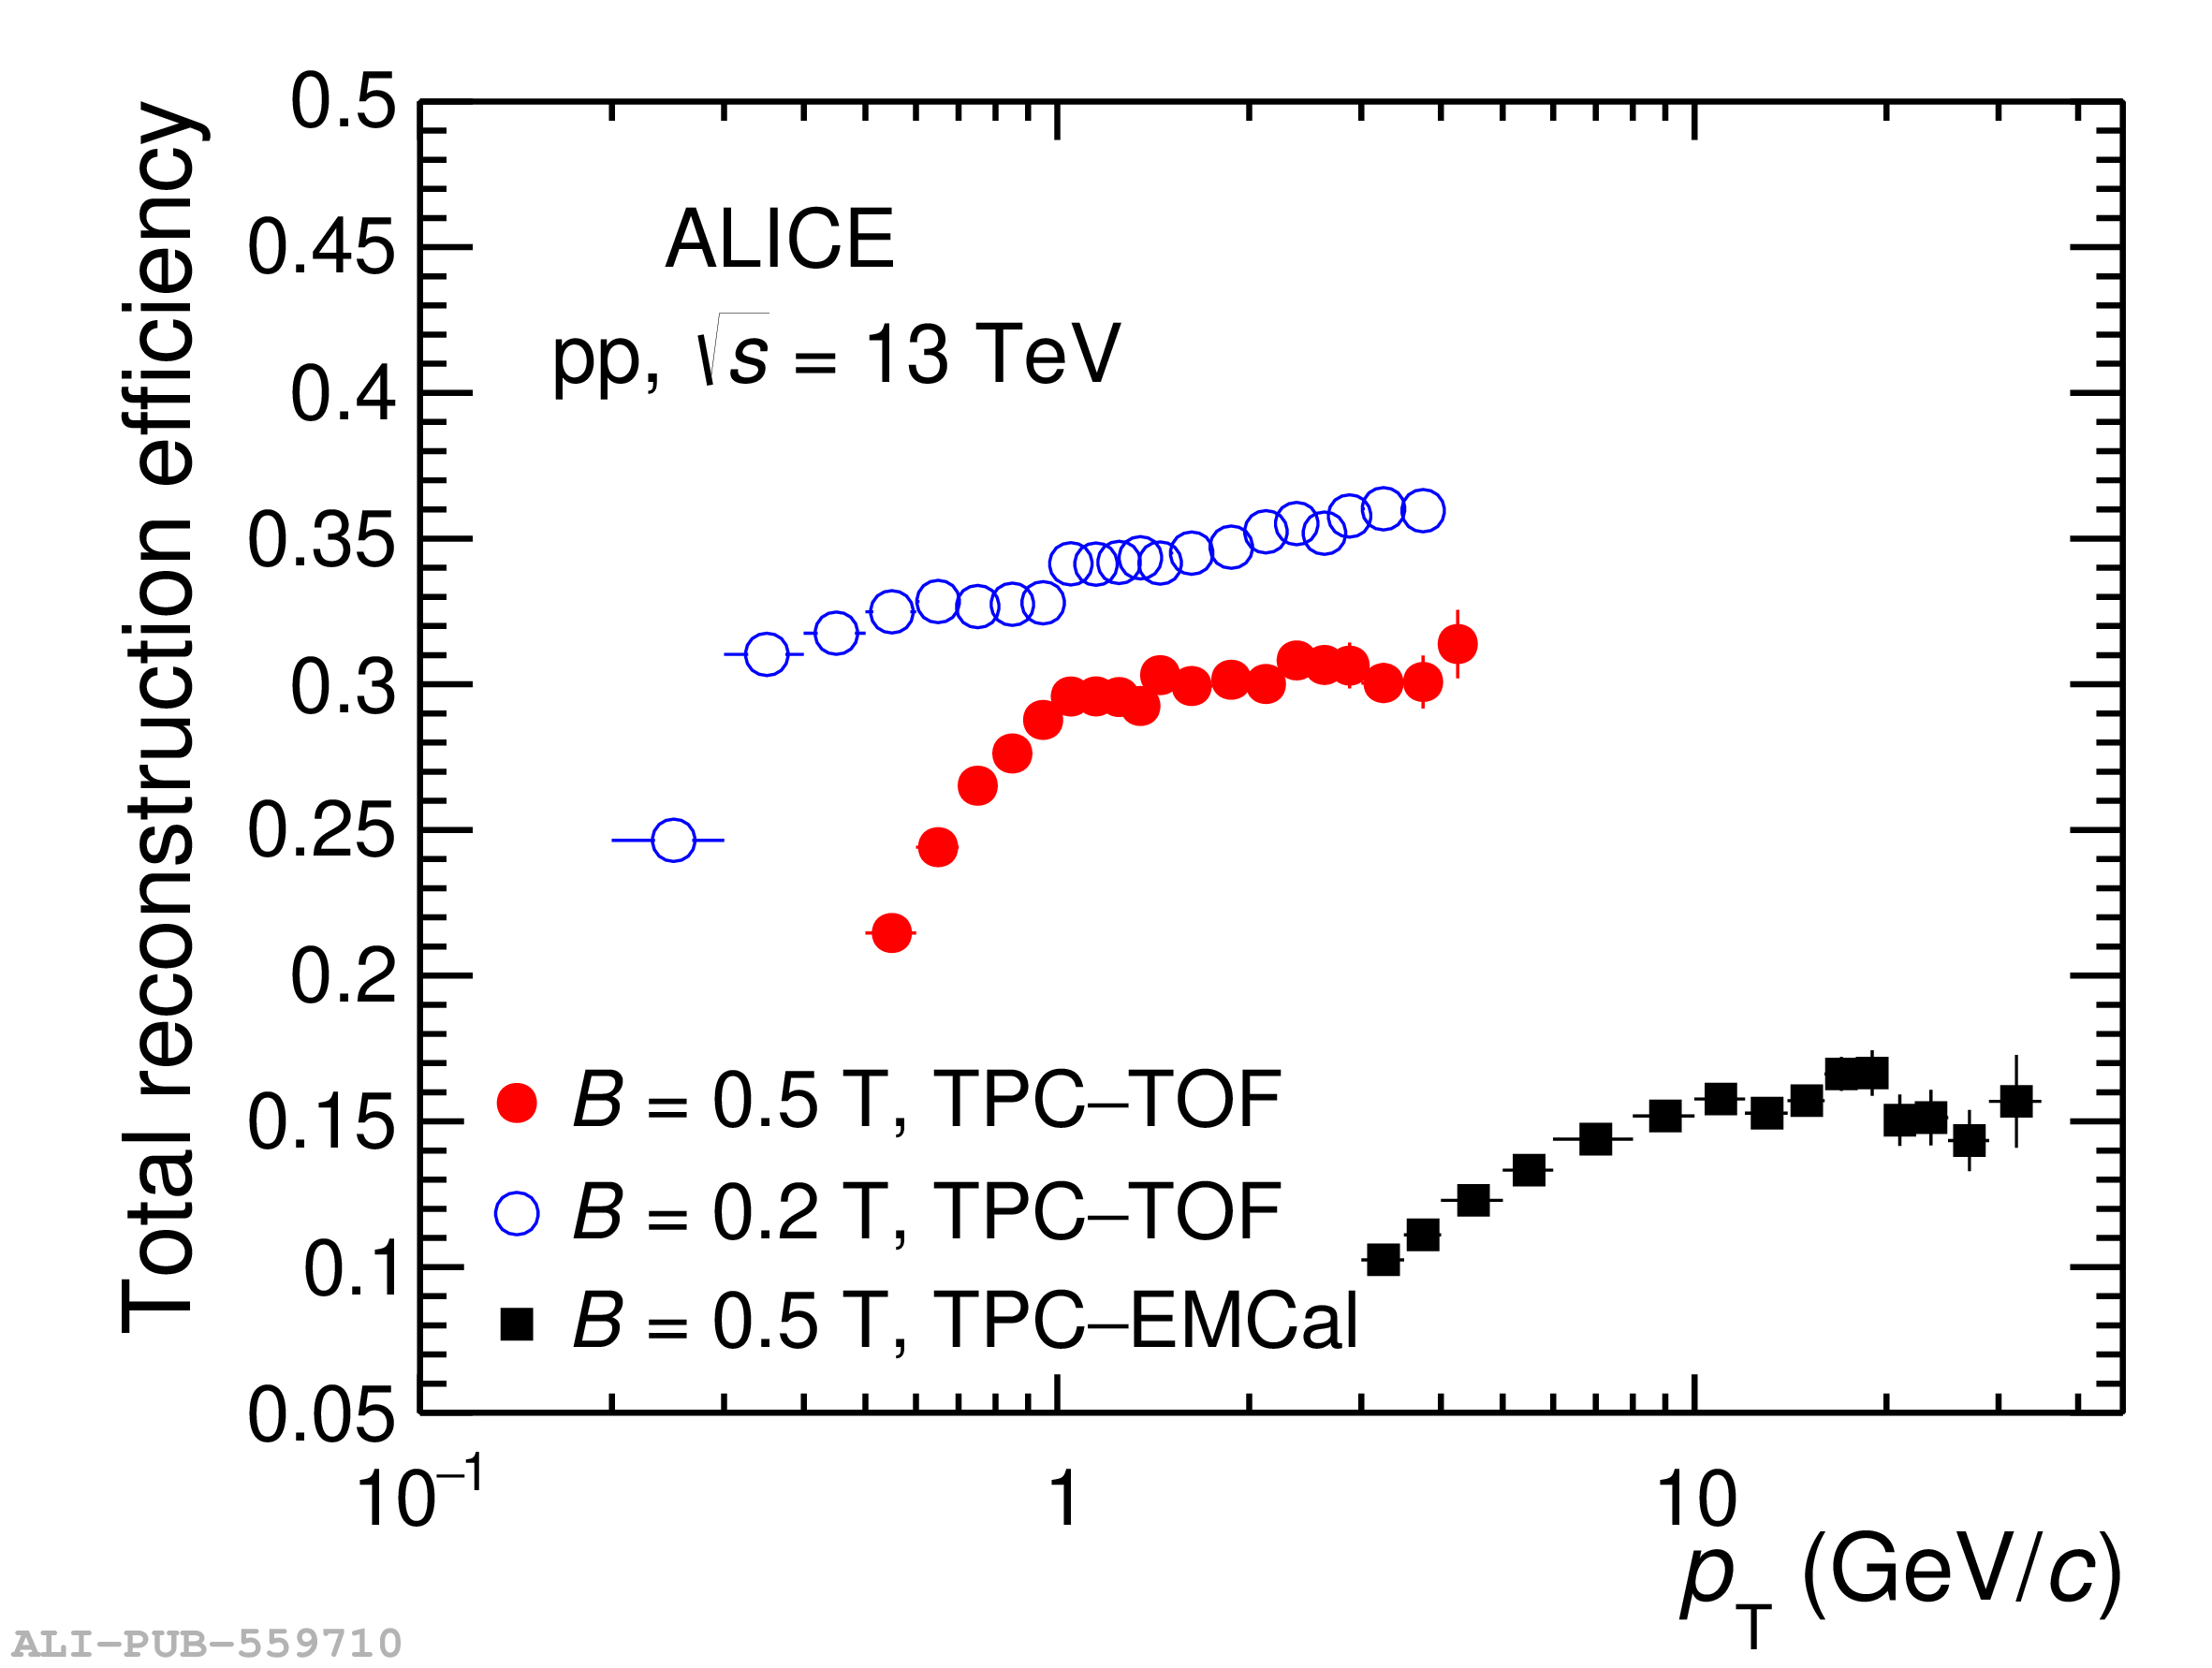 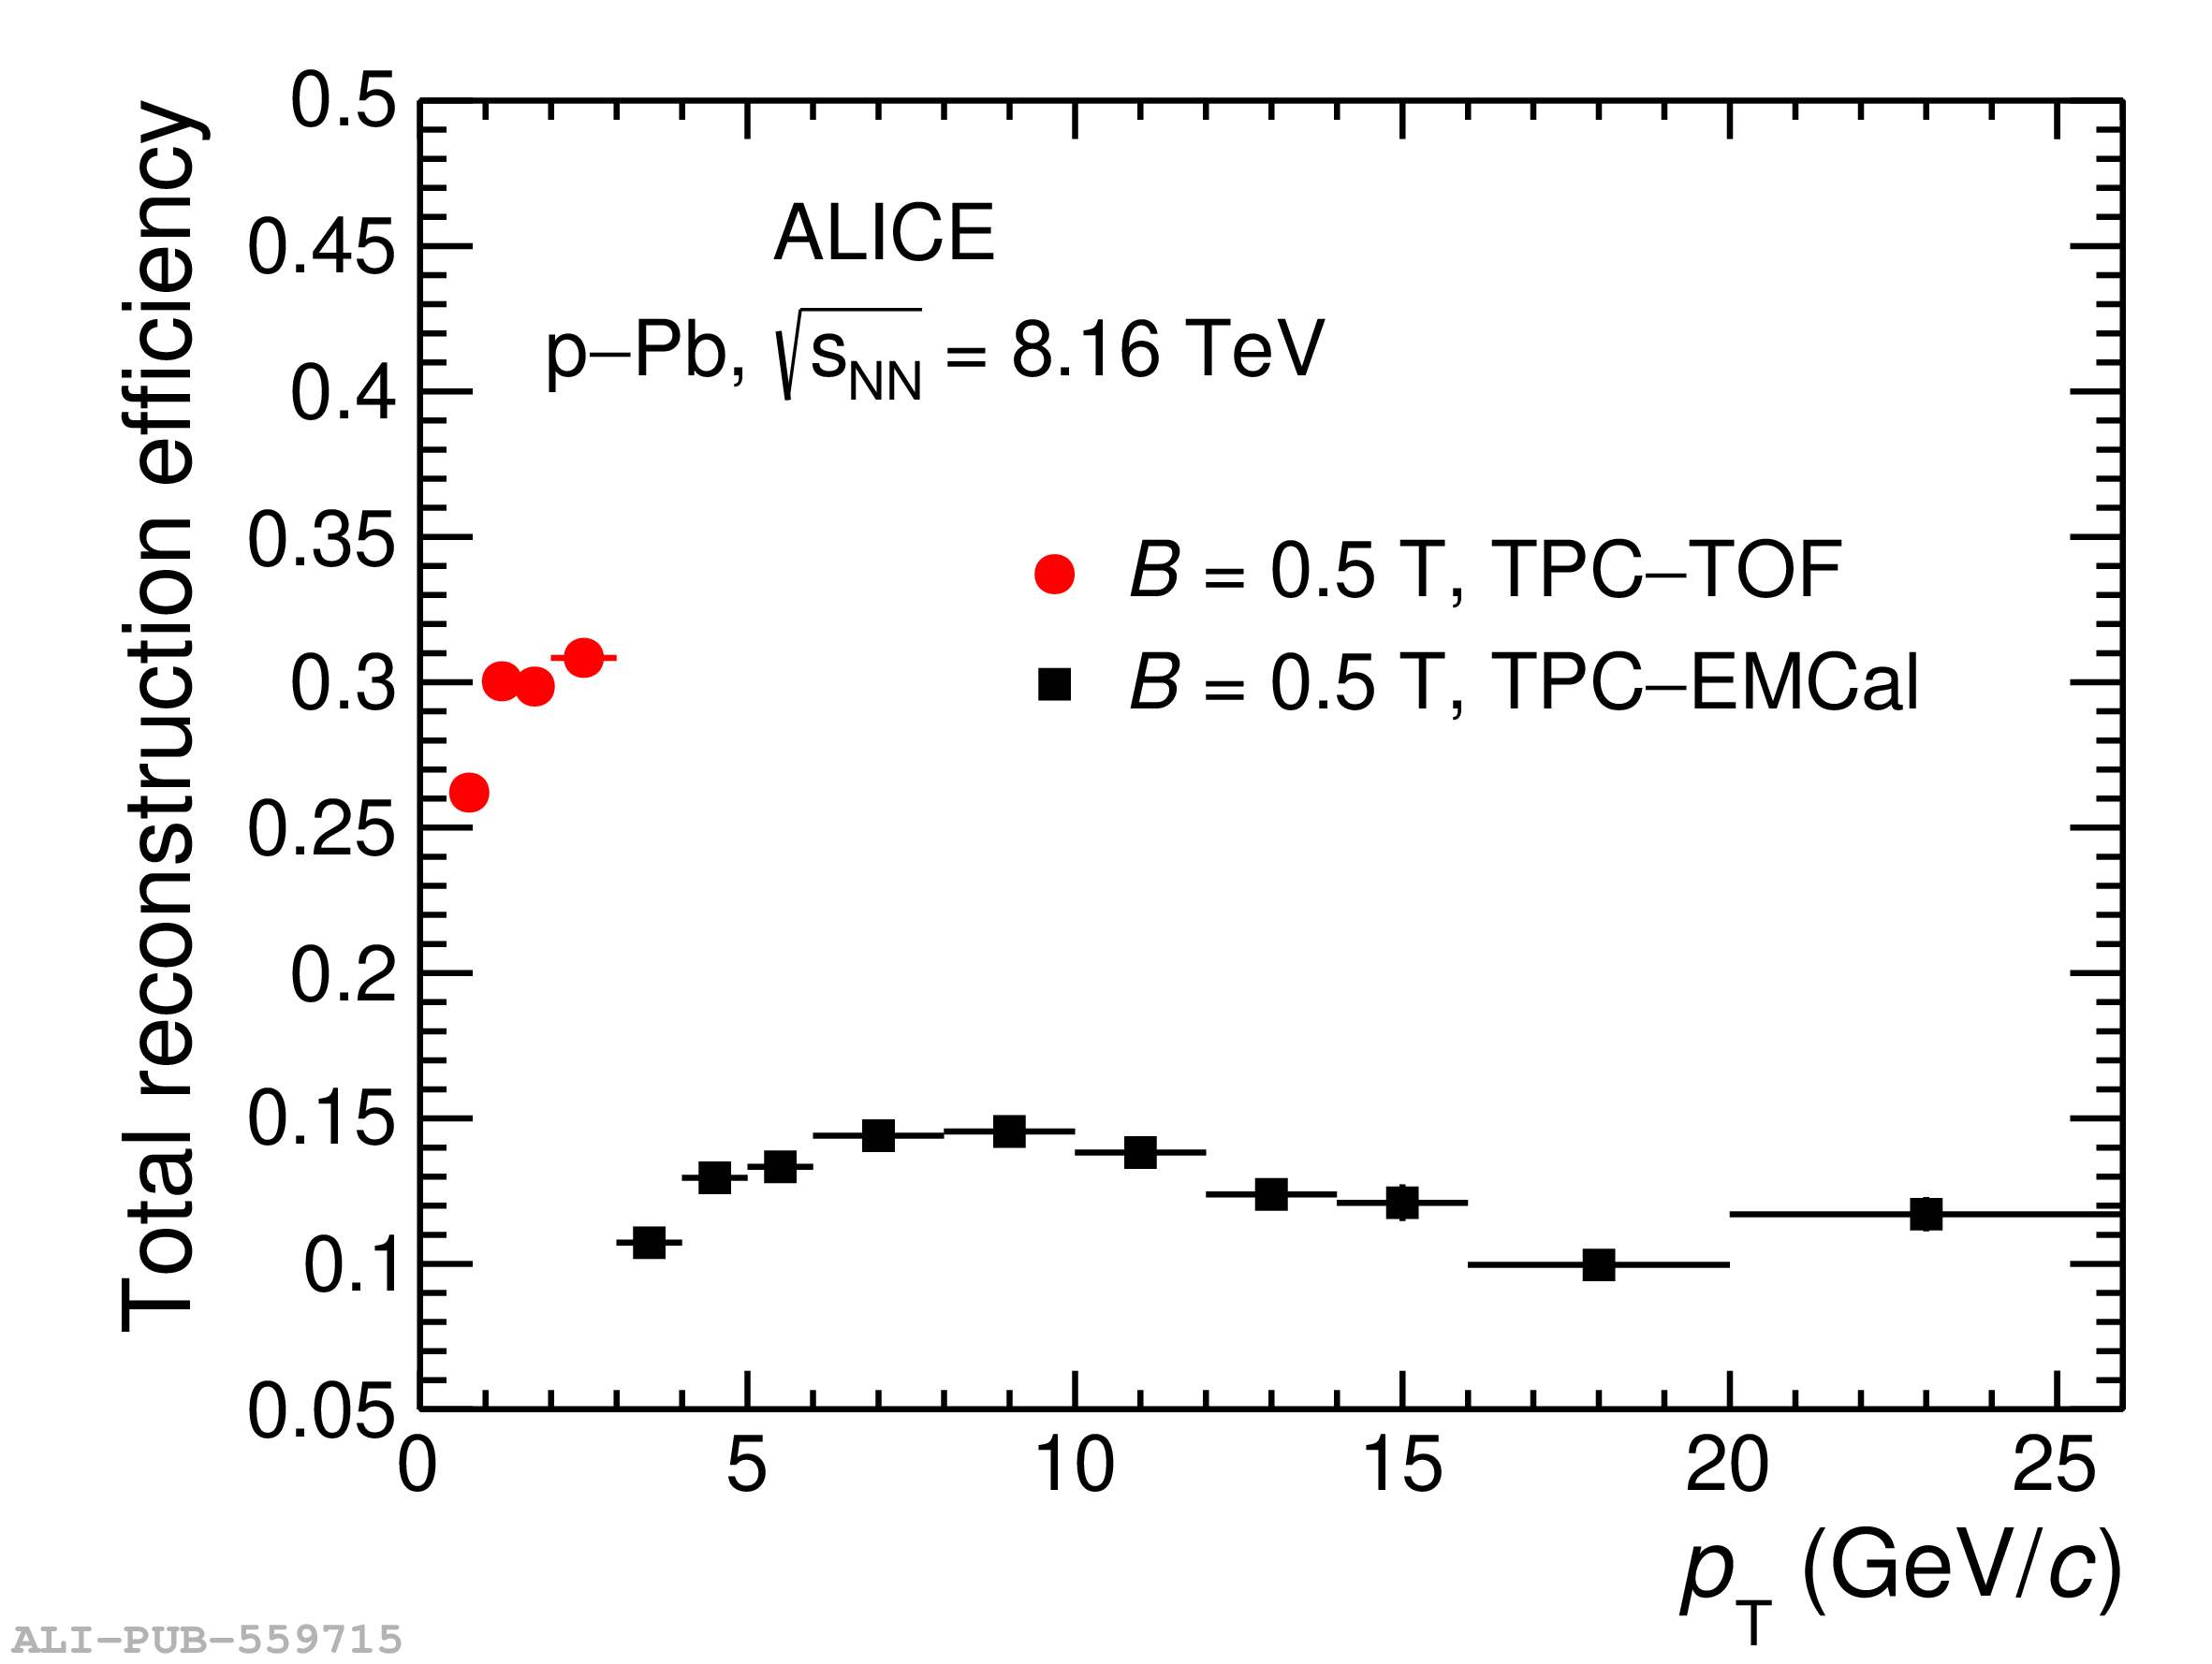 |
Figure 5
Left, top: $p_{\rm T}$-differential cross section of electrons from heavy-flavour hadron decays in pp collisions at $\sqrt{s} =$ 13 TeV measured at midrapidity with different detectors and data sets. Left, bottom: Ratios of the different measurements in the overlapping \pt intervals. Right: $p_{\rm{T}}$-differential cross section compared with Fixed Order with Next-to-Leading-Log resummation (FONLL) and General-mass-variable-flavour-number-Scheme (GM-VFNS) predictions and its ratios with respect to FONLL and GM-VFNS central values in the two lower panels. Vertical bars and boxes denote statistical and systematical uncertainties, respectively. | 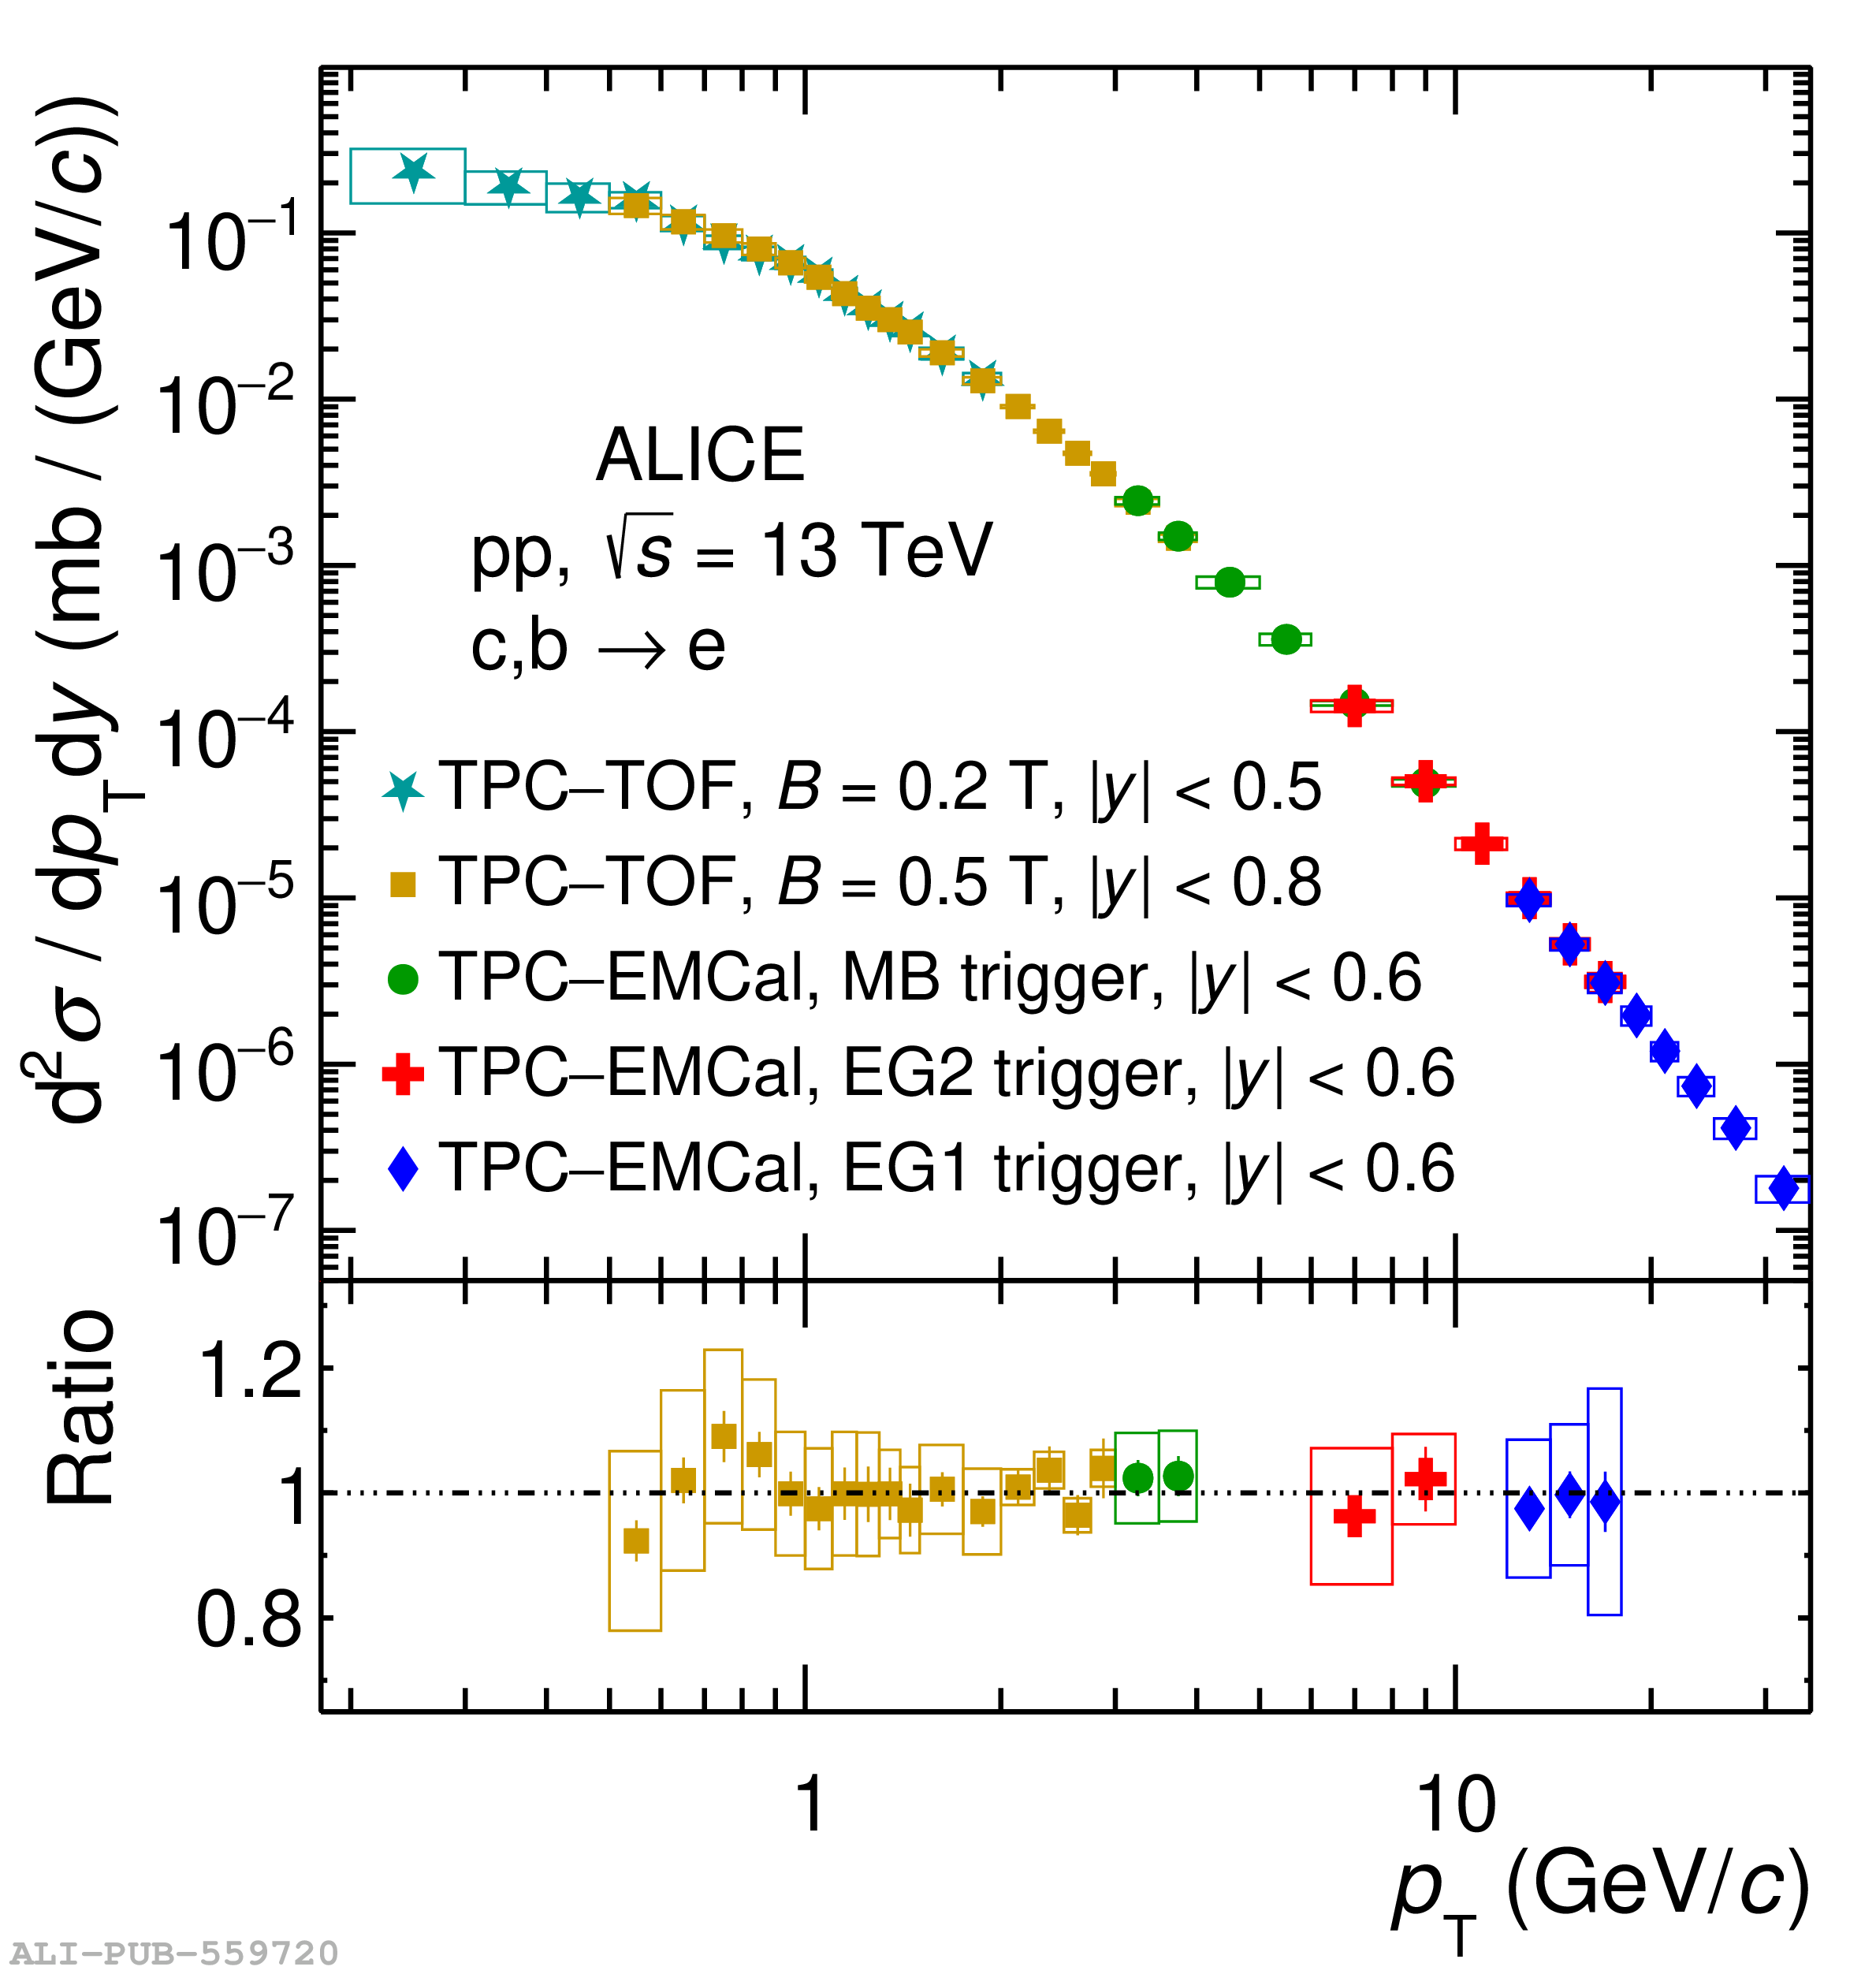 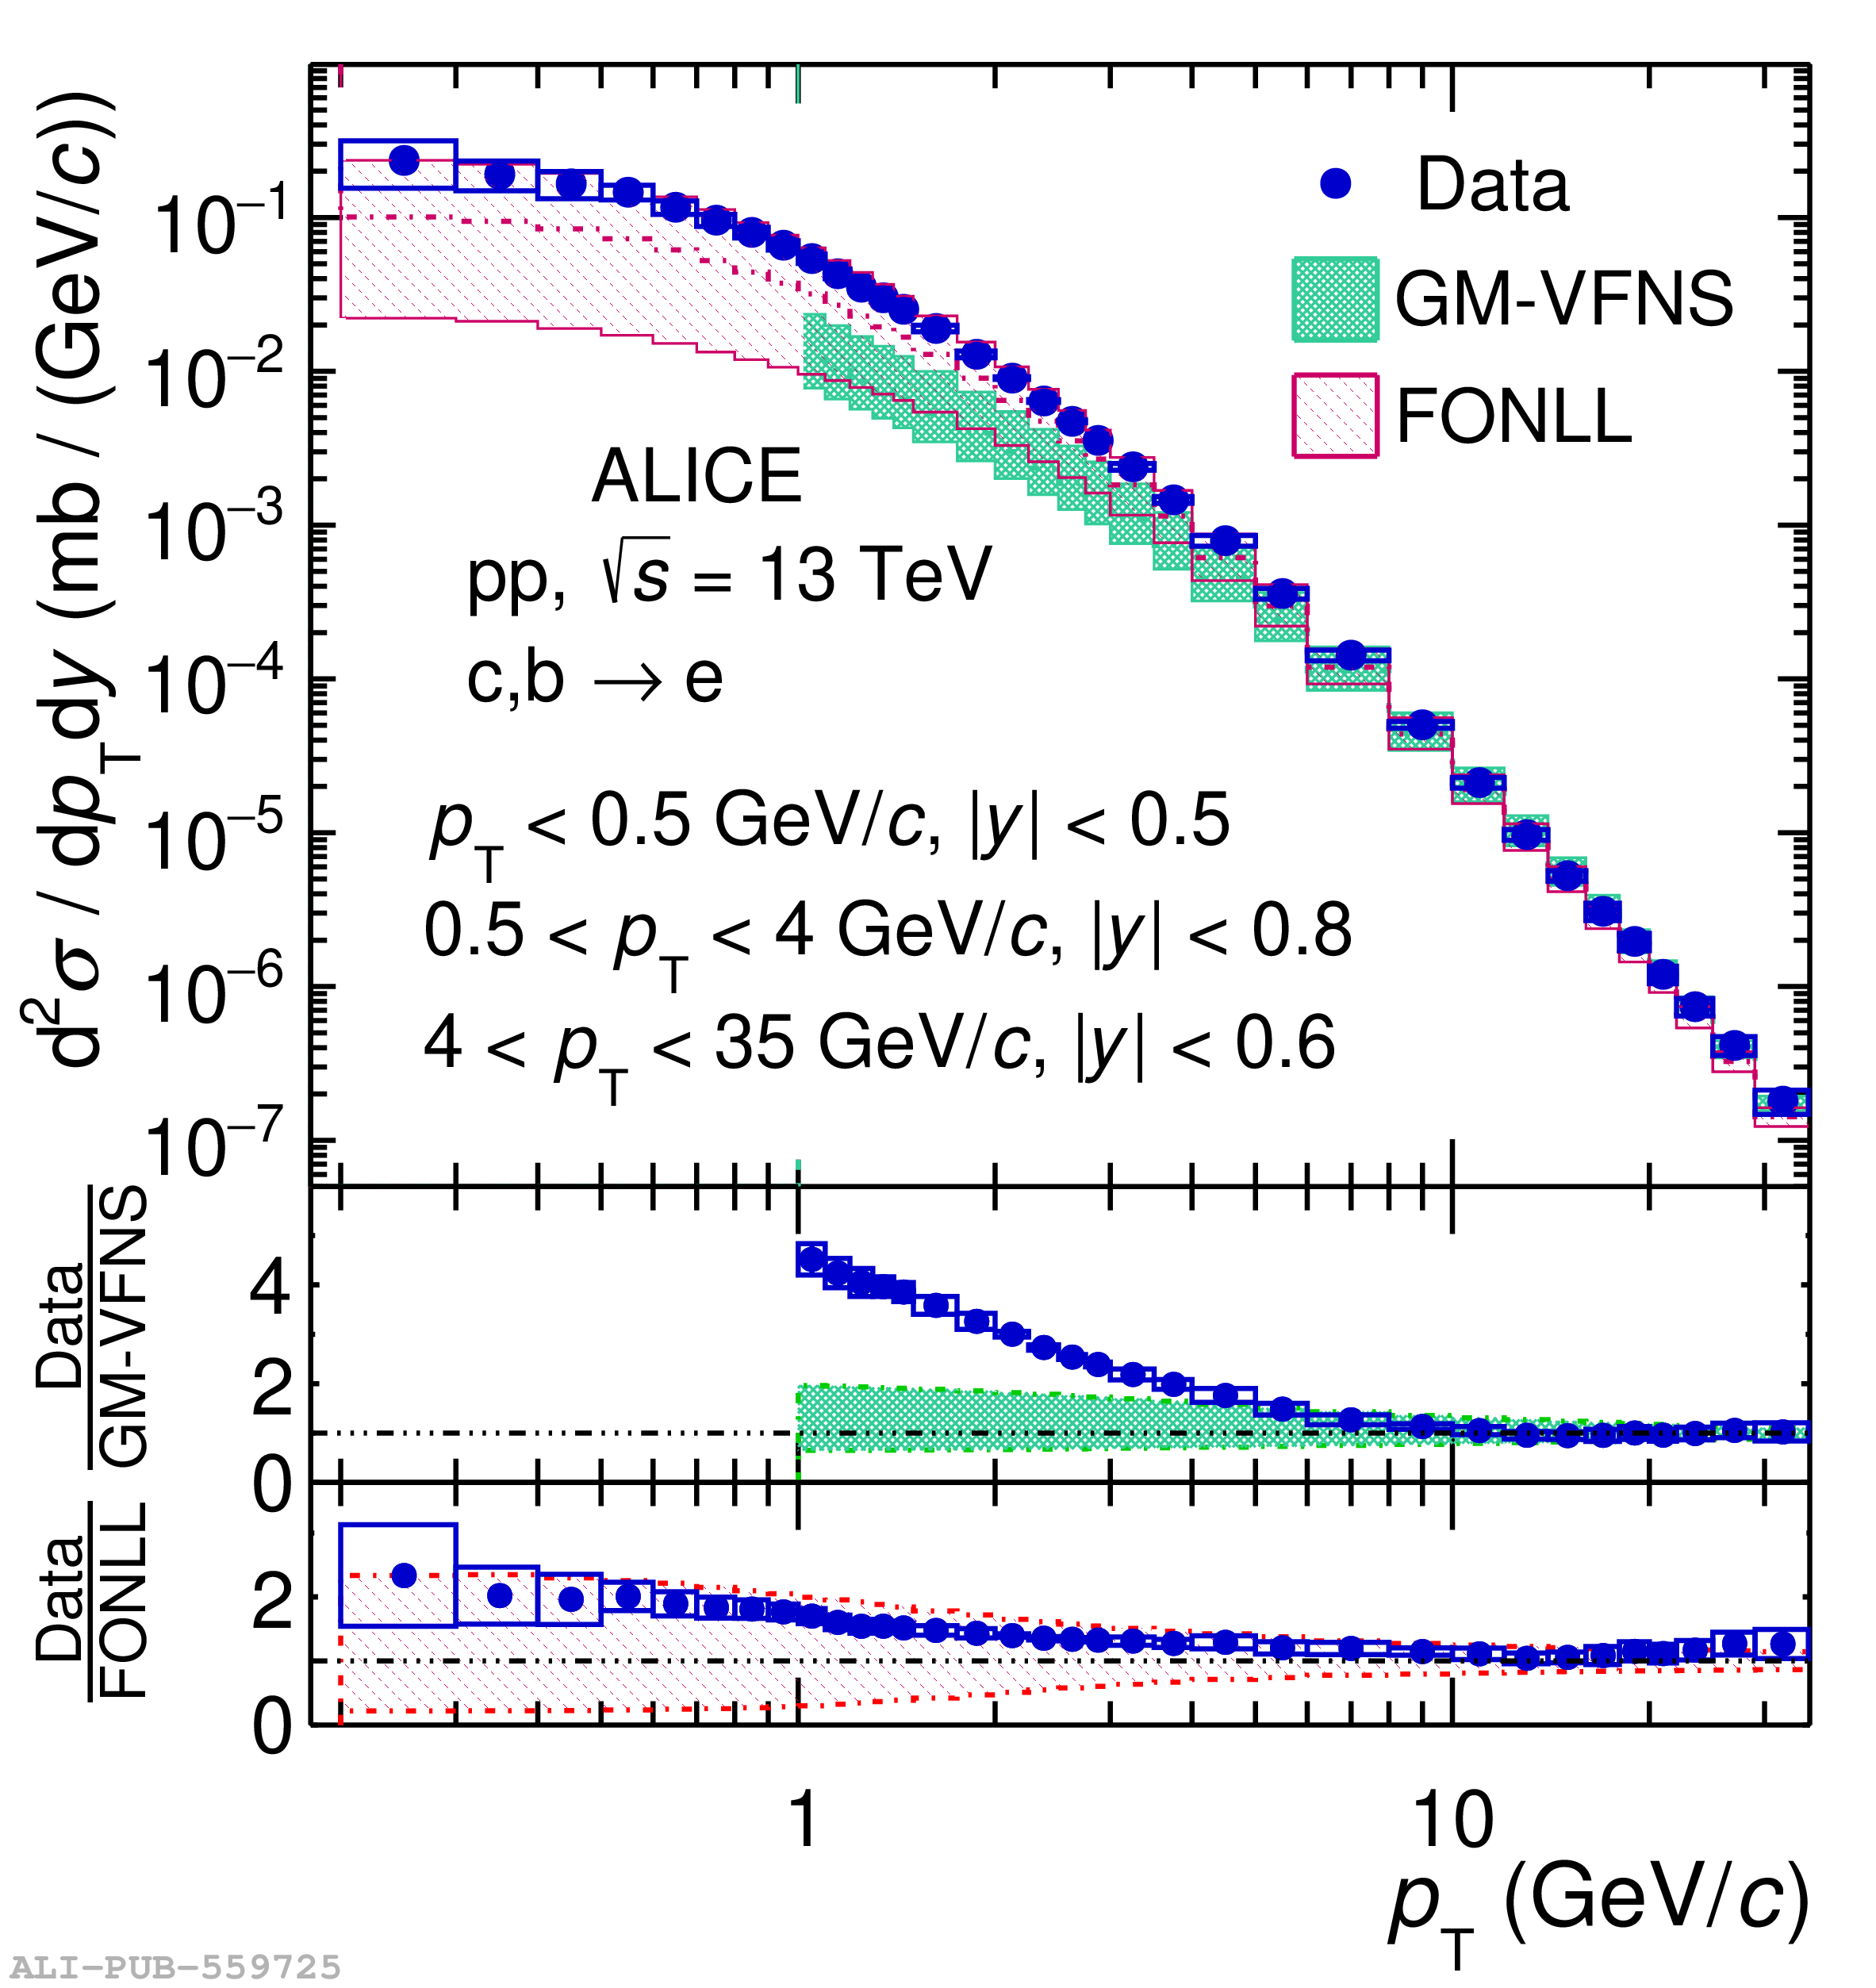 |
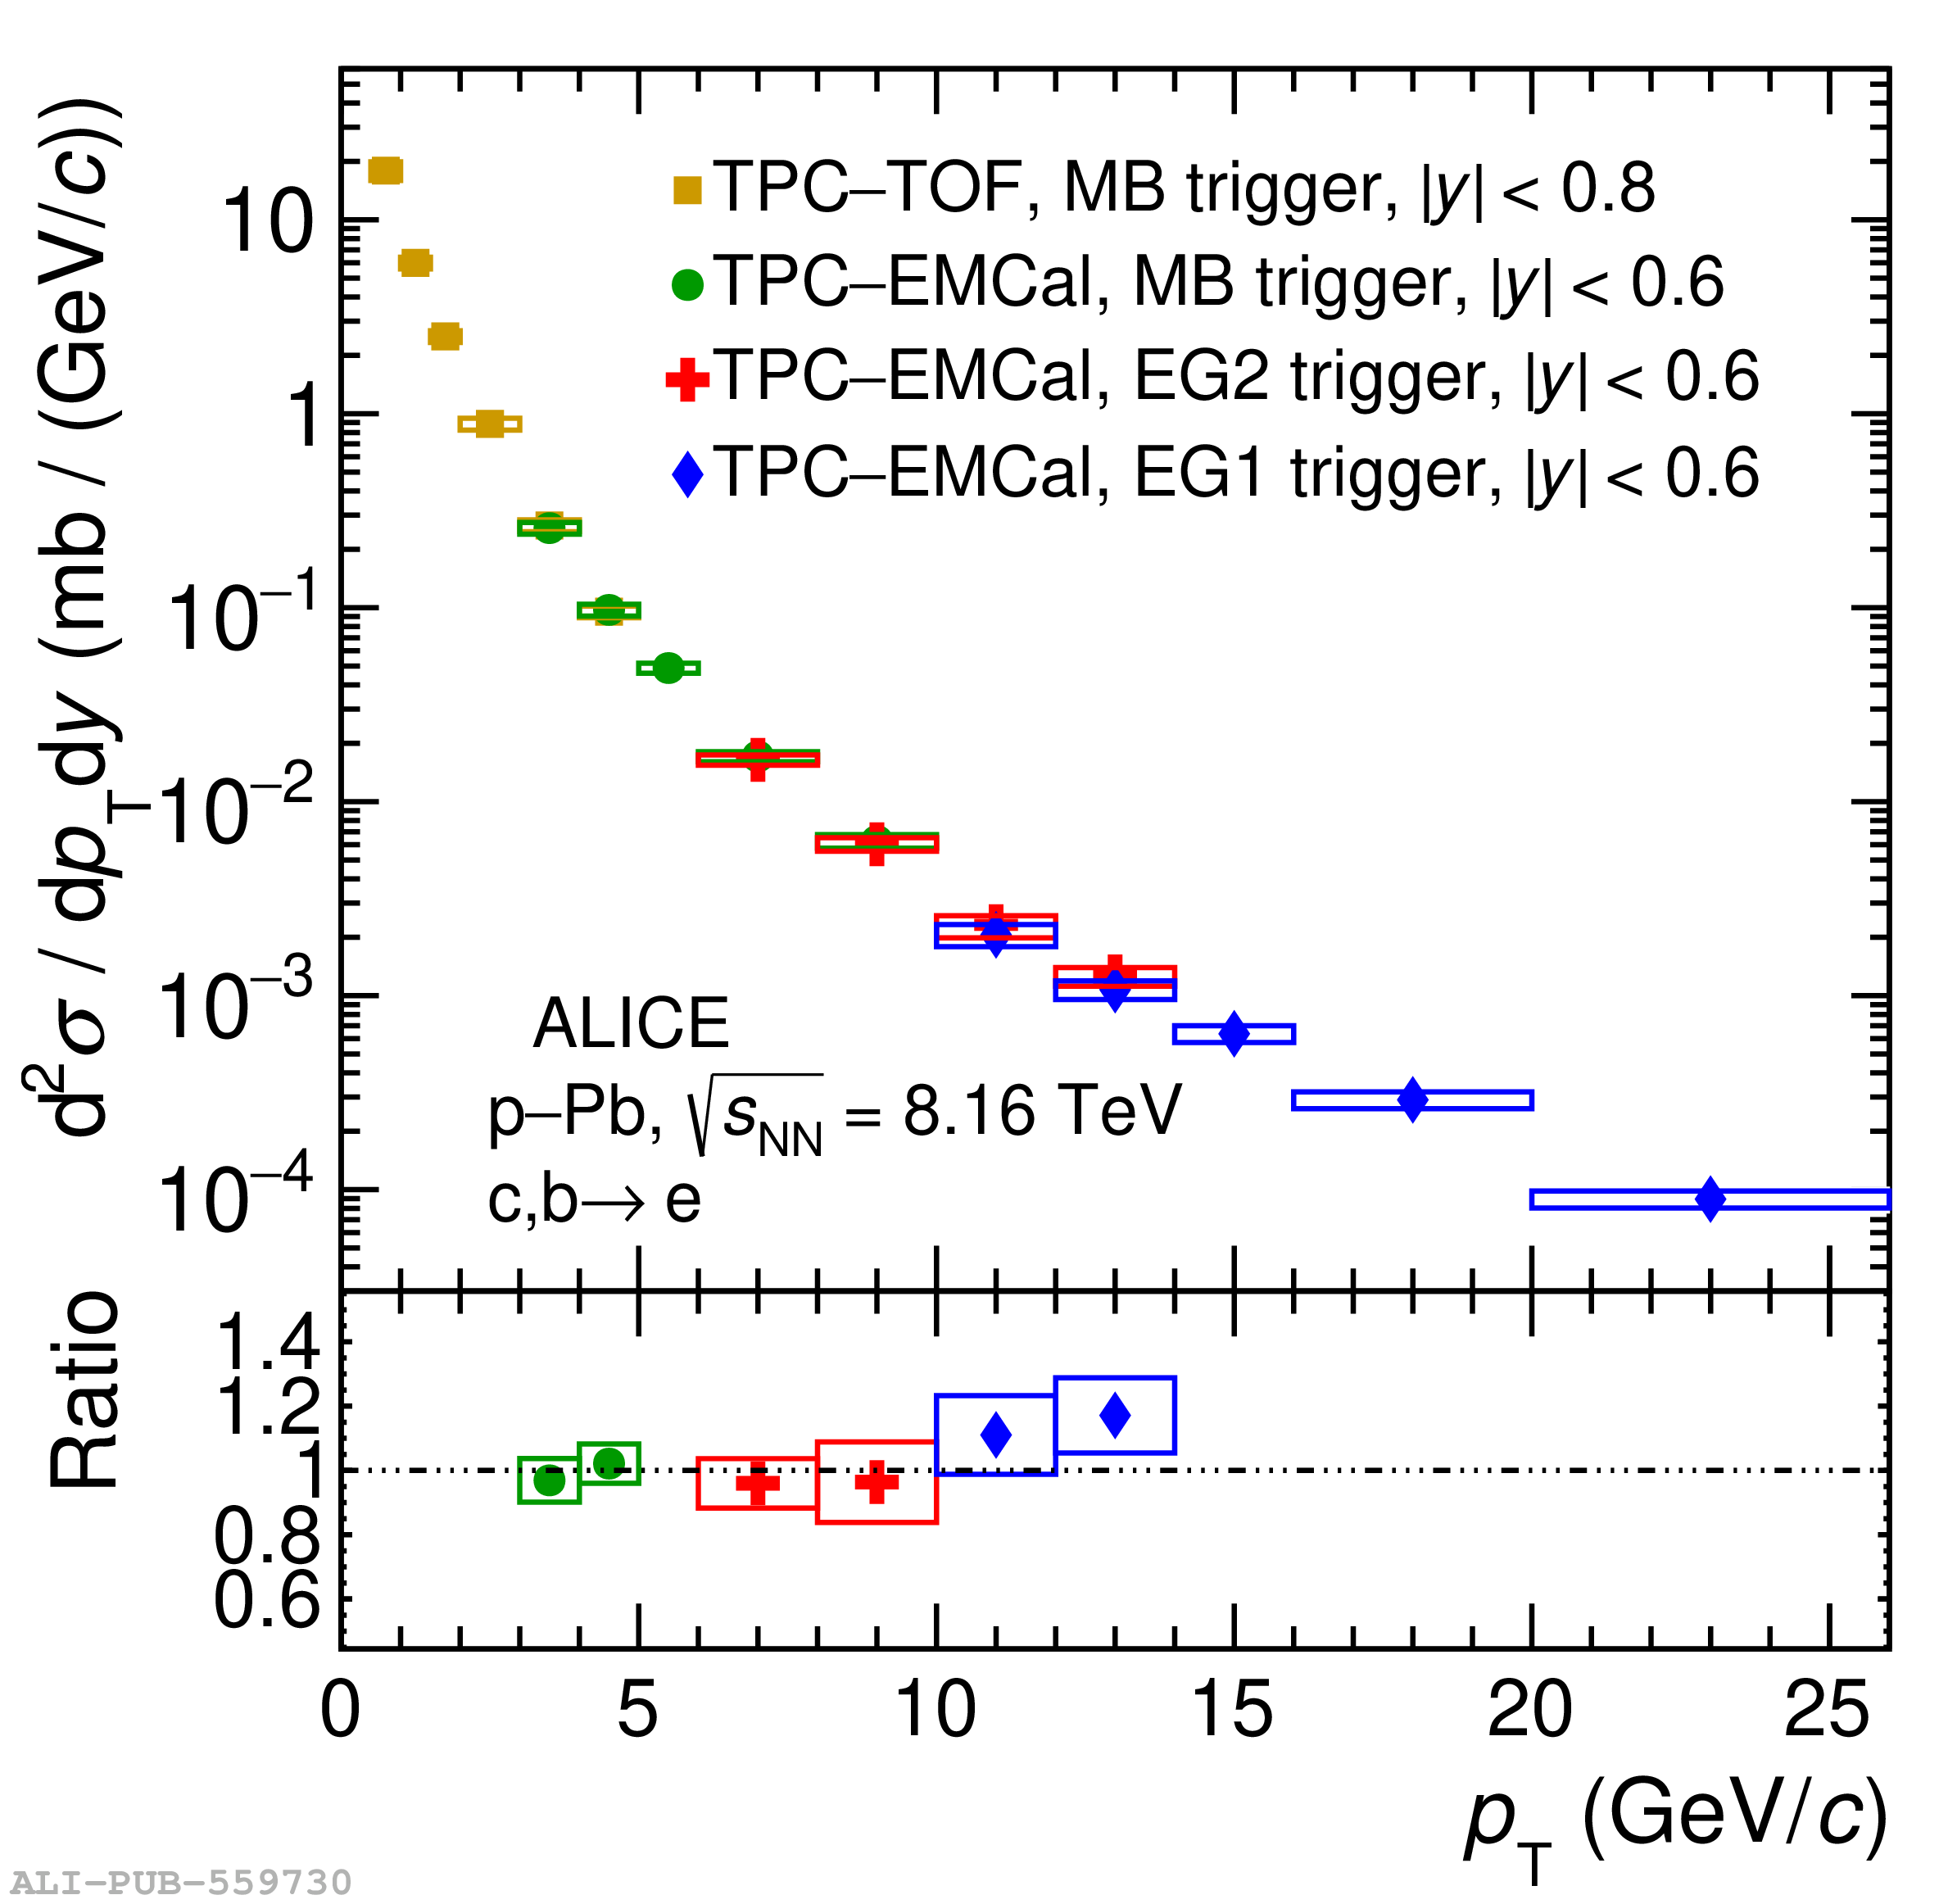
Figure 7
$p_{\rm{T}}$-differential cross section of electrons from heavy-flavour hadron decays measured in \pPb collisions at \sqrtsNN $= 8.16 \rm TeV$ compared with the pp reference at the same centre-of-mass energy obtained from the measurement in pp collisions at \sqrts $= 13 \rm TeV$ scaled to \sqrts $= 8.16 \rm TeV$. | 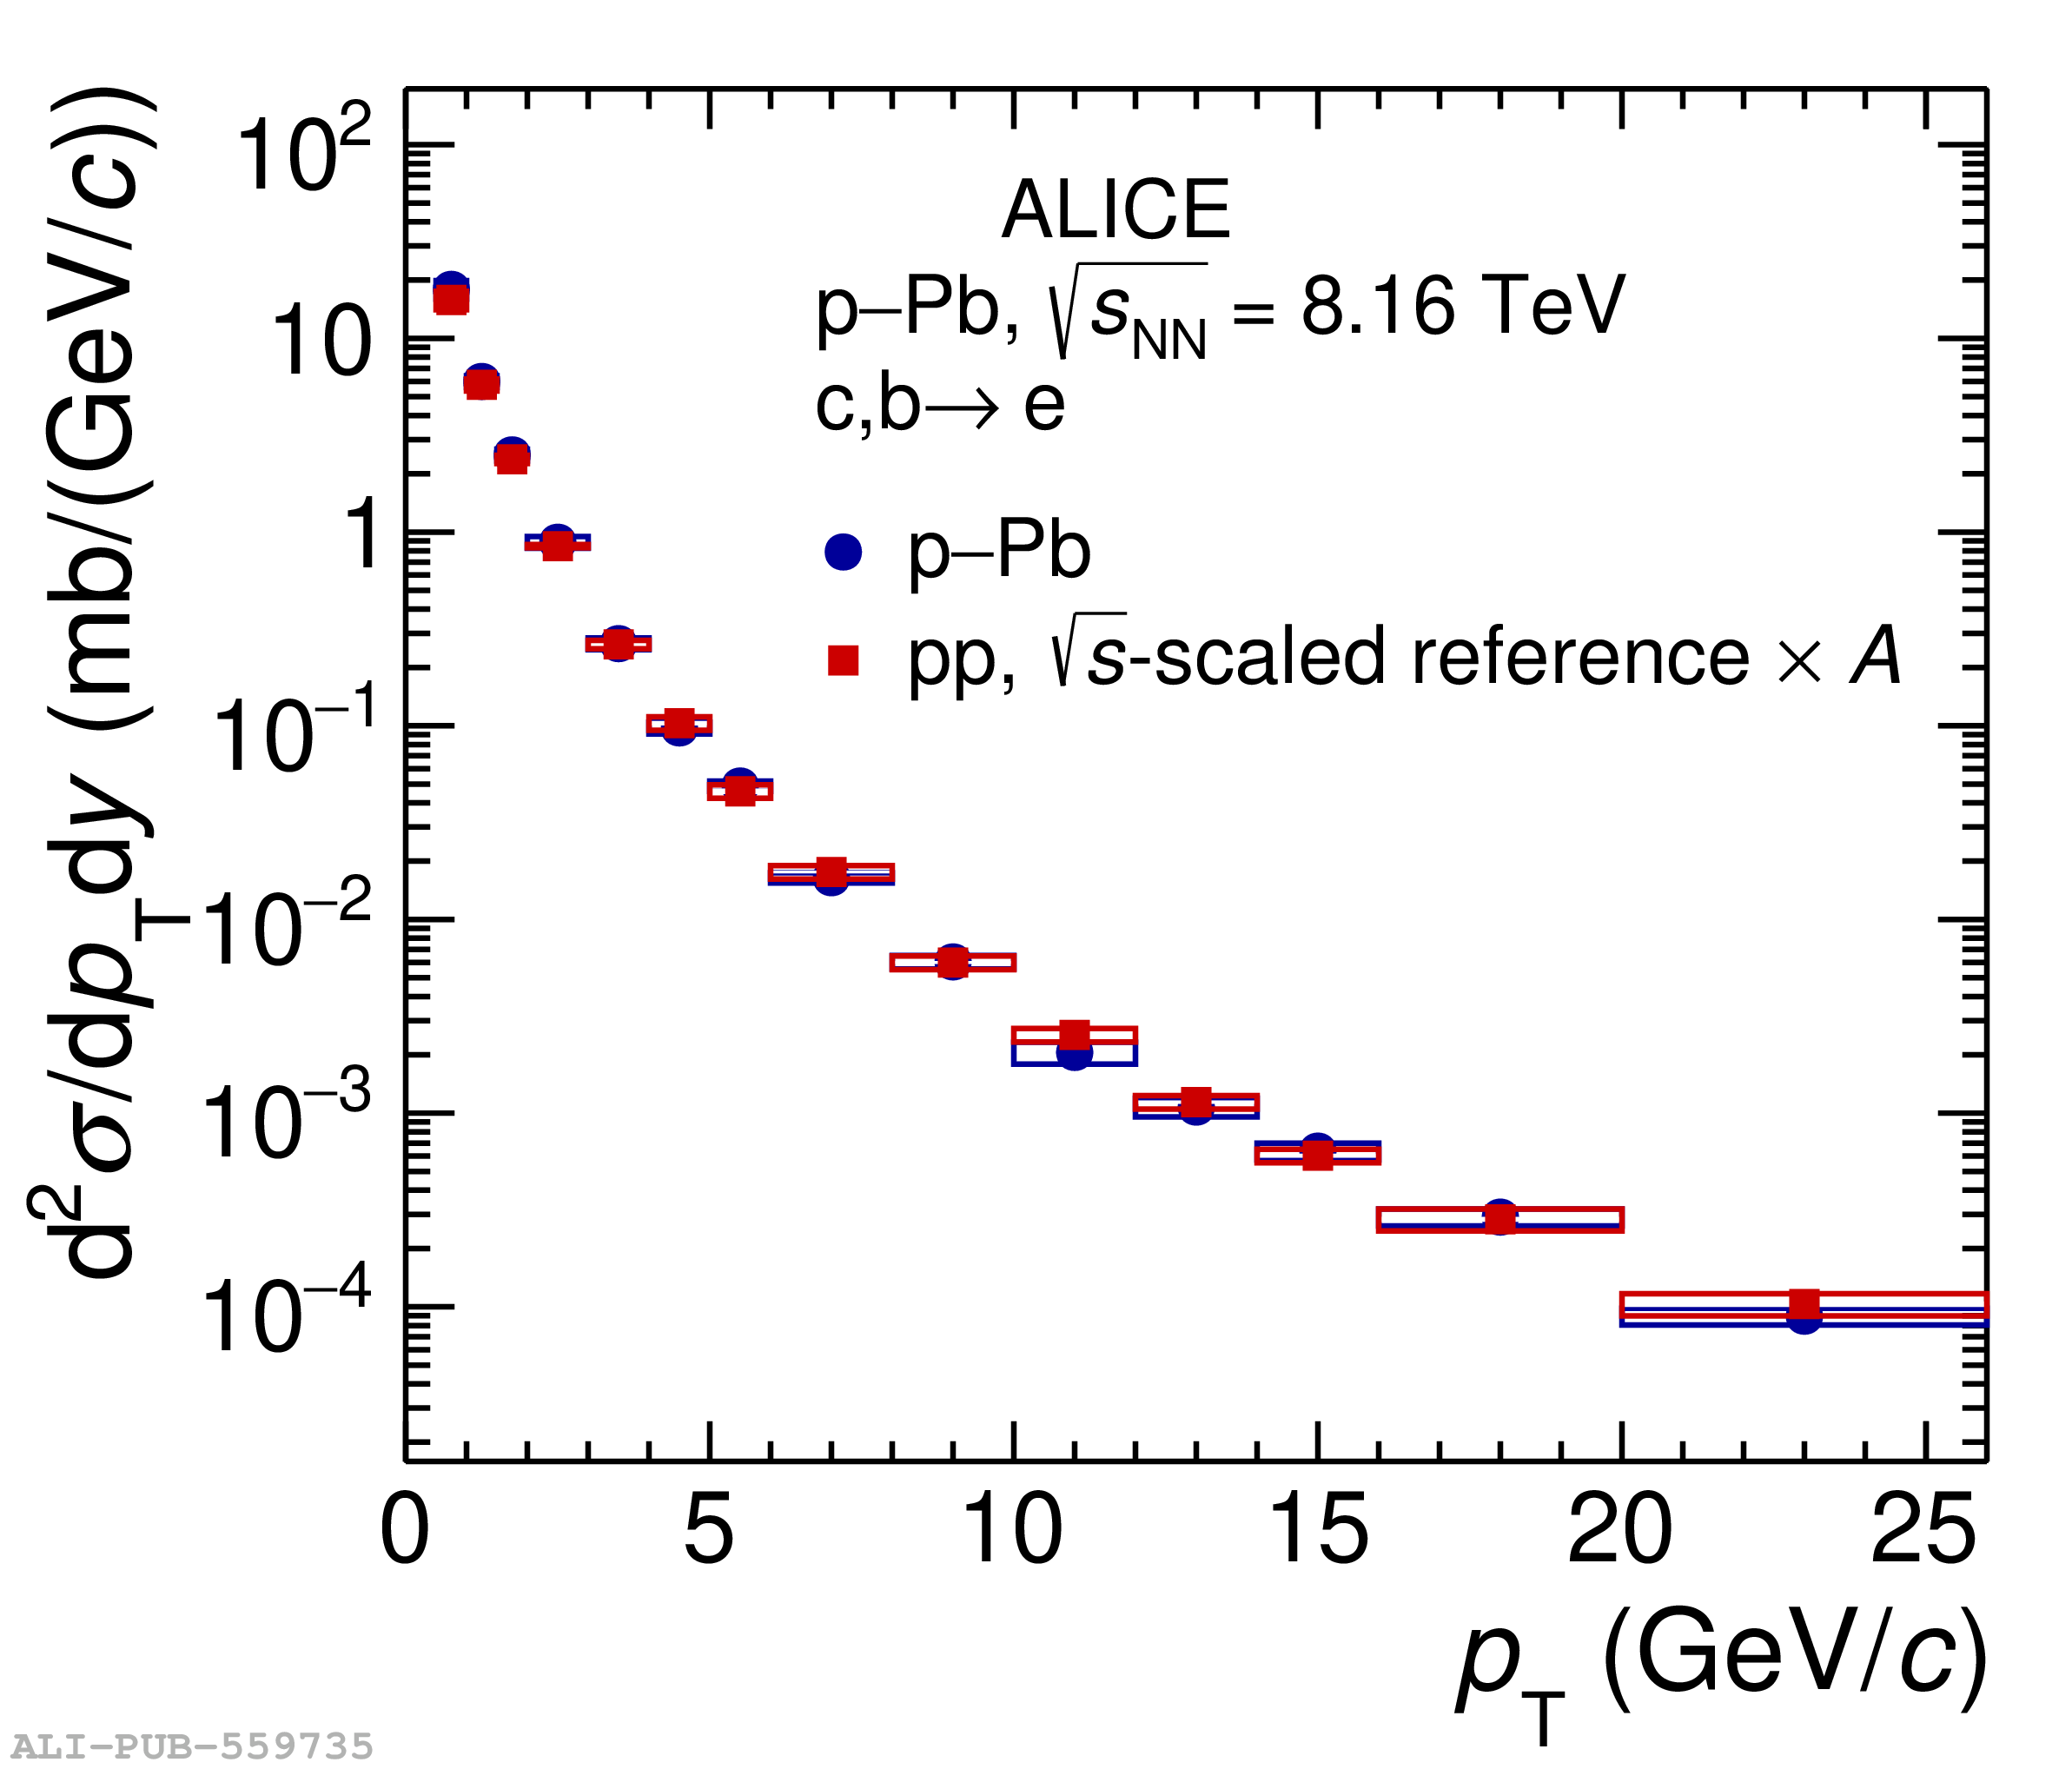 |
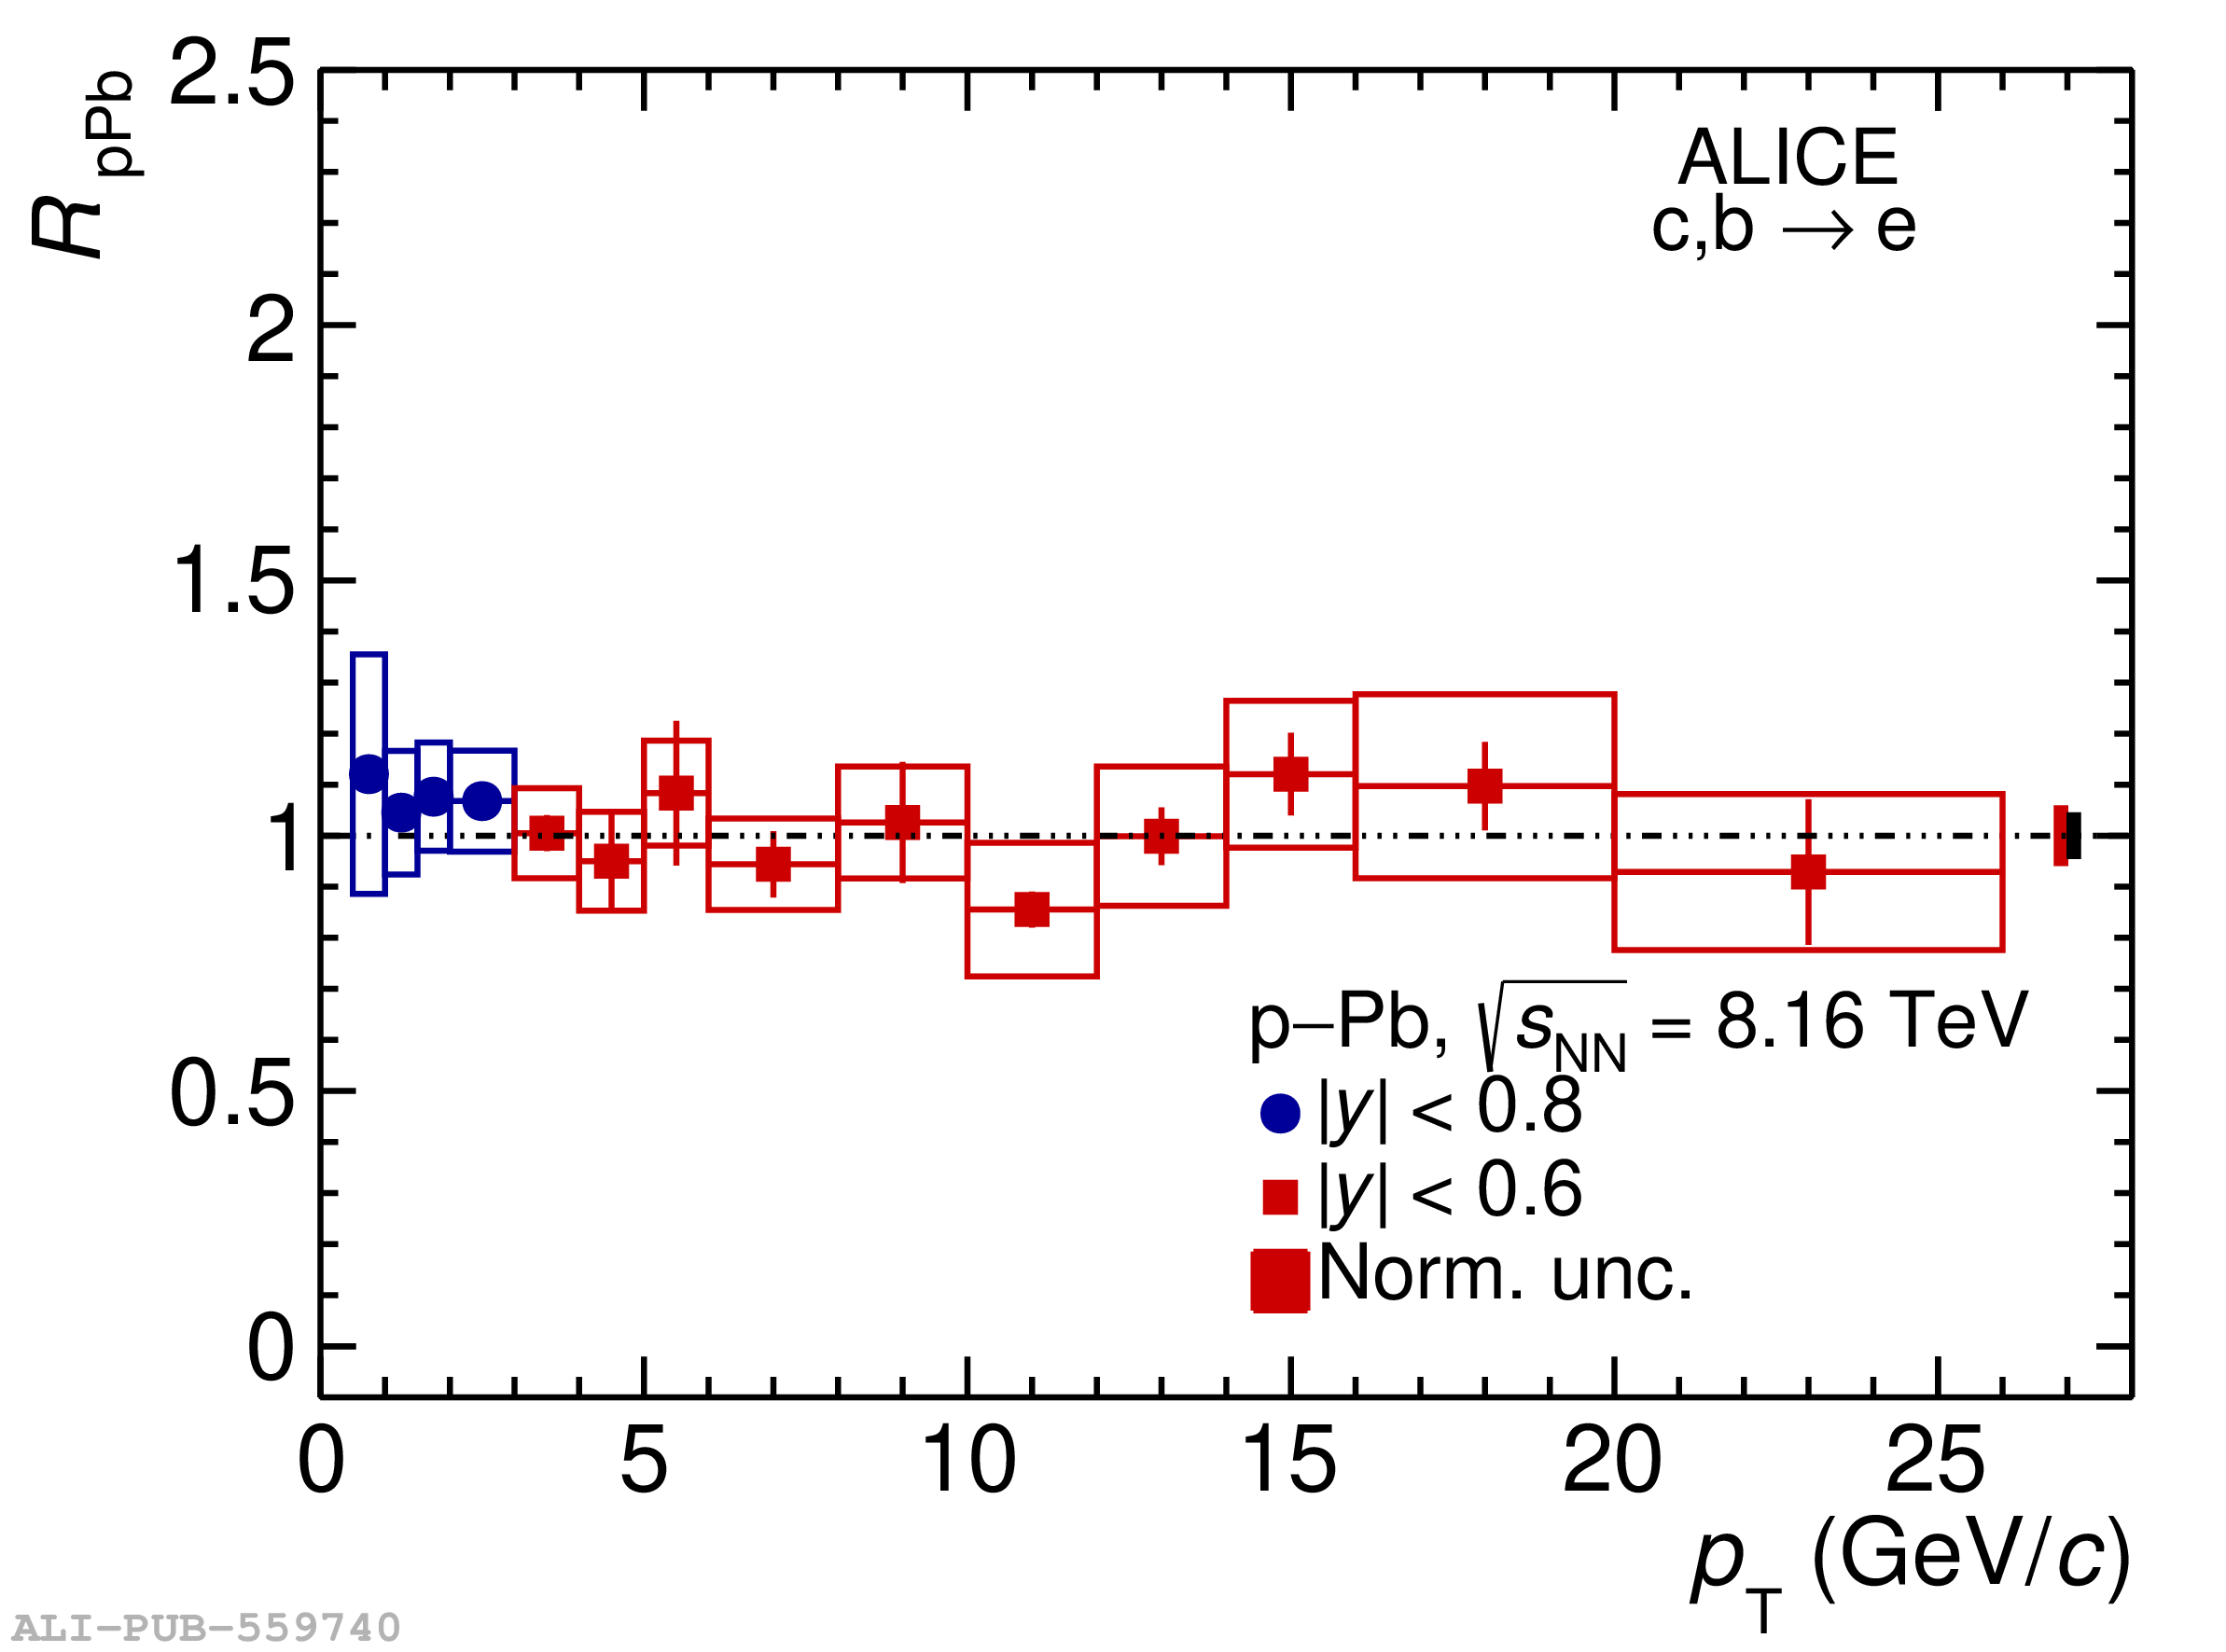
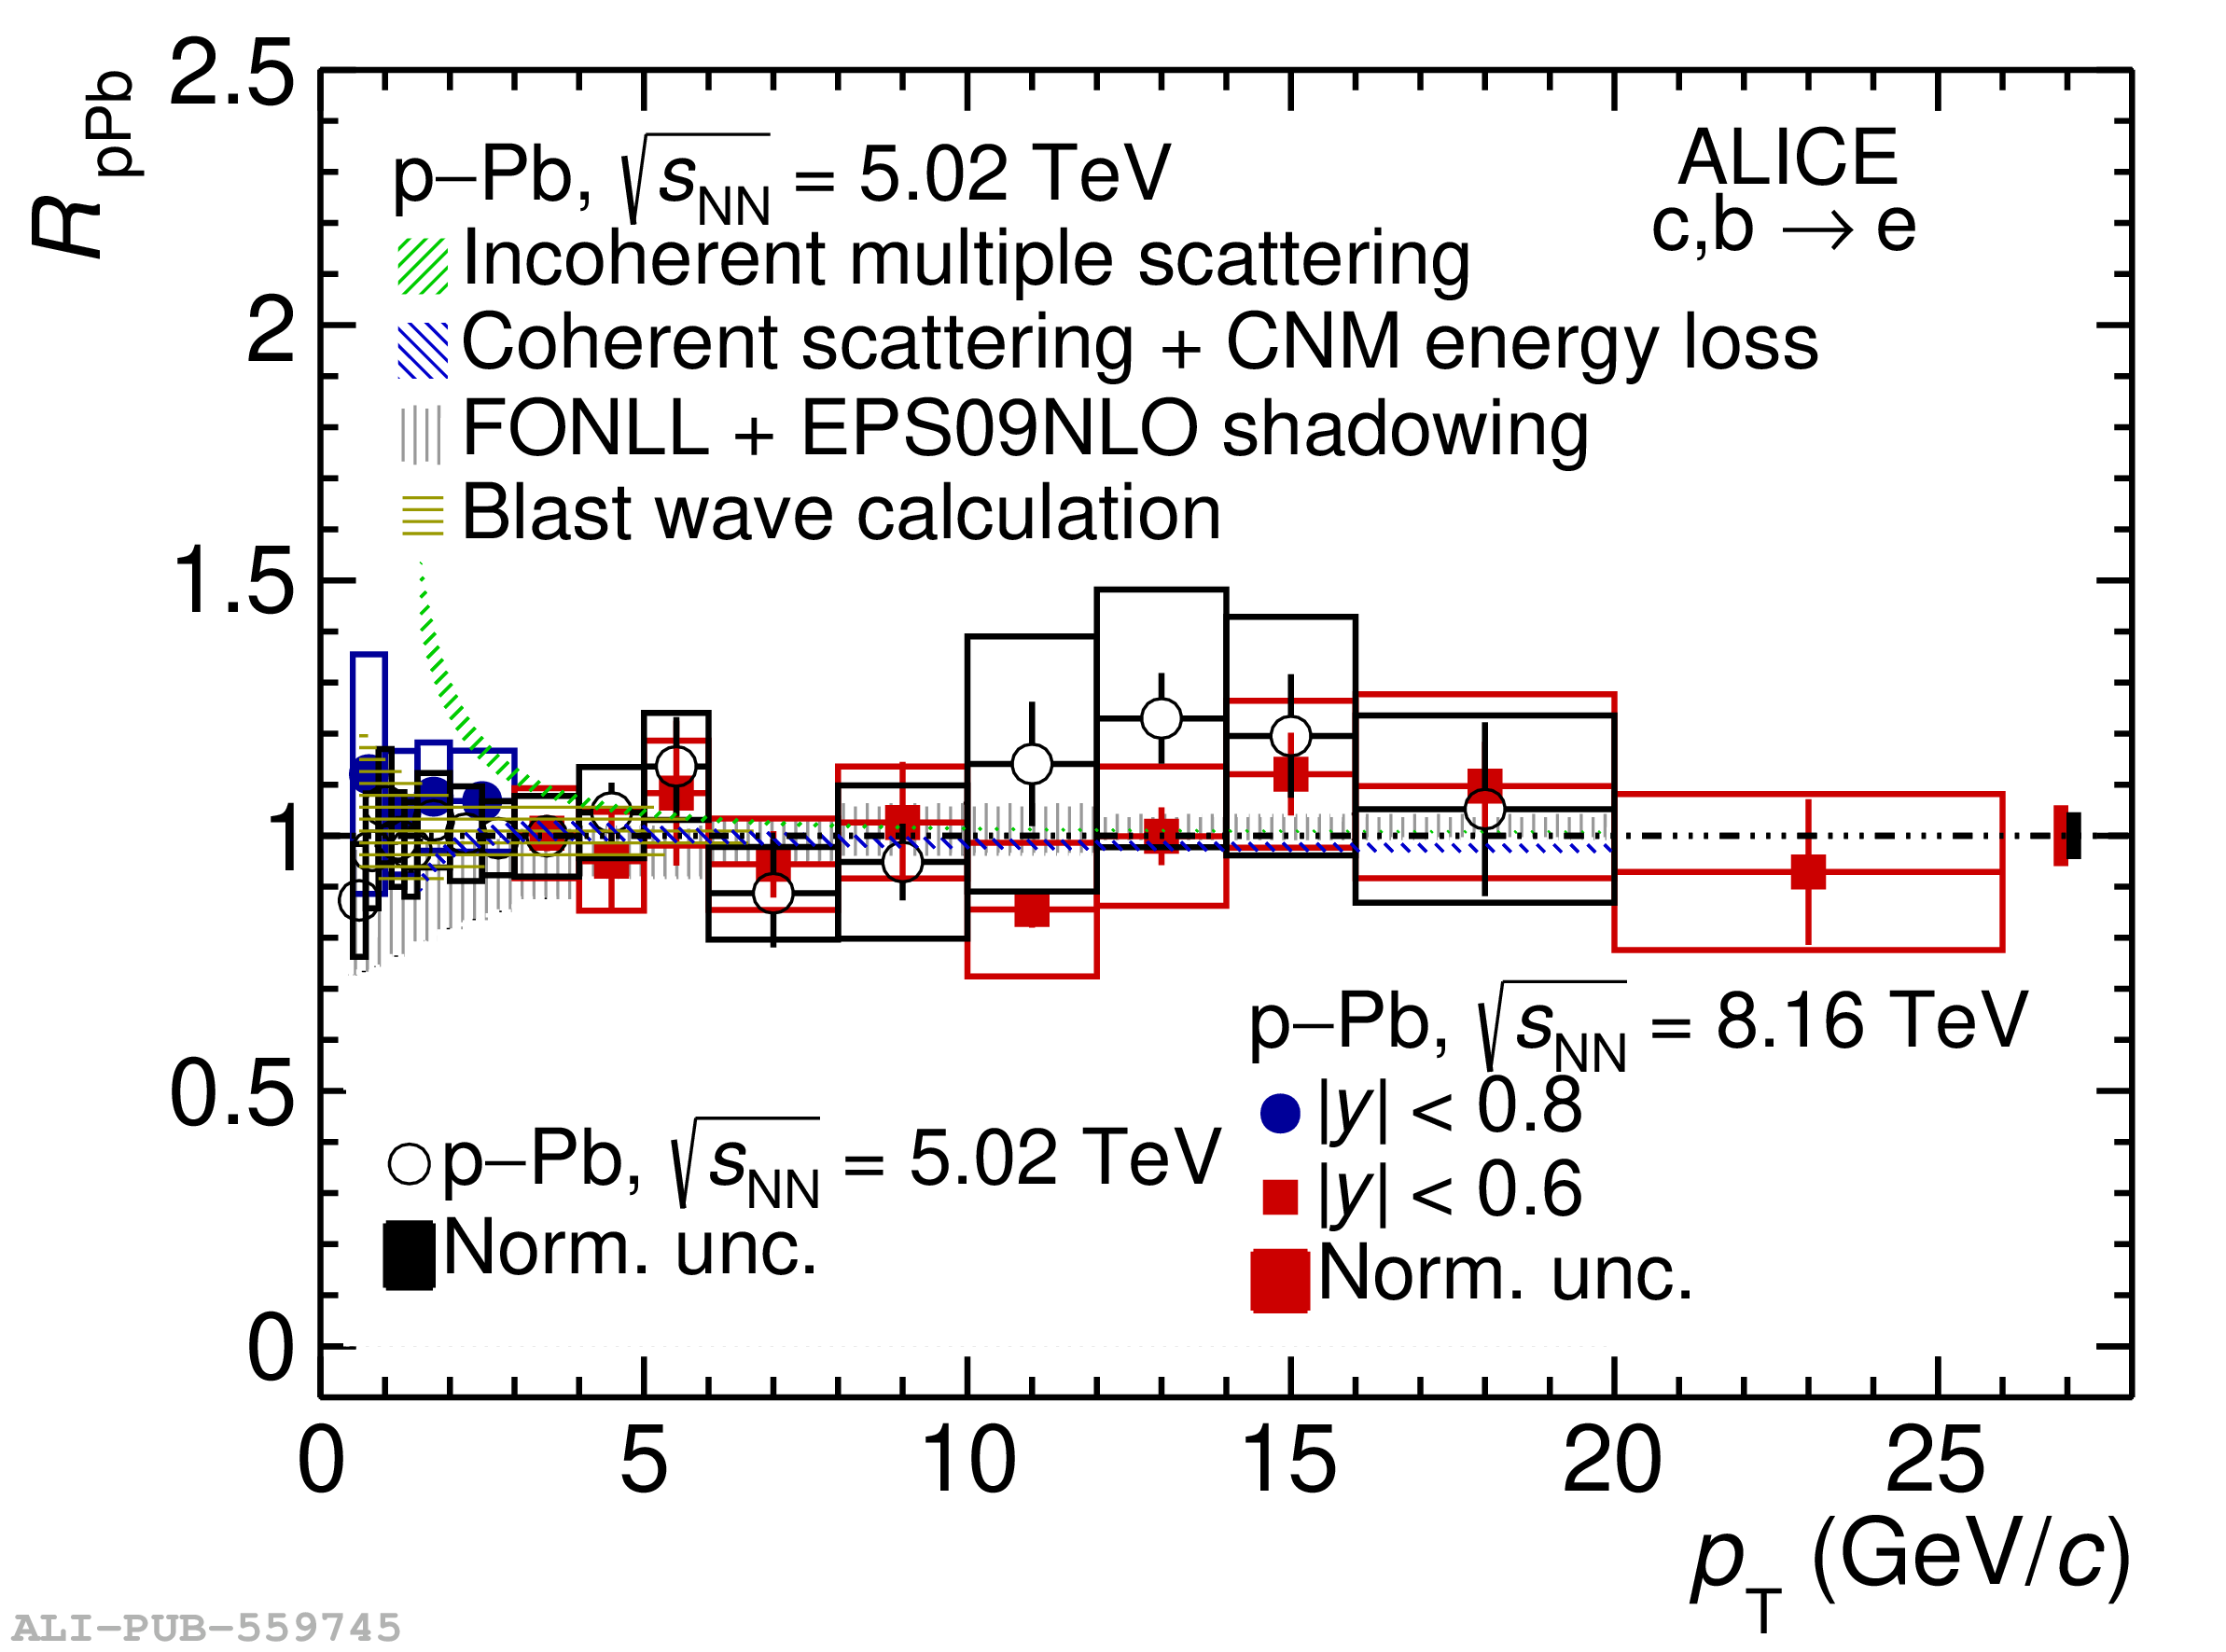
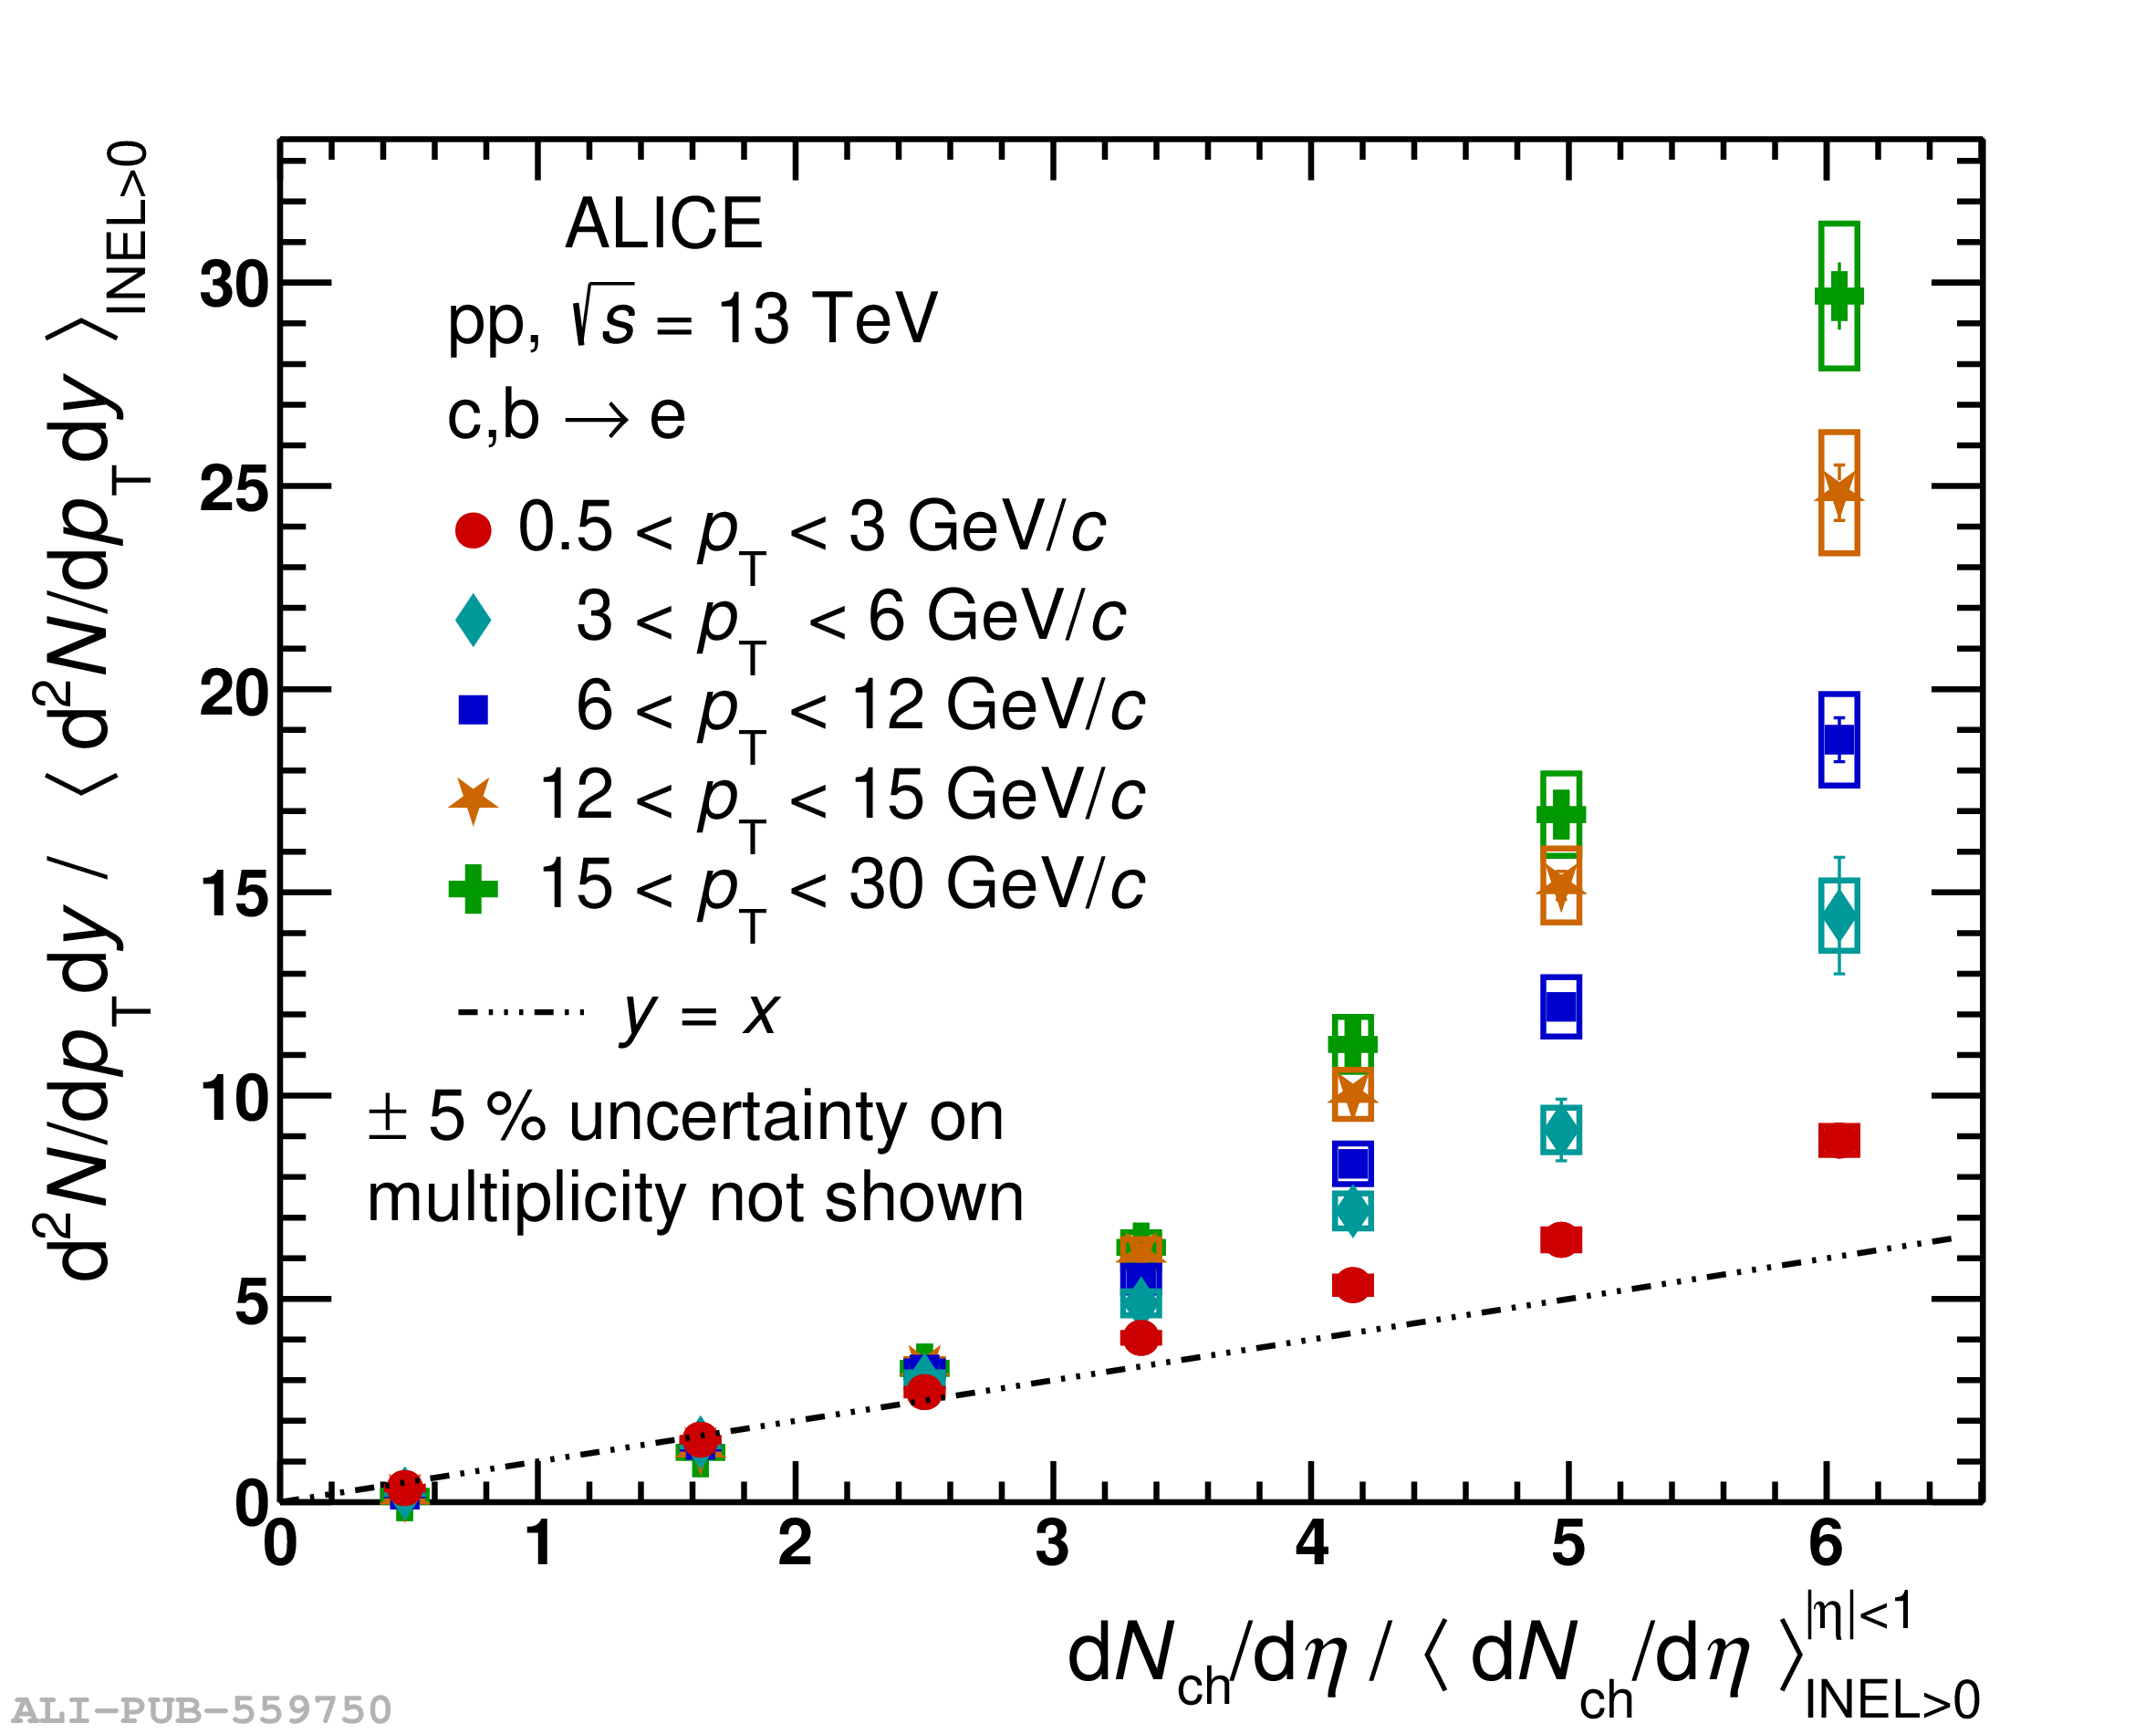
Figure 10
Ratio of the self-normalised yieldsin different \pt intervals with respect to that in the $6 < \pt < 12 {\rm GeV}/c$ interval (left) and double ratio of the self-normalised yields of electrons to the self-normalised multiplicity (right) in pp collisions at $\sqrts=13$ TeV for three \pt ranges. | 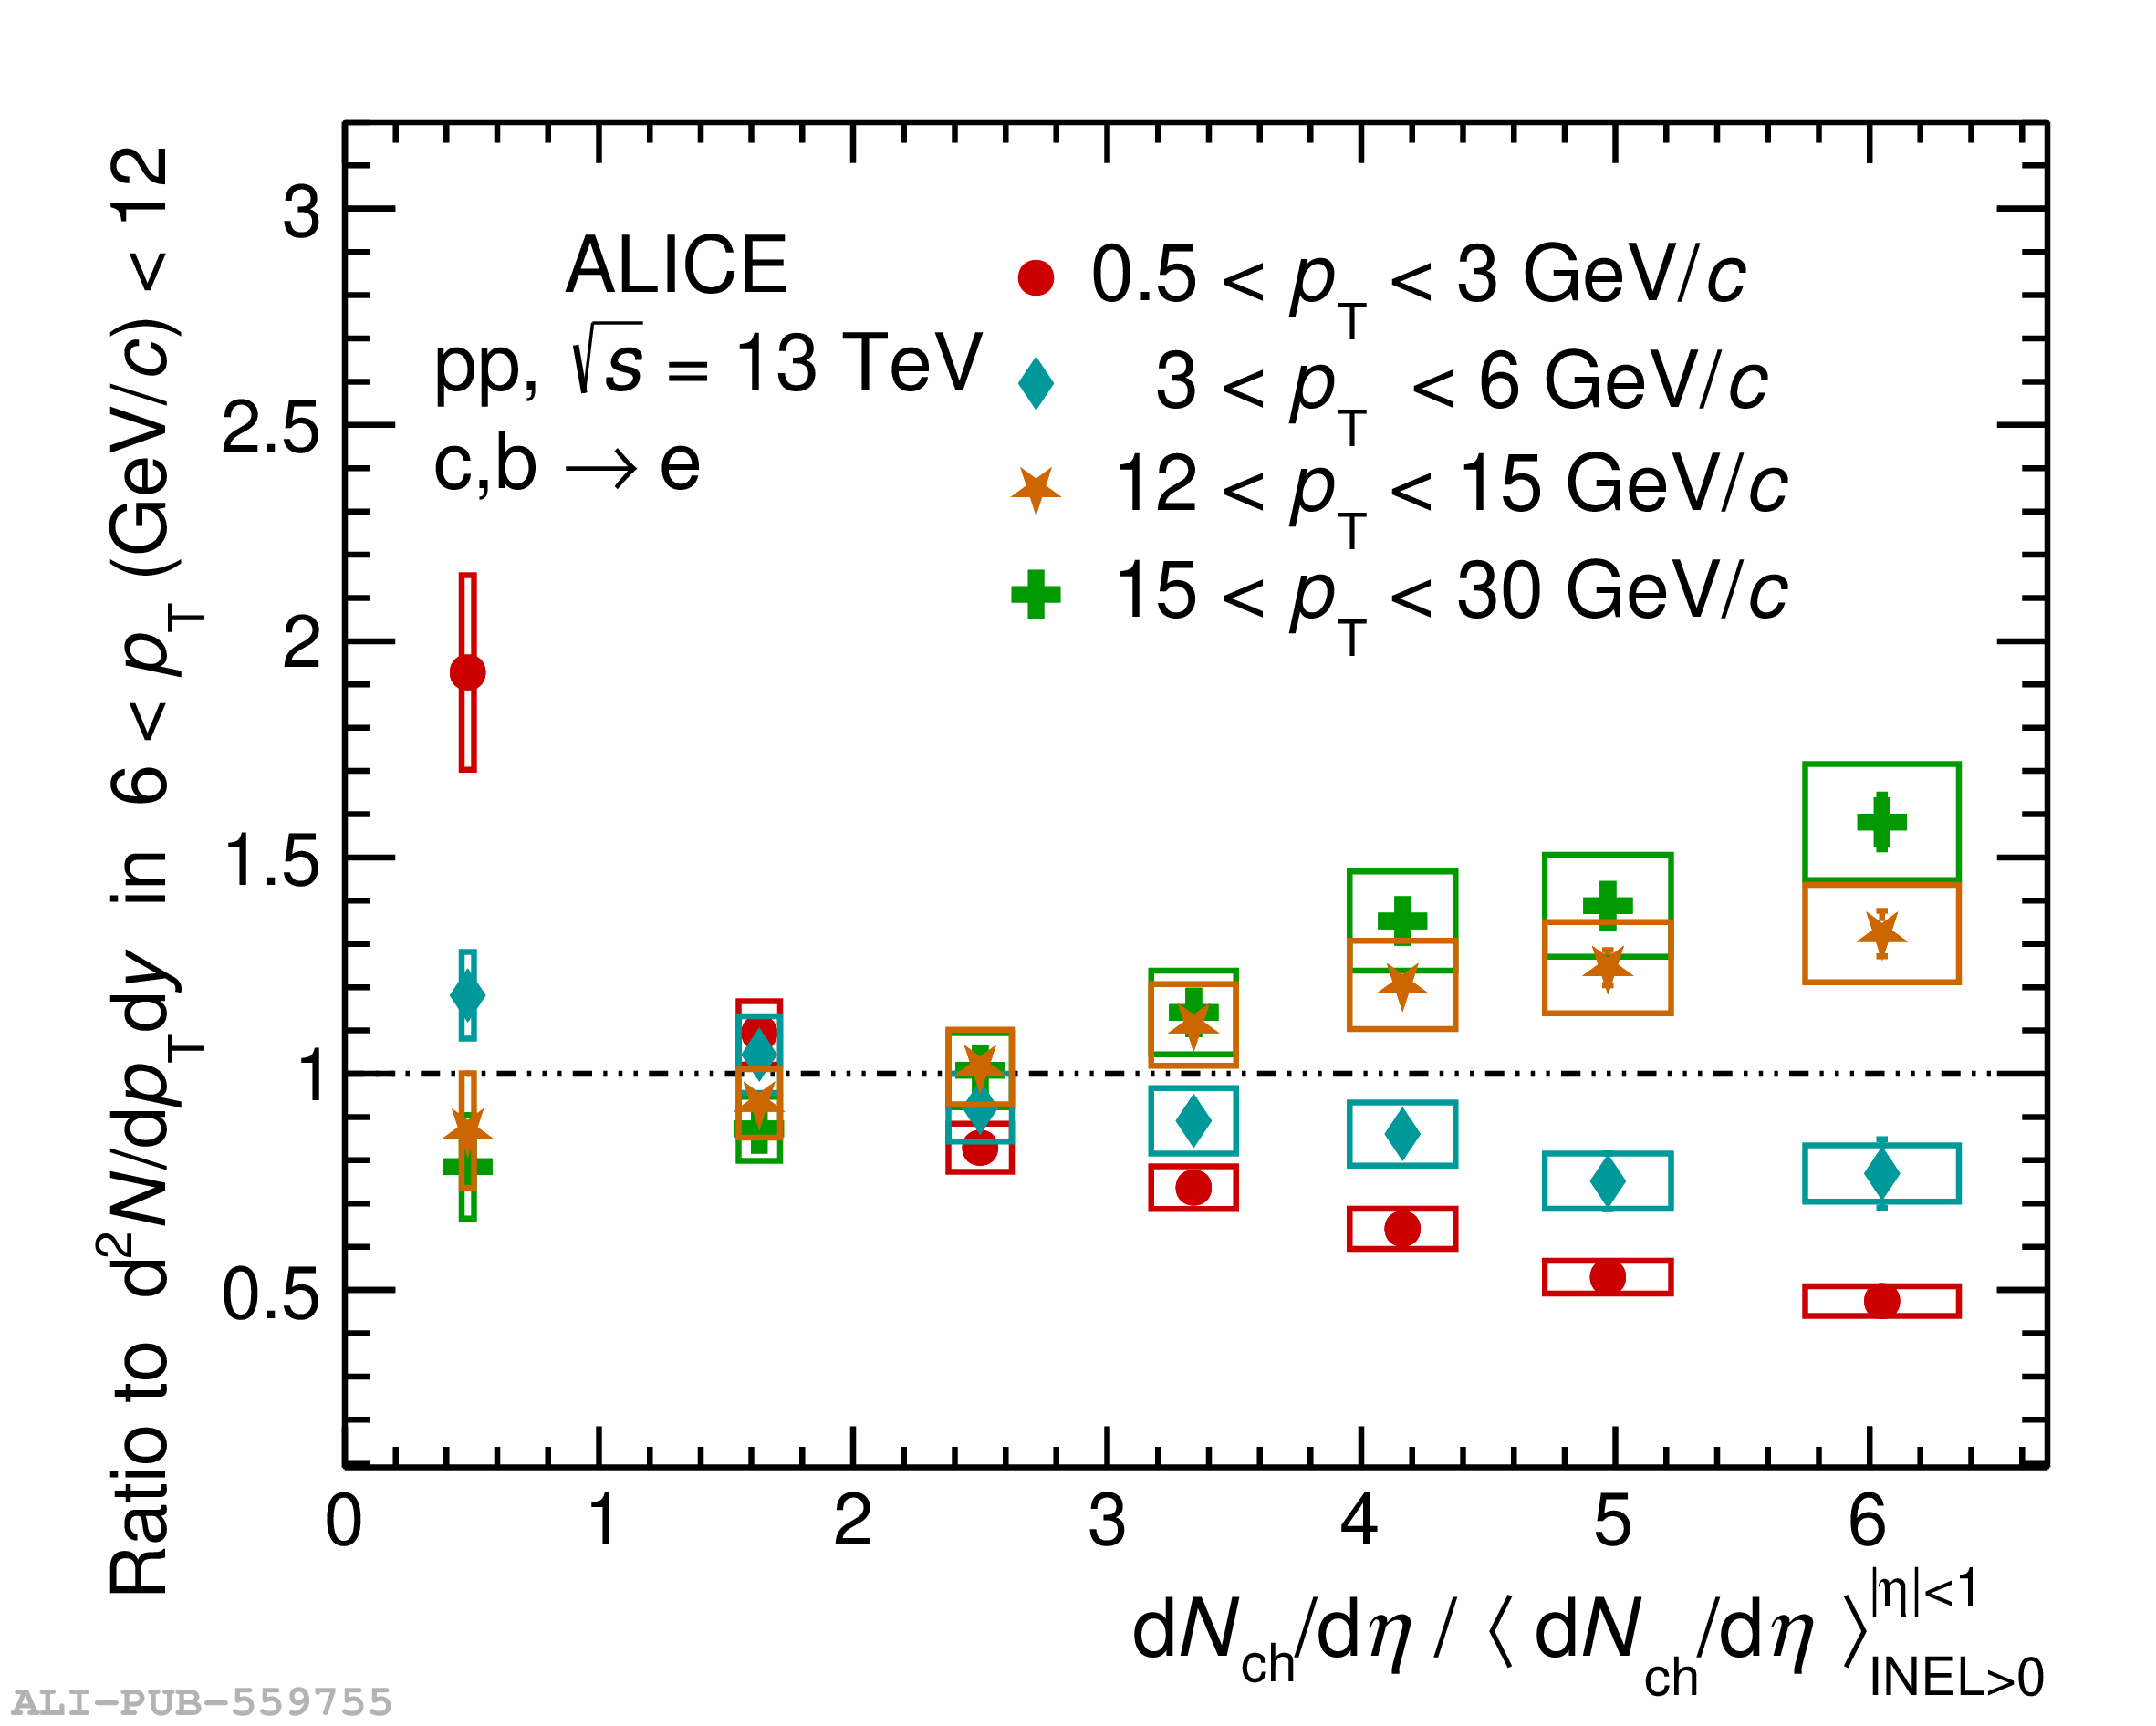  |
Figure 11
Comparison of the self-normalised yield of electrons from heavy-flavour hadron decays as a function of multiplicity measured in \pp collisions at \sqrts $= 13 \rm TeV$ for different \pt intervals with PYTHIA 8.2 Monash tune (left) and PYTHIA 8.2 with CR mode 2 (right). The width of the band is the statistical uncertainty from PYTHIA simulations. The bottom panel shows the ratio of data with respect to the MC predictions. The vertical bars correspond to the propagated statistical error from the data and the MC predictions, and the boxes correspond to systematical uncertainties from the data. | 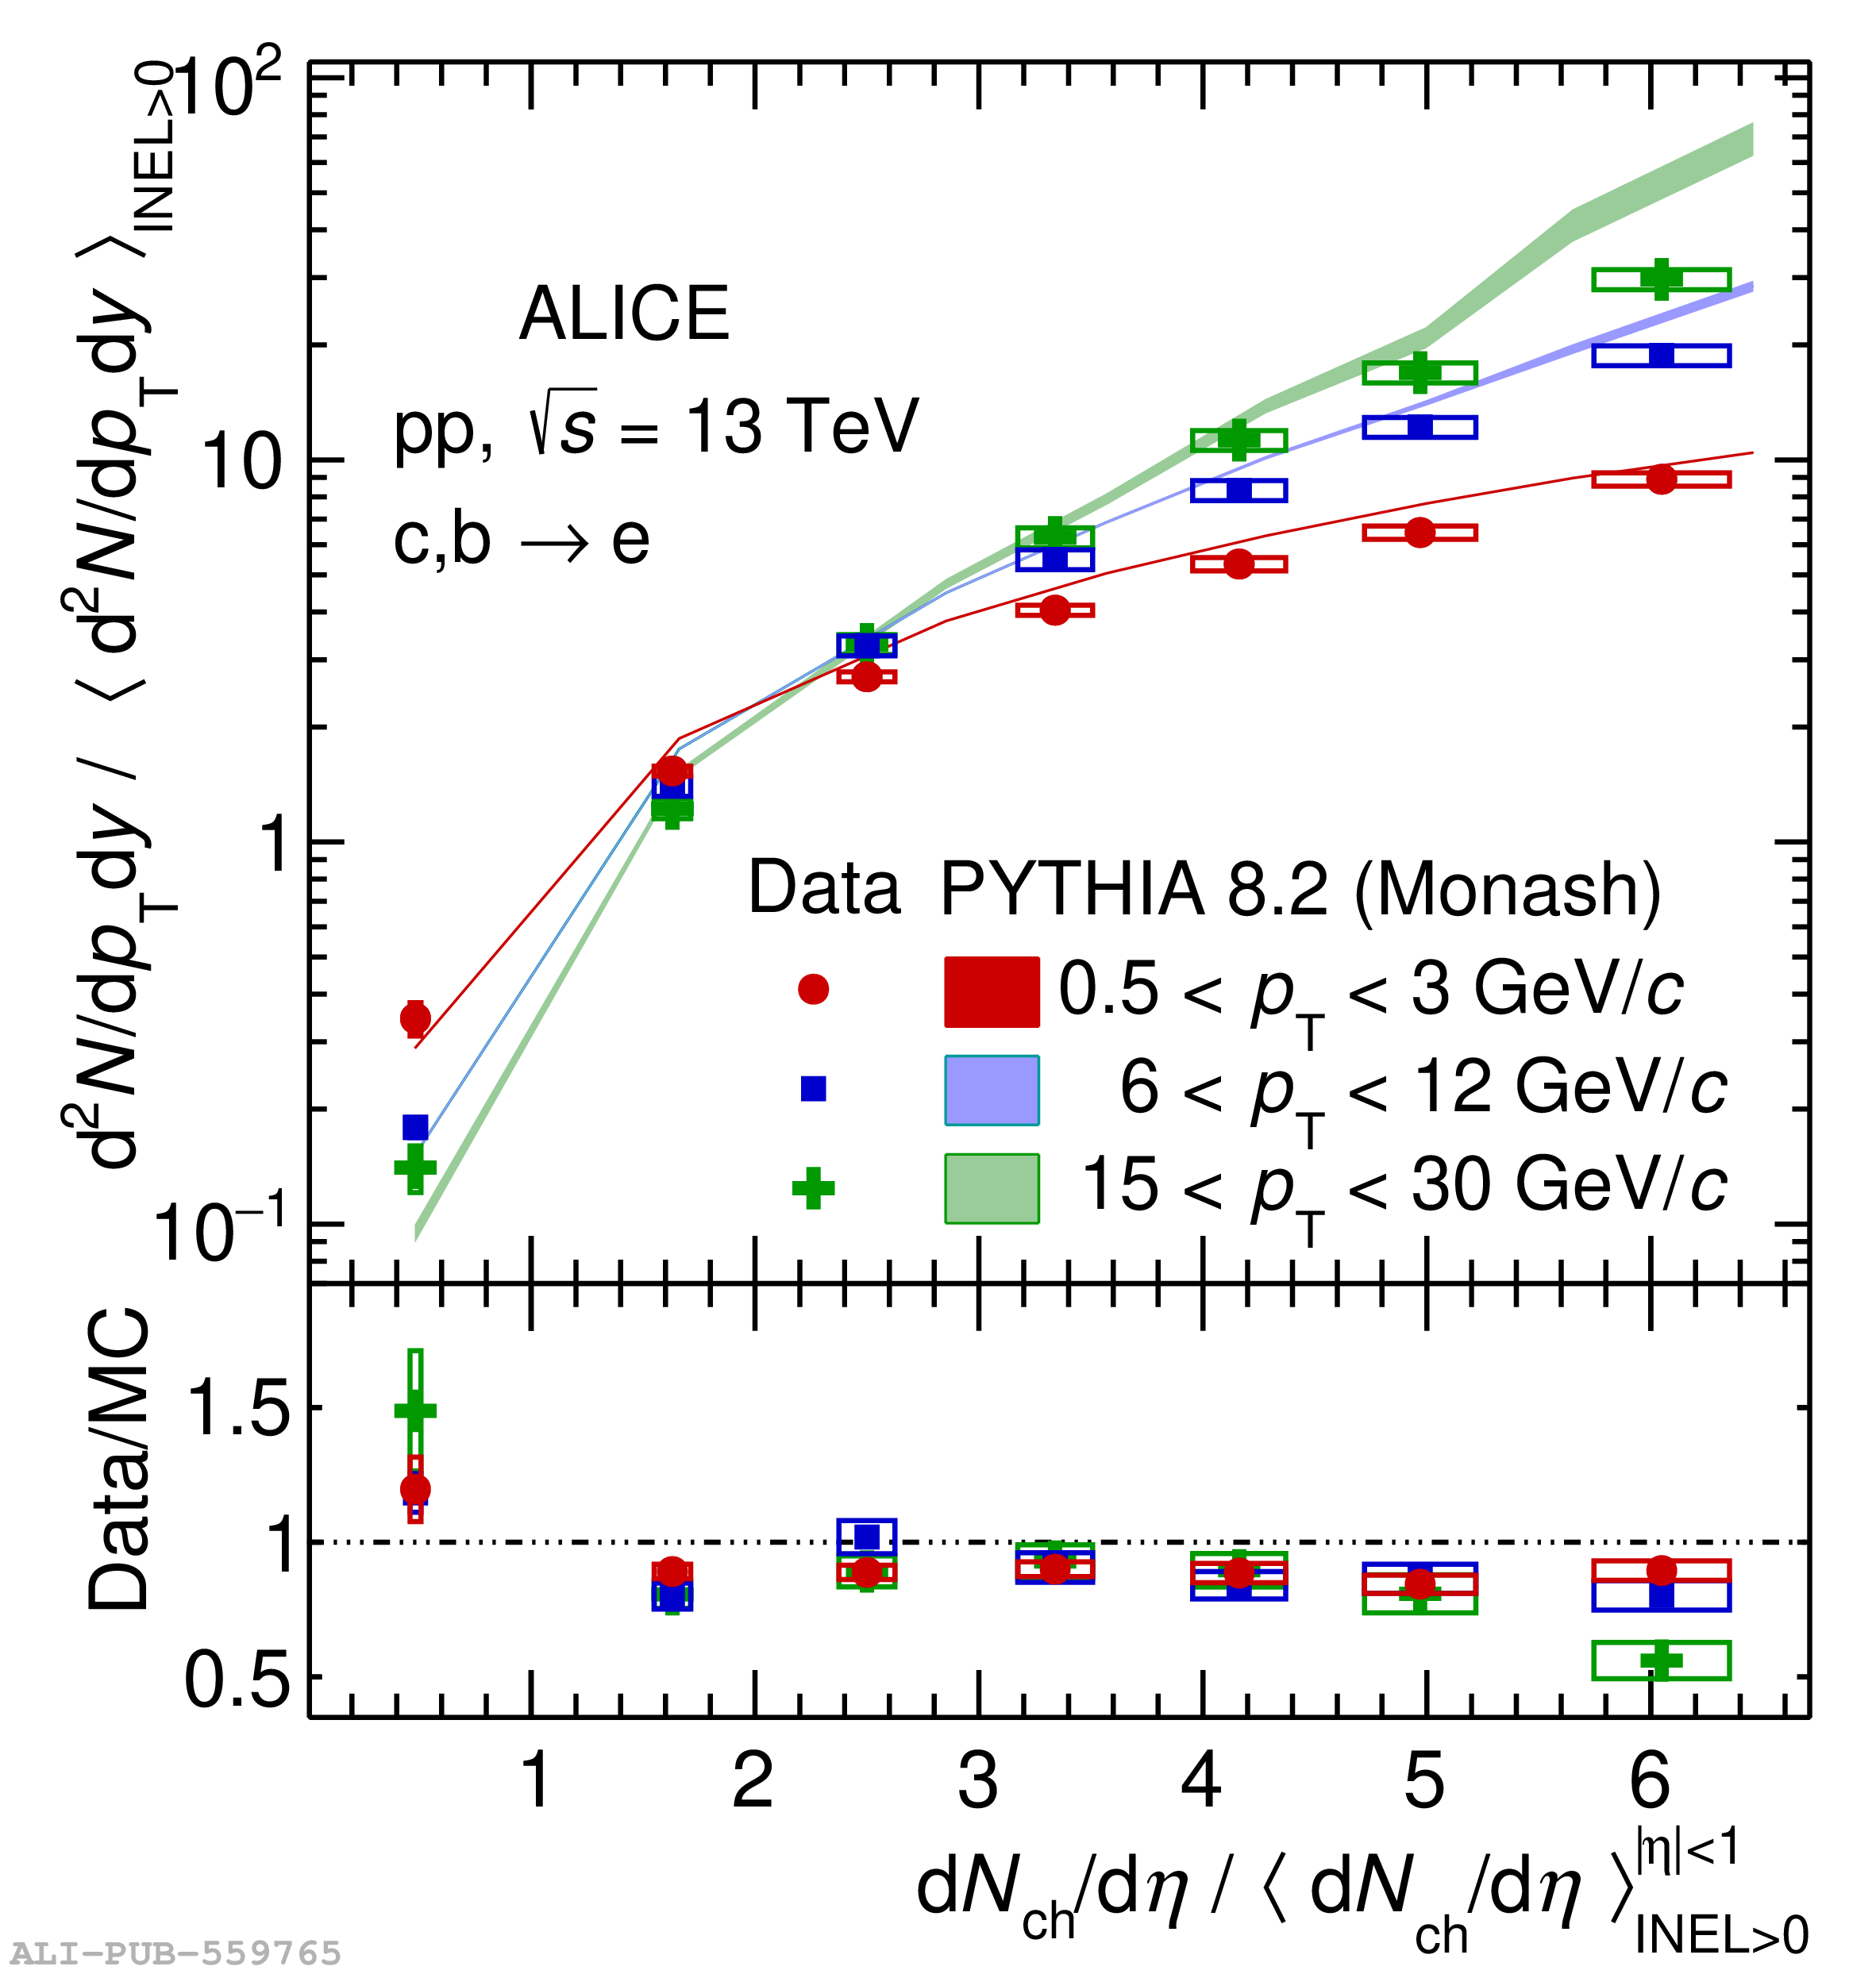 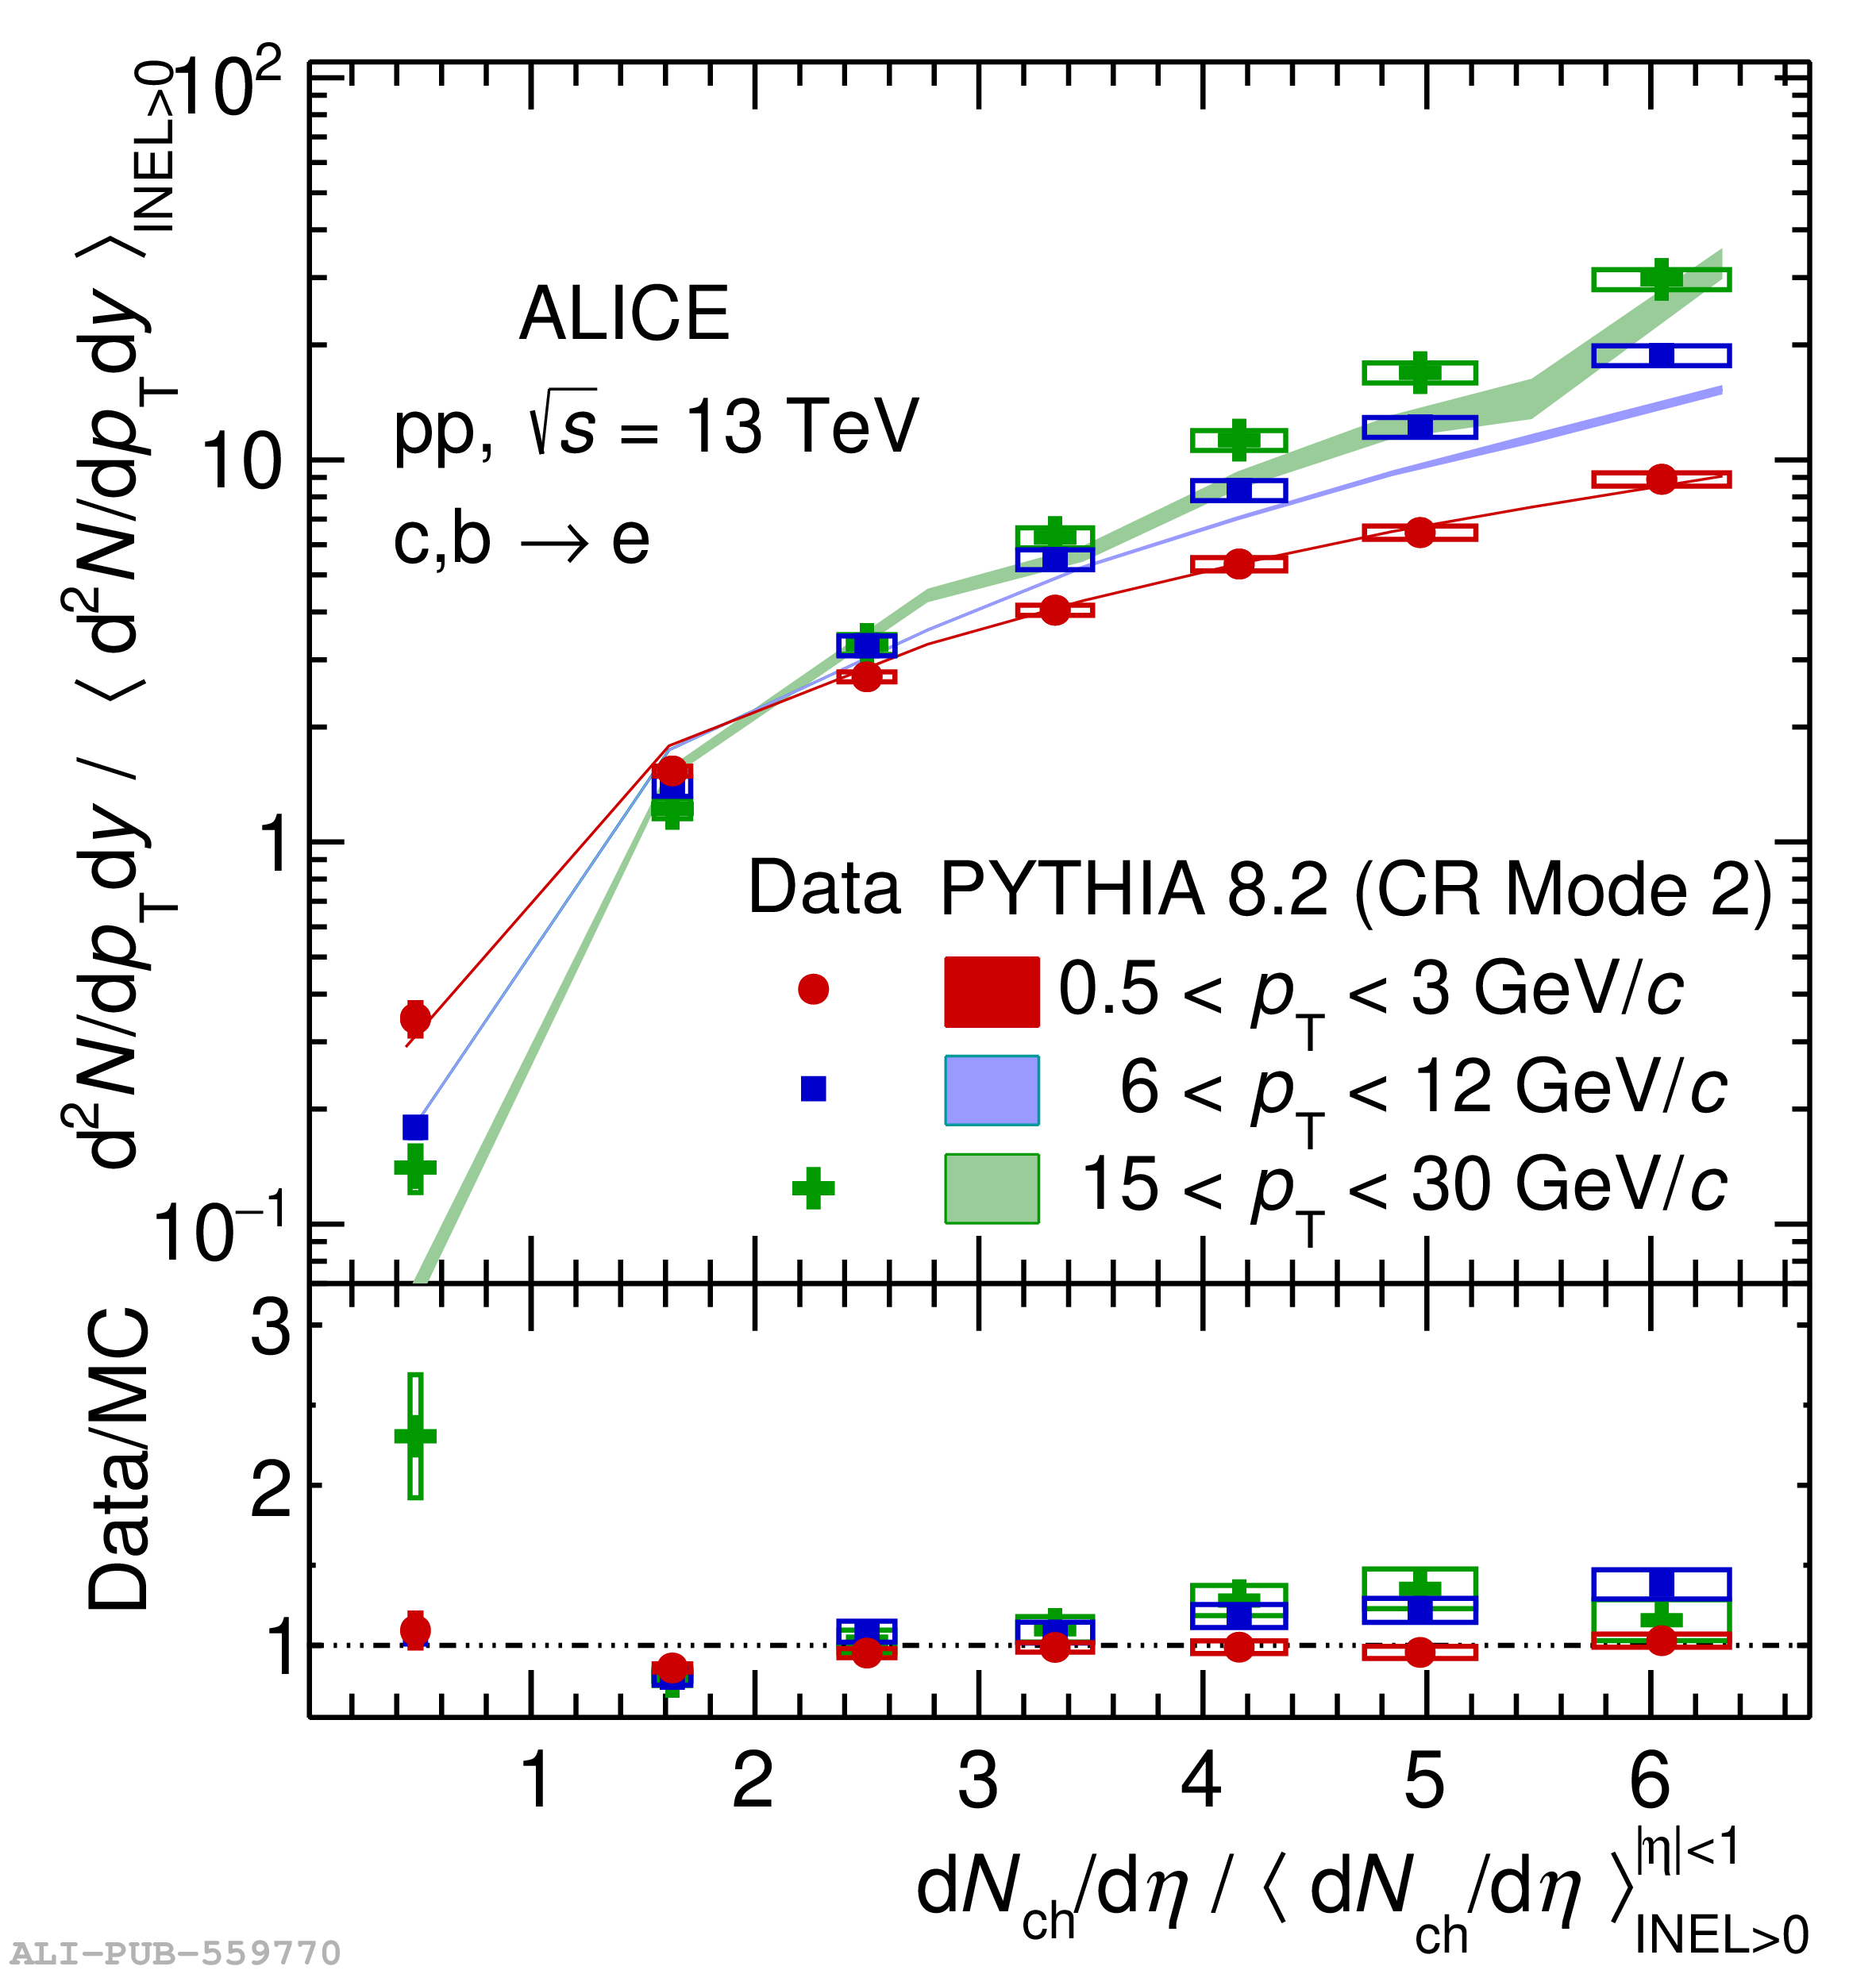 |
Figure 12
Comparison of self-normalised yield of electrons from heavy-flavour hadron decays as a function of multiplicity measured in \pp collisions at \sqrts $= 13 \rm TeV$ for different \pt intervals with EPOS 3 hydro calculations. The width of the band is the statistical uncertainty from EPOS simulations. The bottom panel shows the ratio of data with respect to the MC predictions. The vertical bars correspond to the propagated statistical error from the data and the MC predictions, and the boxes correspond to systematical uncertainties from the data. The ratio for the lowest multiplicity point for 15 $<$ \pt $<$ 30 \GeVc (not shown in the figure) is 13$\pm$18. | 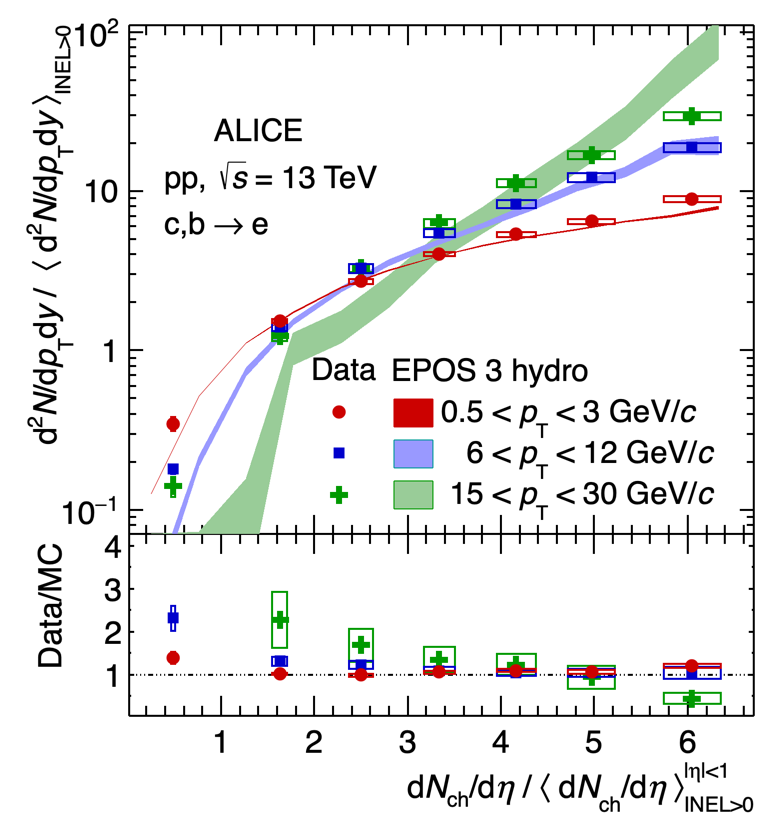 |
Figure 13
Comparison of the self-normalised yield of electrons from heavy-flavour hadron decays measured in \pp collisions at \sqrts $= 13 \rm TeV$ with the self-normalised yields of J/$\psi$ in \pp collisions at \sqrts $= 13 \rm TeV$ (top left), charged particles in \pp collisions at \sqrts $= 13 \rm TeV$ (top right), D mesons in \pp collisions at \sqrts $= 7 \rm TeV$ (bottom left) and strange particles in \pp collisions at \sqrts $= 13 \rm TeV$ (bottom right), in comparable \pt bins. | 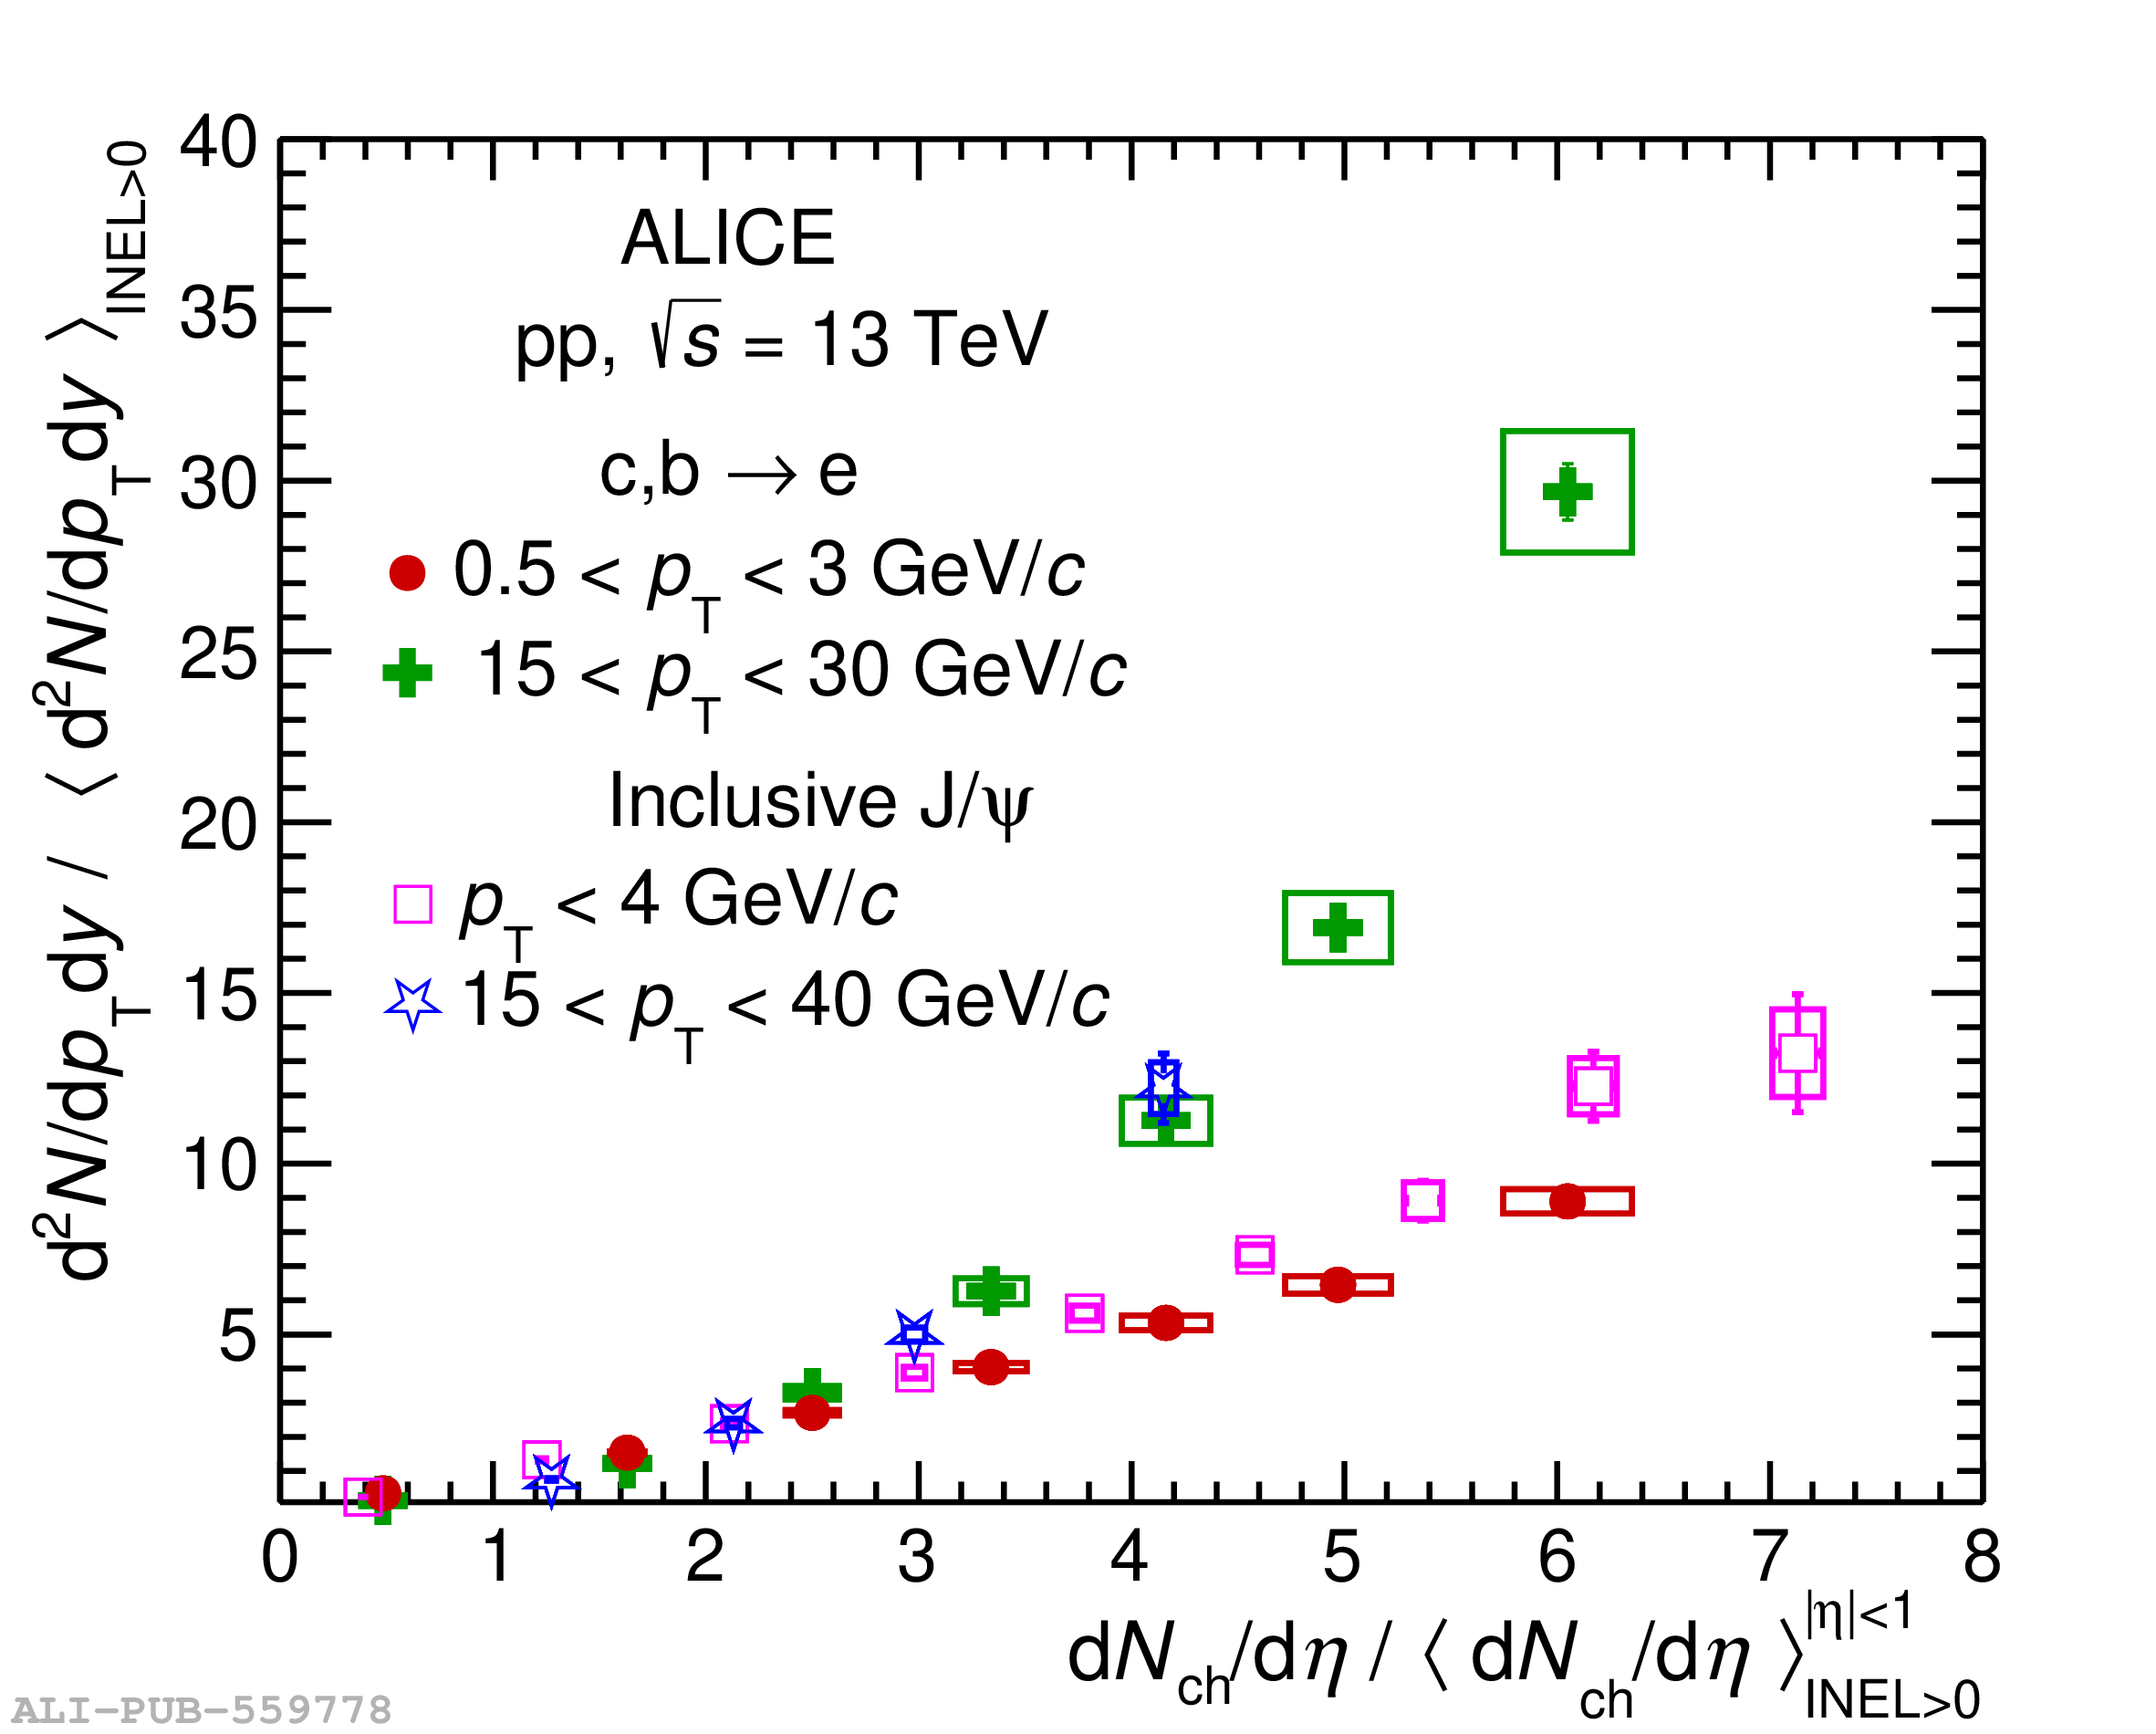  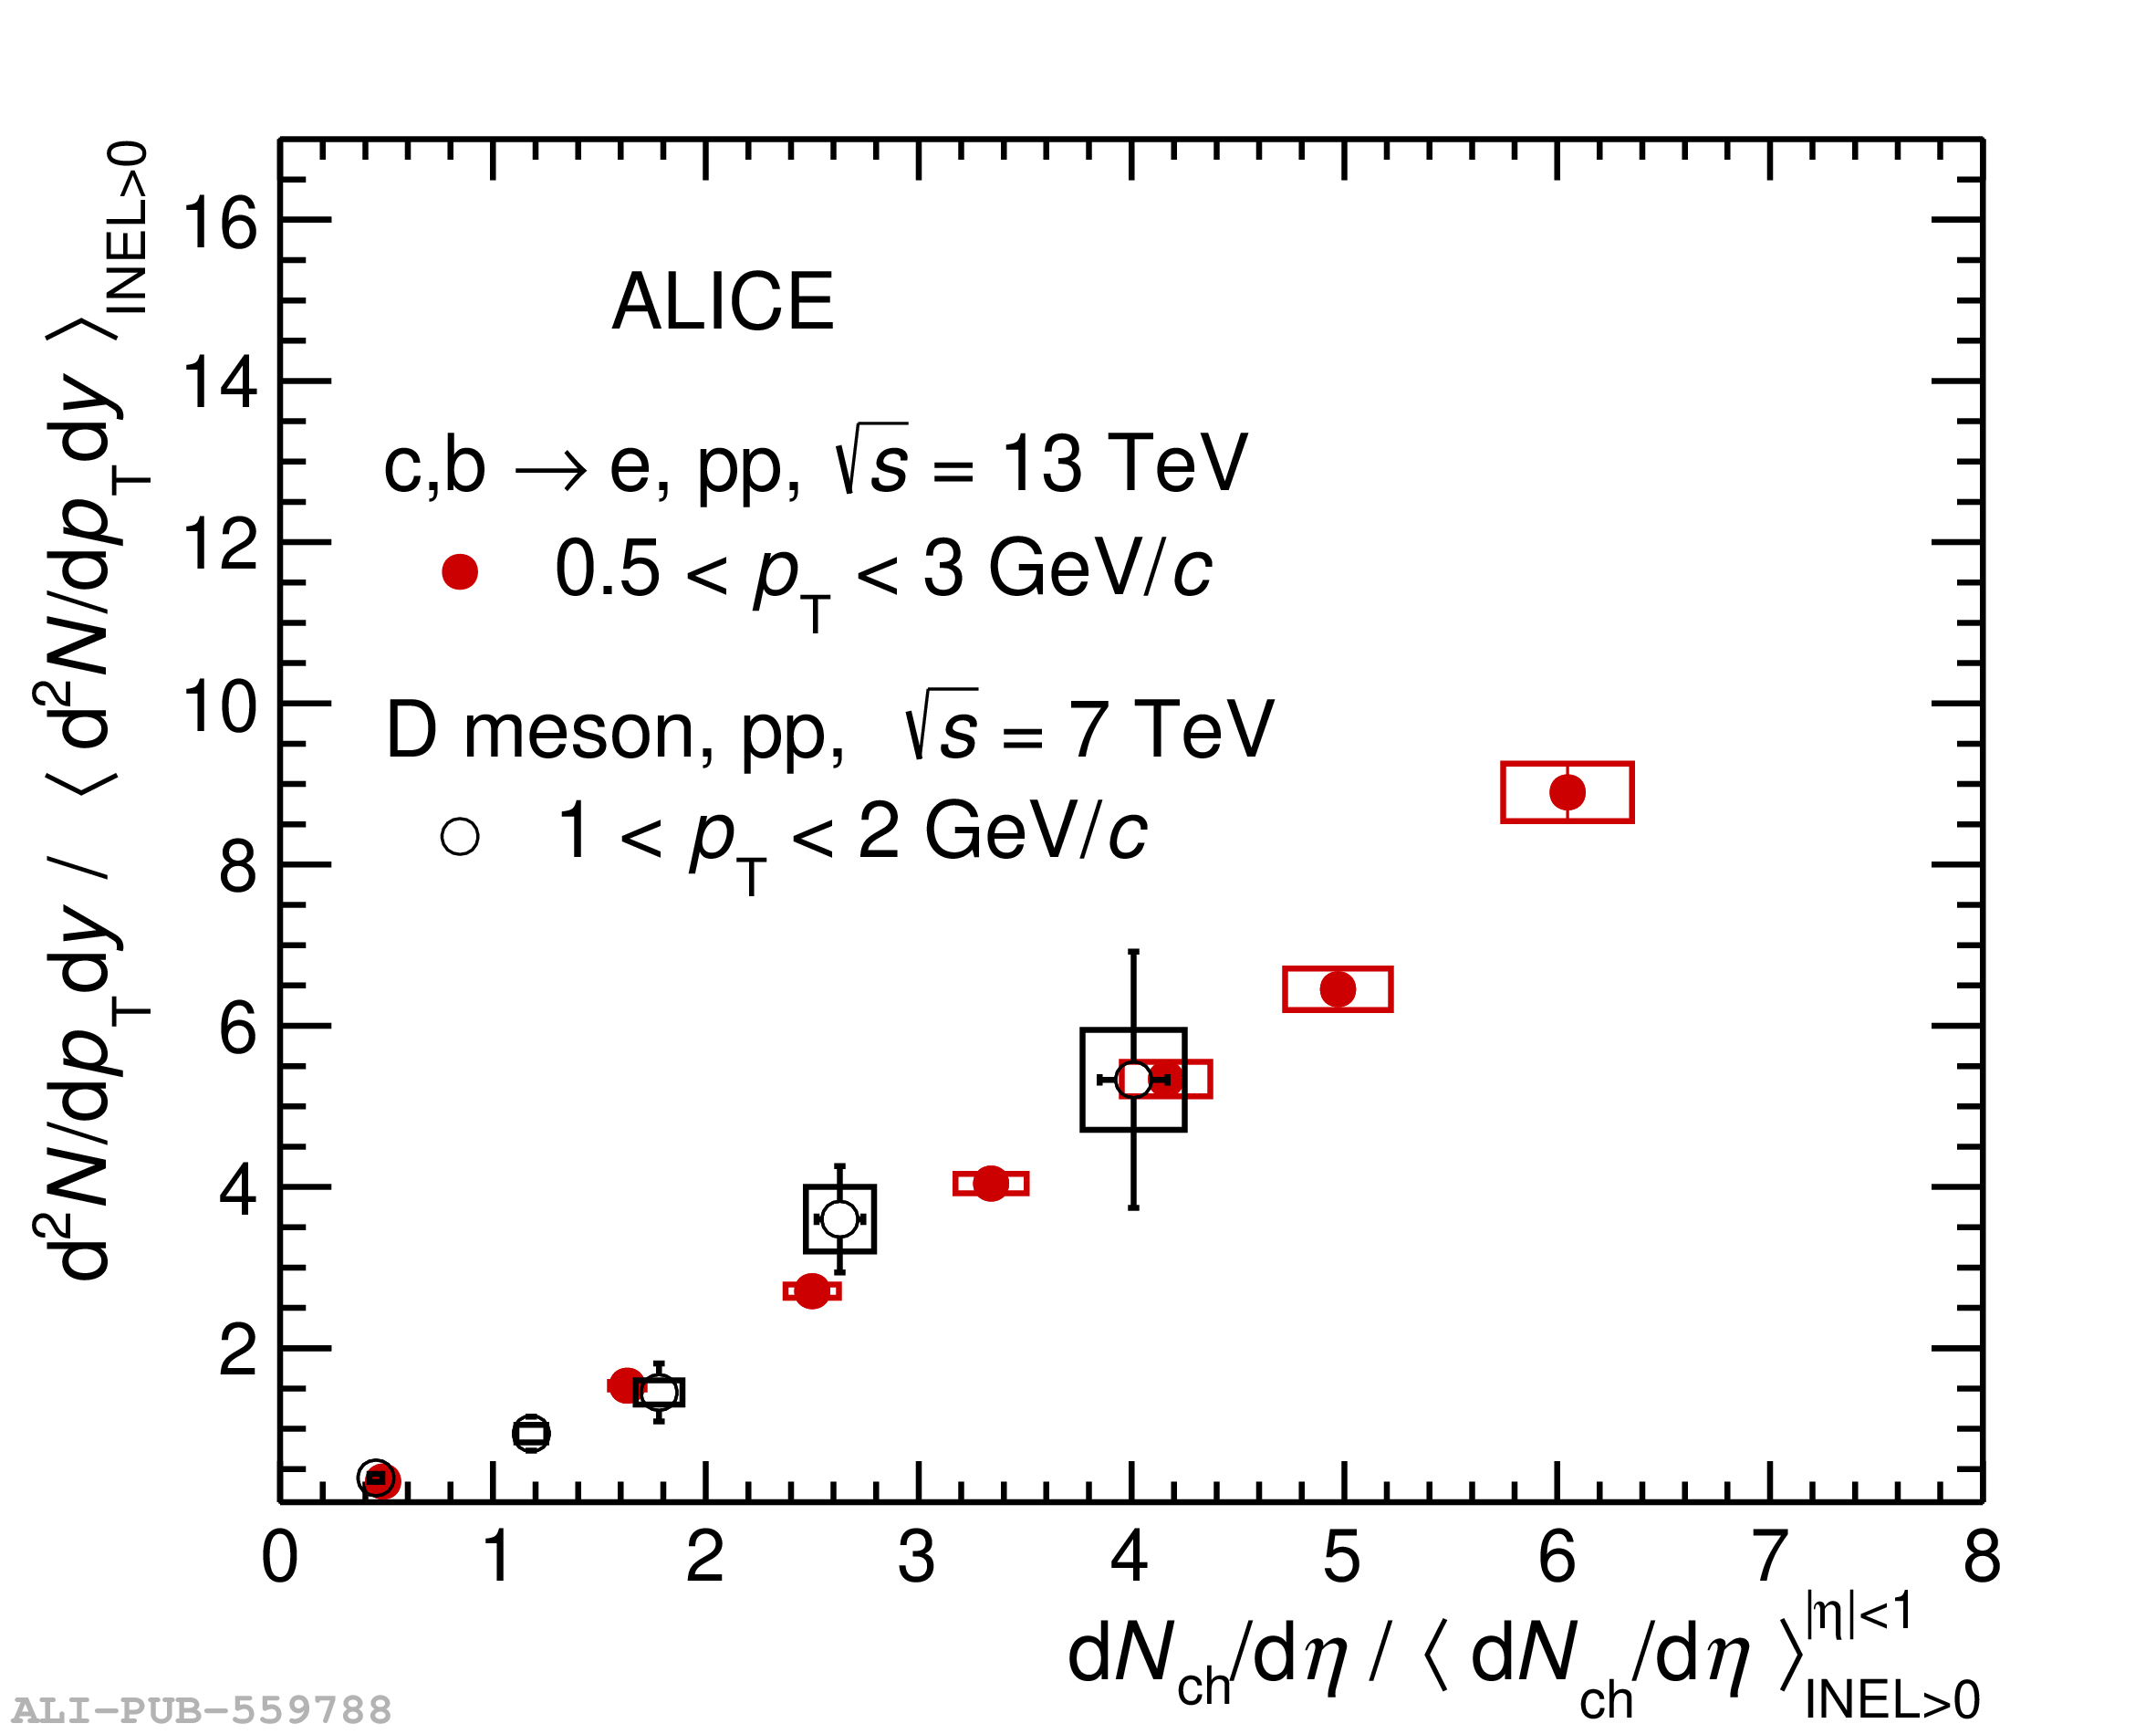  |
Figure 14
Self-normalised yield of electrons from heavy-flavour hadron decays as a function of self-normalised charged-particle pseudorapidity density at midrapidity measured in \pPb collisions at \sqrtsNN $= 8.16 \rm TeV$ in different \pt intervals. The position of the points on the $x$-axis are shifted horizontally by $\rm \delta x$ to improve the visibility. | 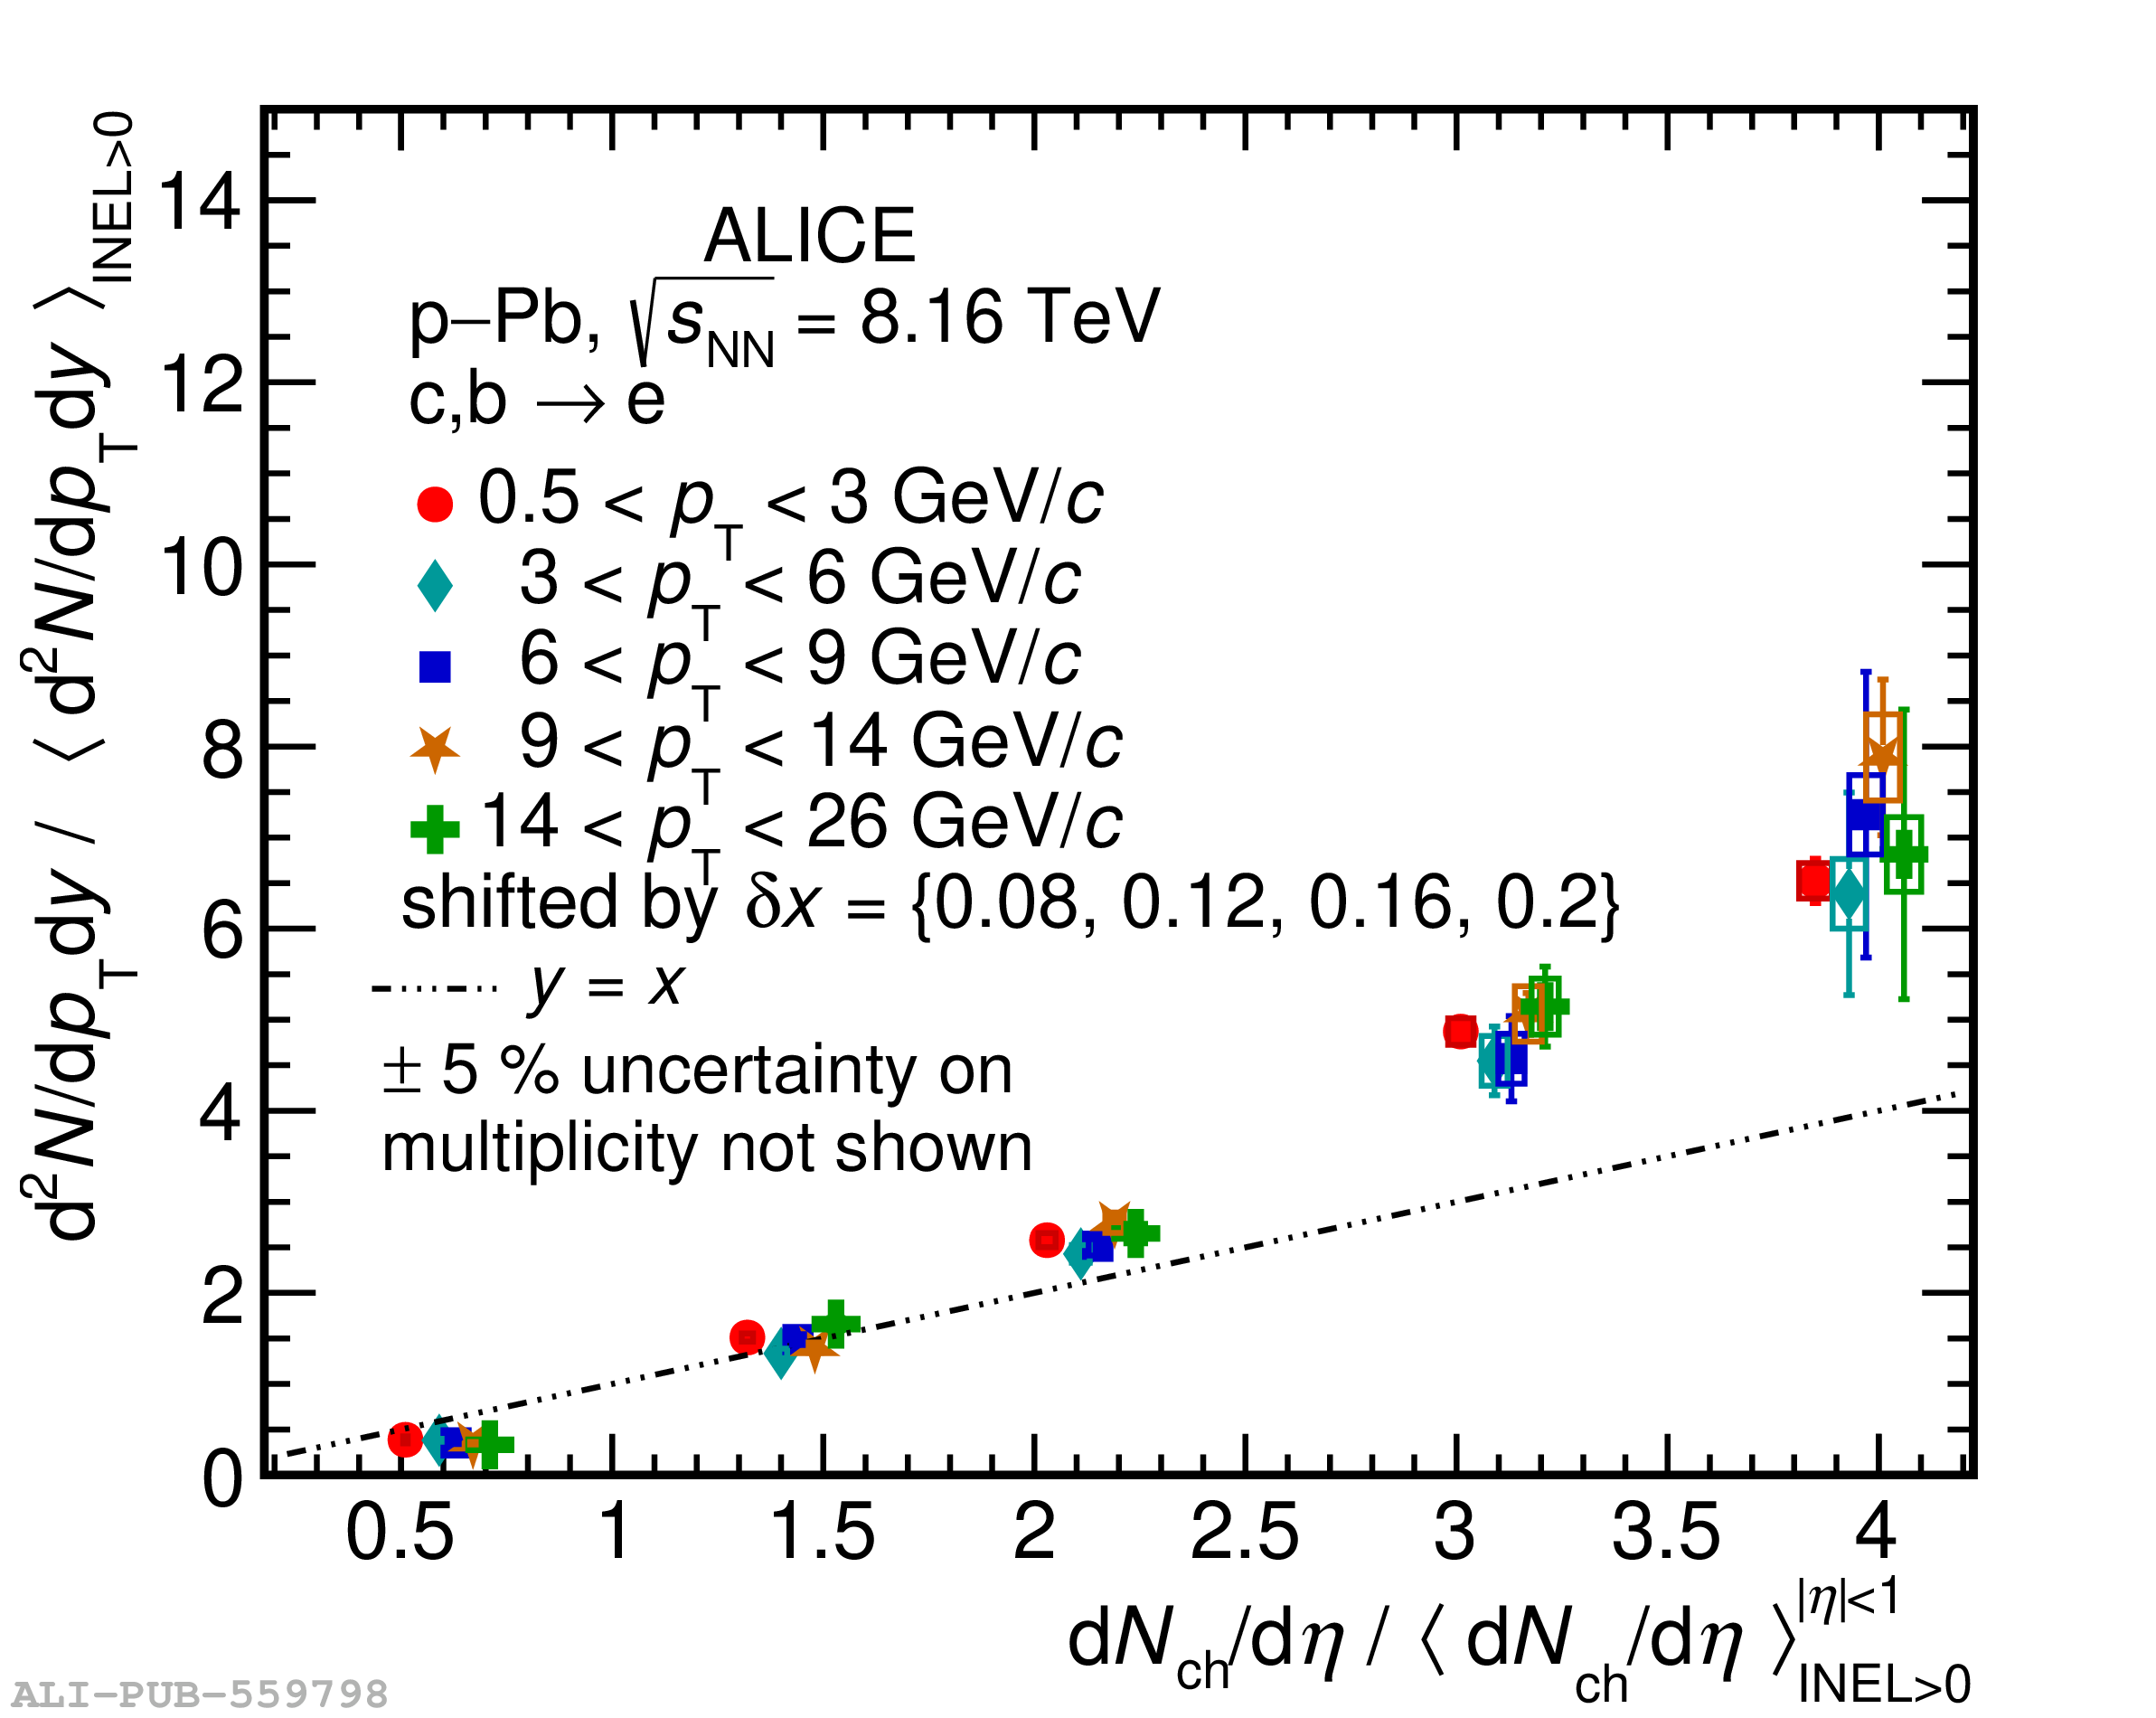 |
Figure 15
Ratio of the self-normalised yieldin different \pt intervals with respect to that in the $3 < \pt < 6 {\rm GeV}/c$ interval (left). Double ratio of the self-normalised yield of heavy-flavour hadron decay electrons to the self-normalised multiplicity in \pPb collisions at \sqrtsNN $= 8.16 \rm TeV$ in three \pt ranges (right). | 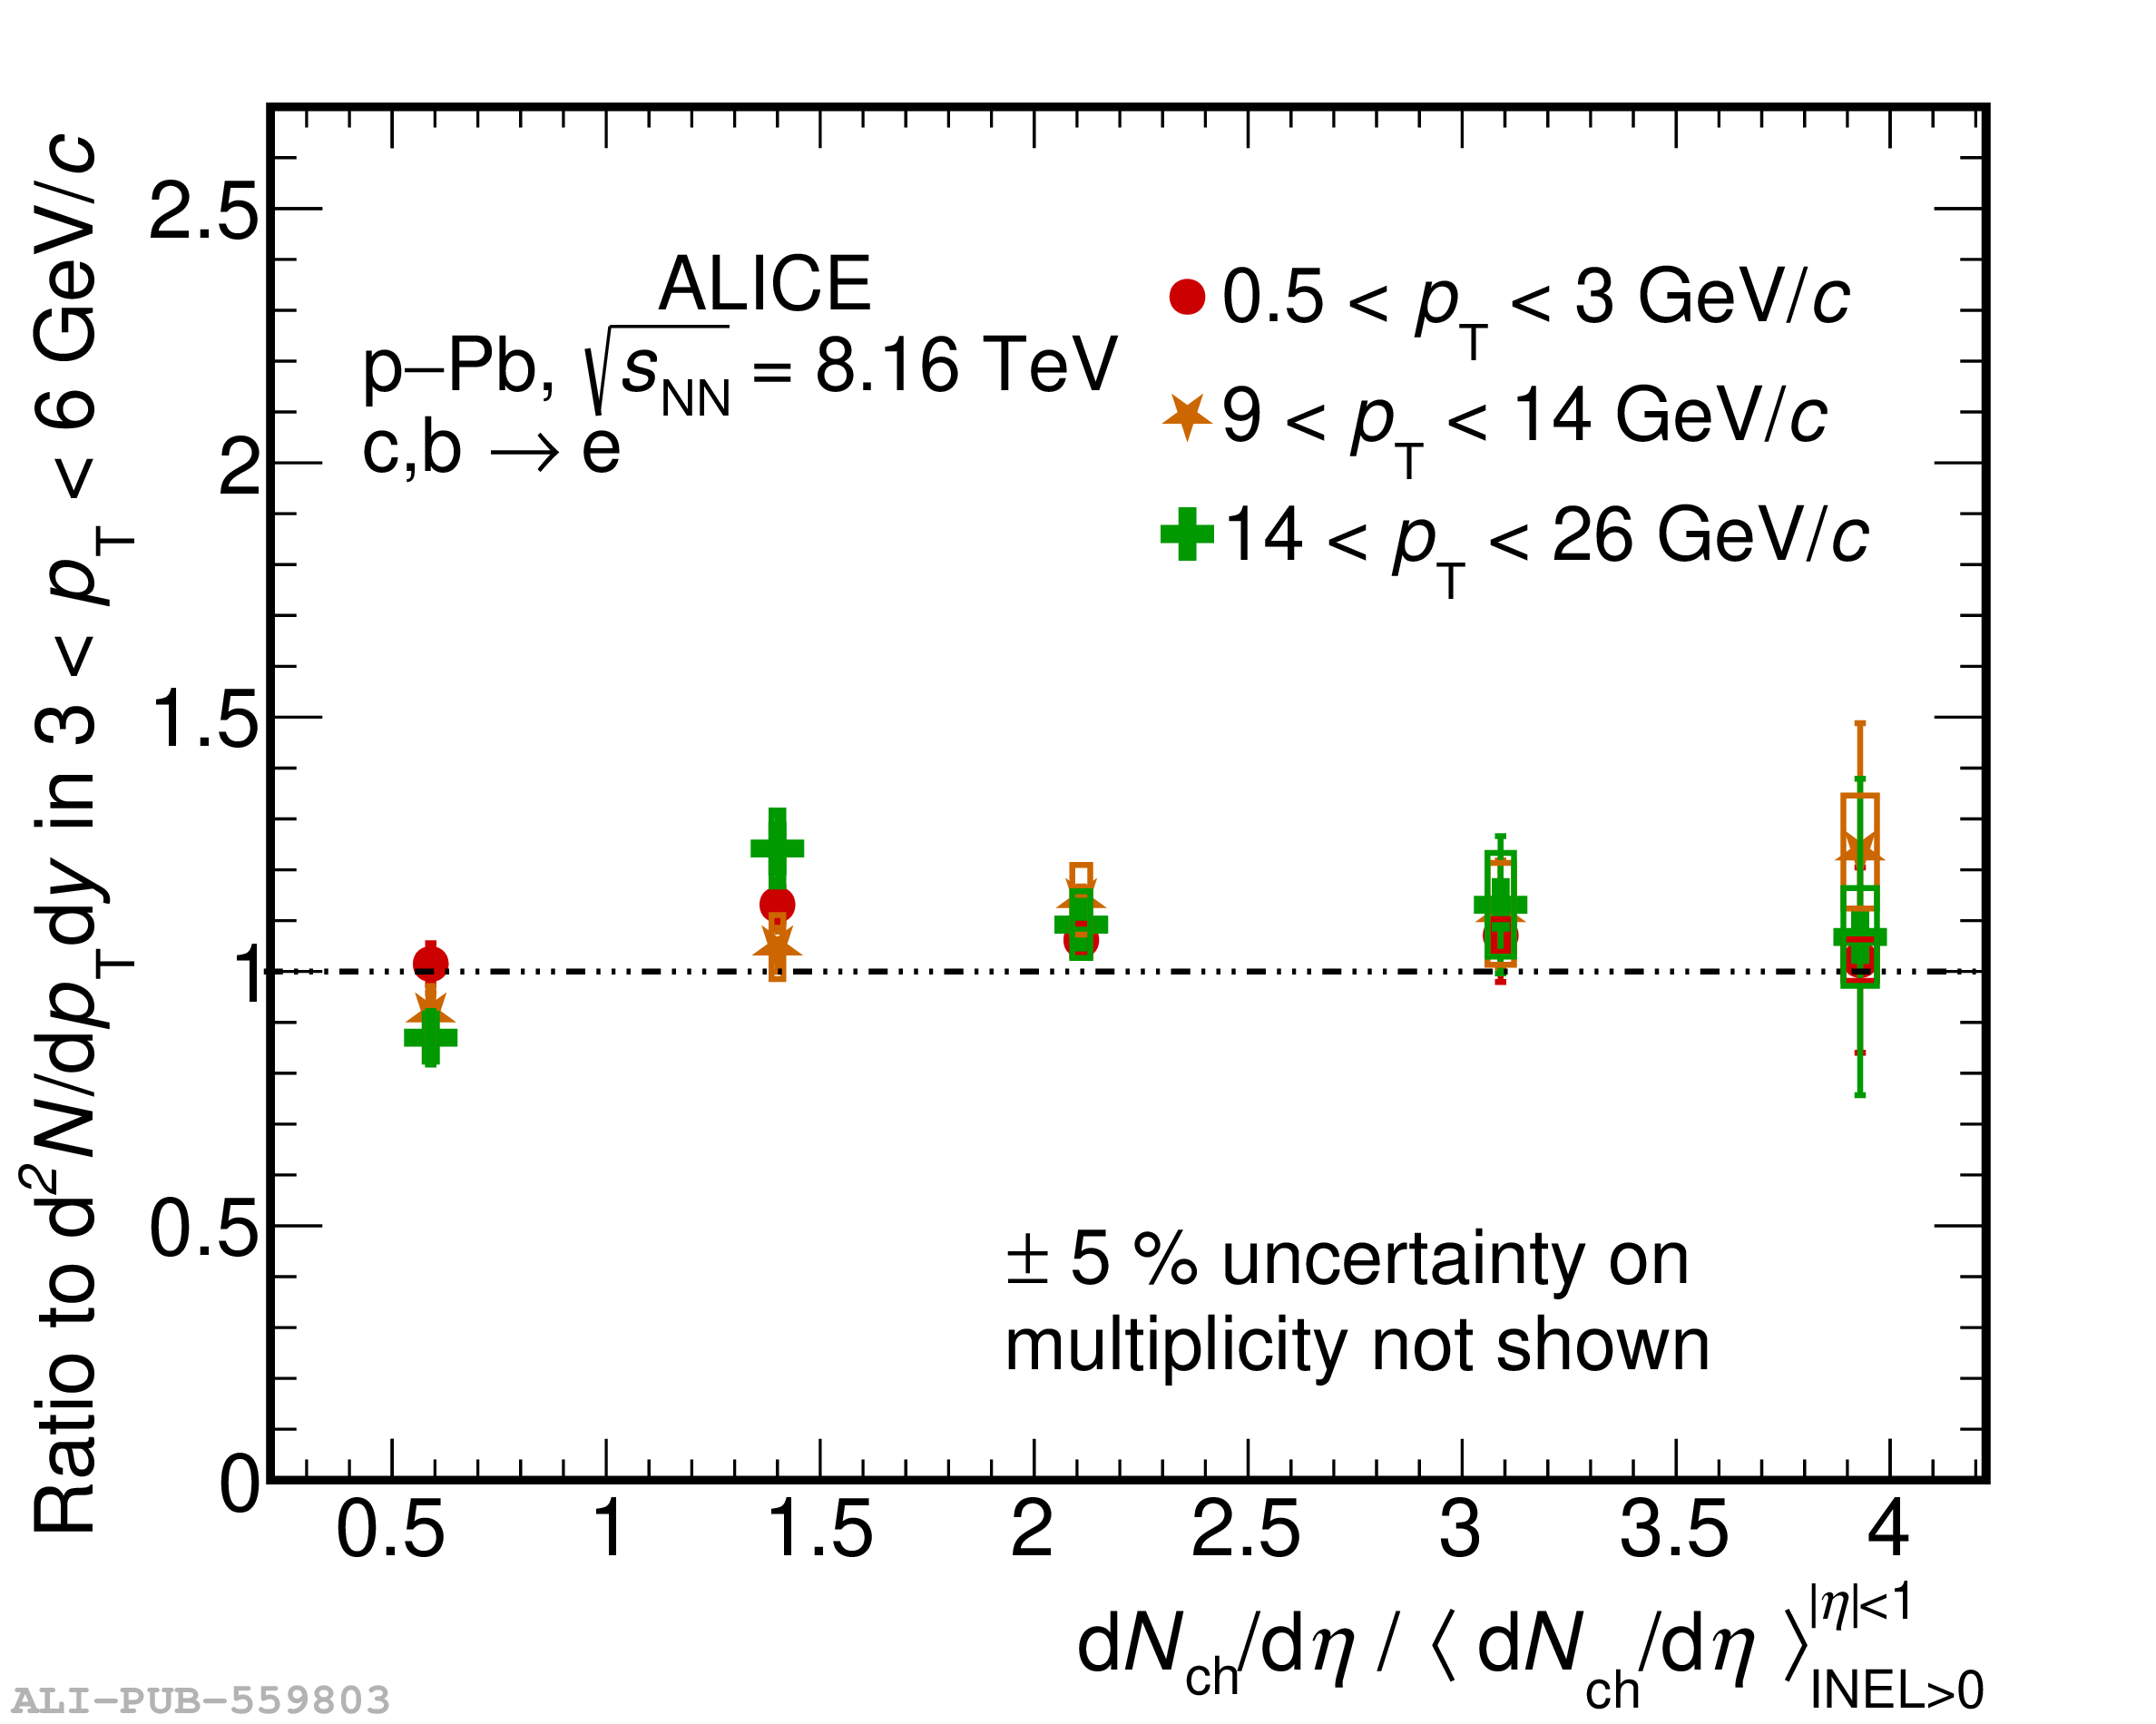 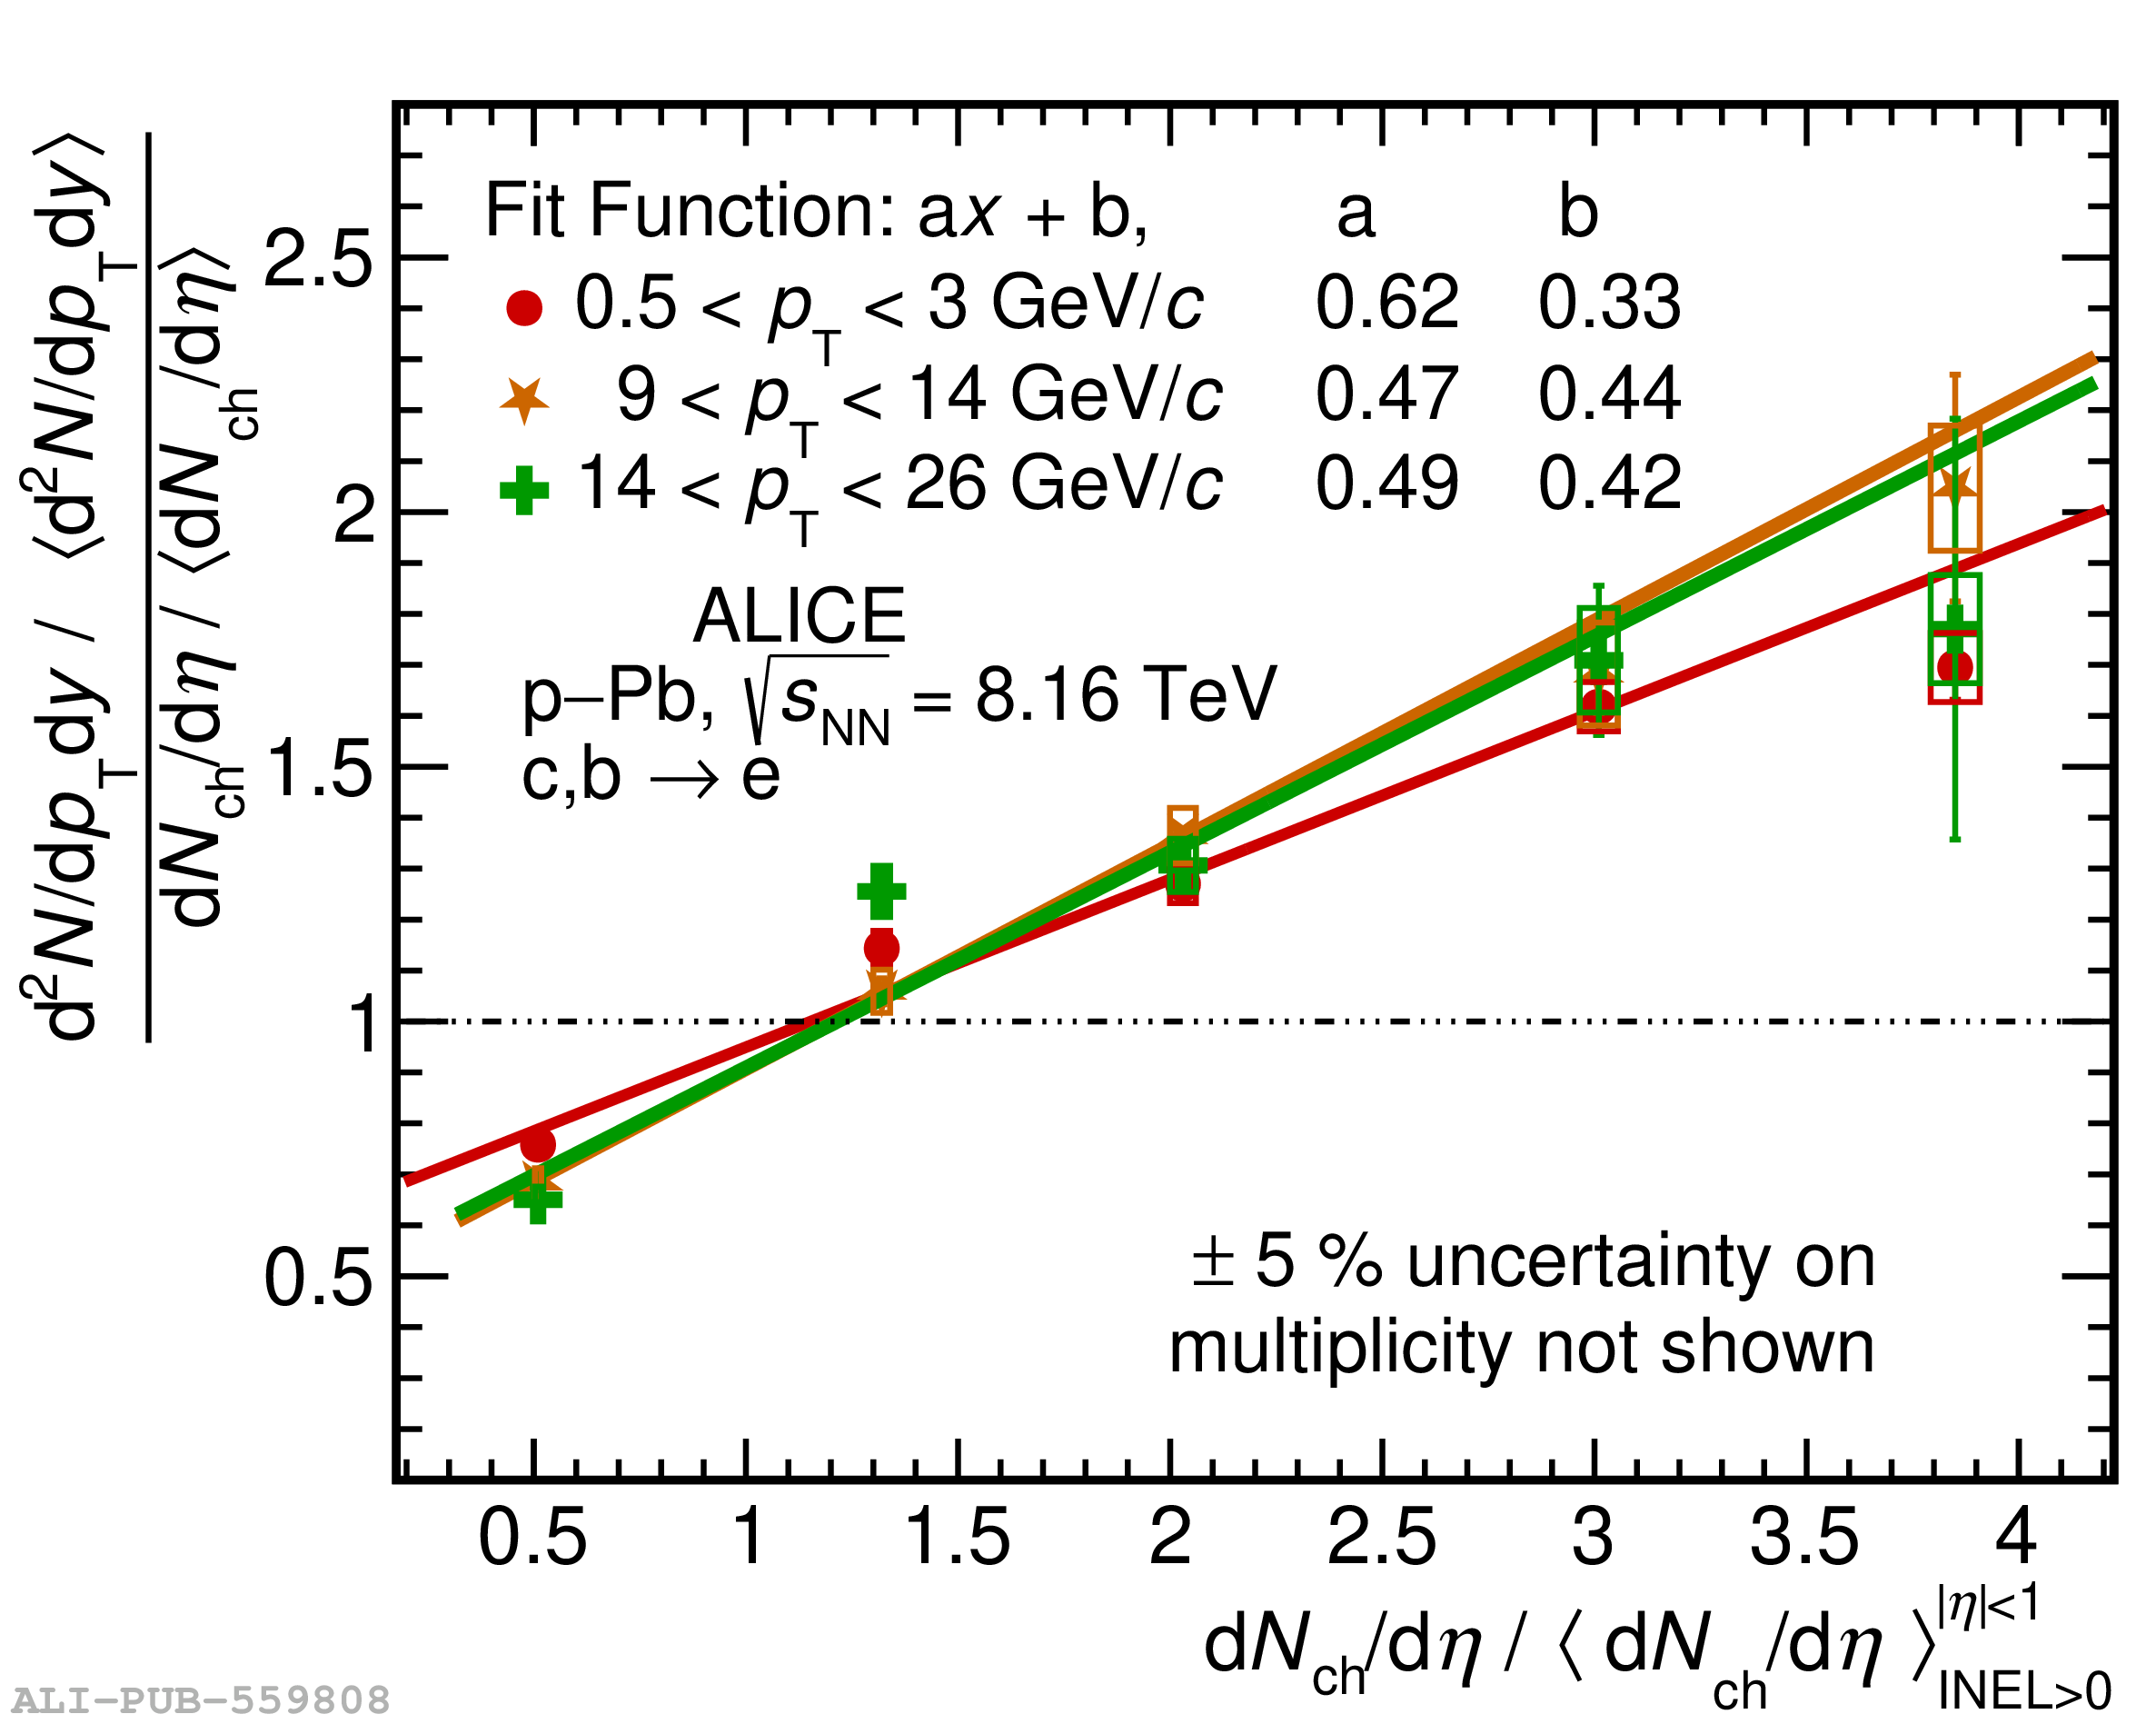 |
Figure 16
Self-normalised yields of electrons from heavy-flavour hadron decays as a function of self-normalised charged-particle pseudorapidity density at midrapidity measured in \pPb collisions at \sqrtsNN $= 8.16 \rm TeV$ compared with EPOS 2.592 without-hydrodynamics in two \pt intervals 0.5 $< \pt <$ 3 \GeVc and 3 $< \pt <$ 6 \GeVc. The width of the band is the statistical uncertainty from EPOS simulations. The bottom panel shows the ratio of data with respect to the MC predictions. The vertical bars correspond to the propagated statistical uncertainties from the data and the MC predictions, and the boxes correspond to systematical uncertainties from the data. | 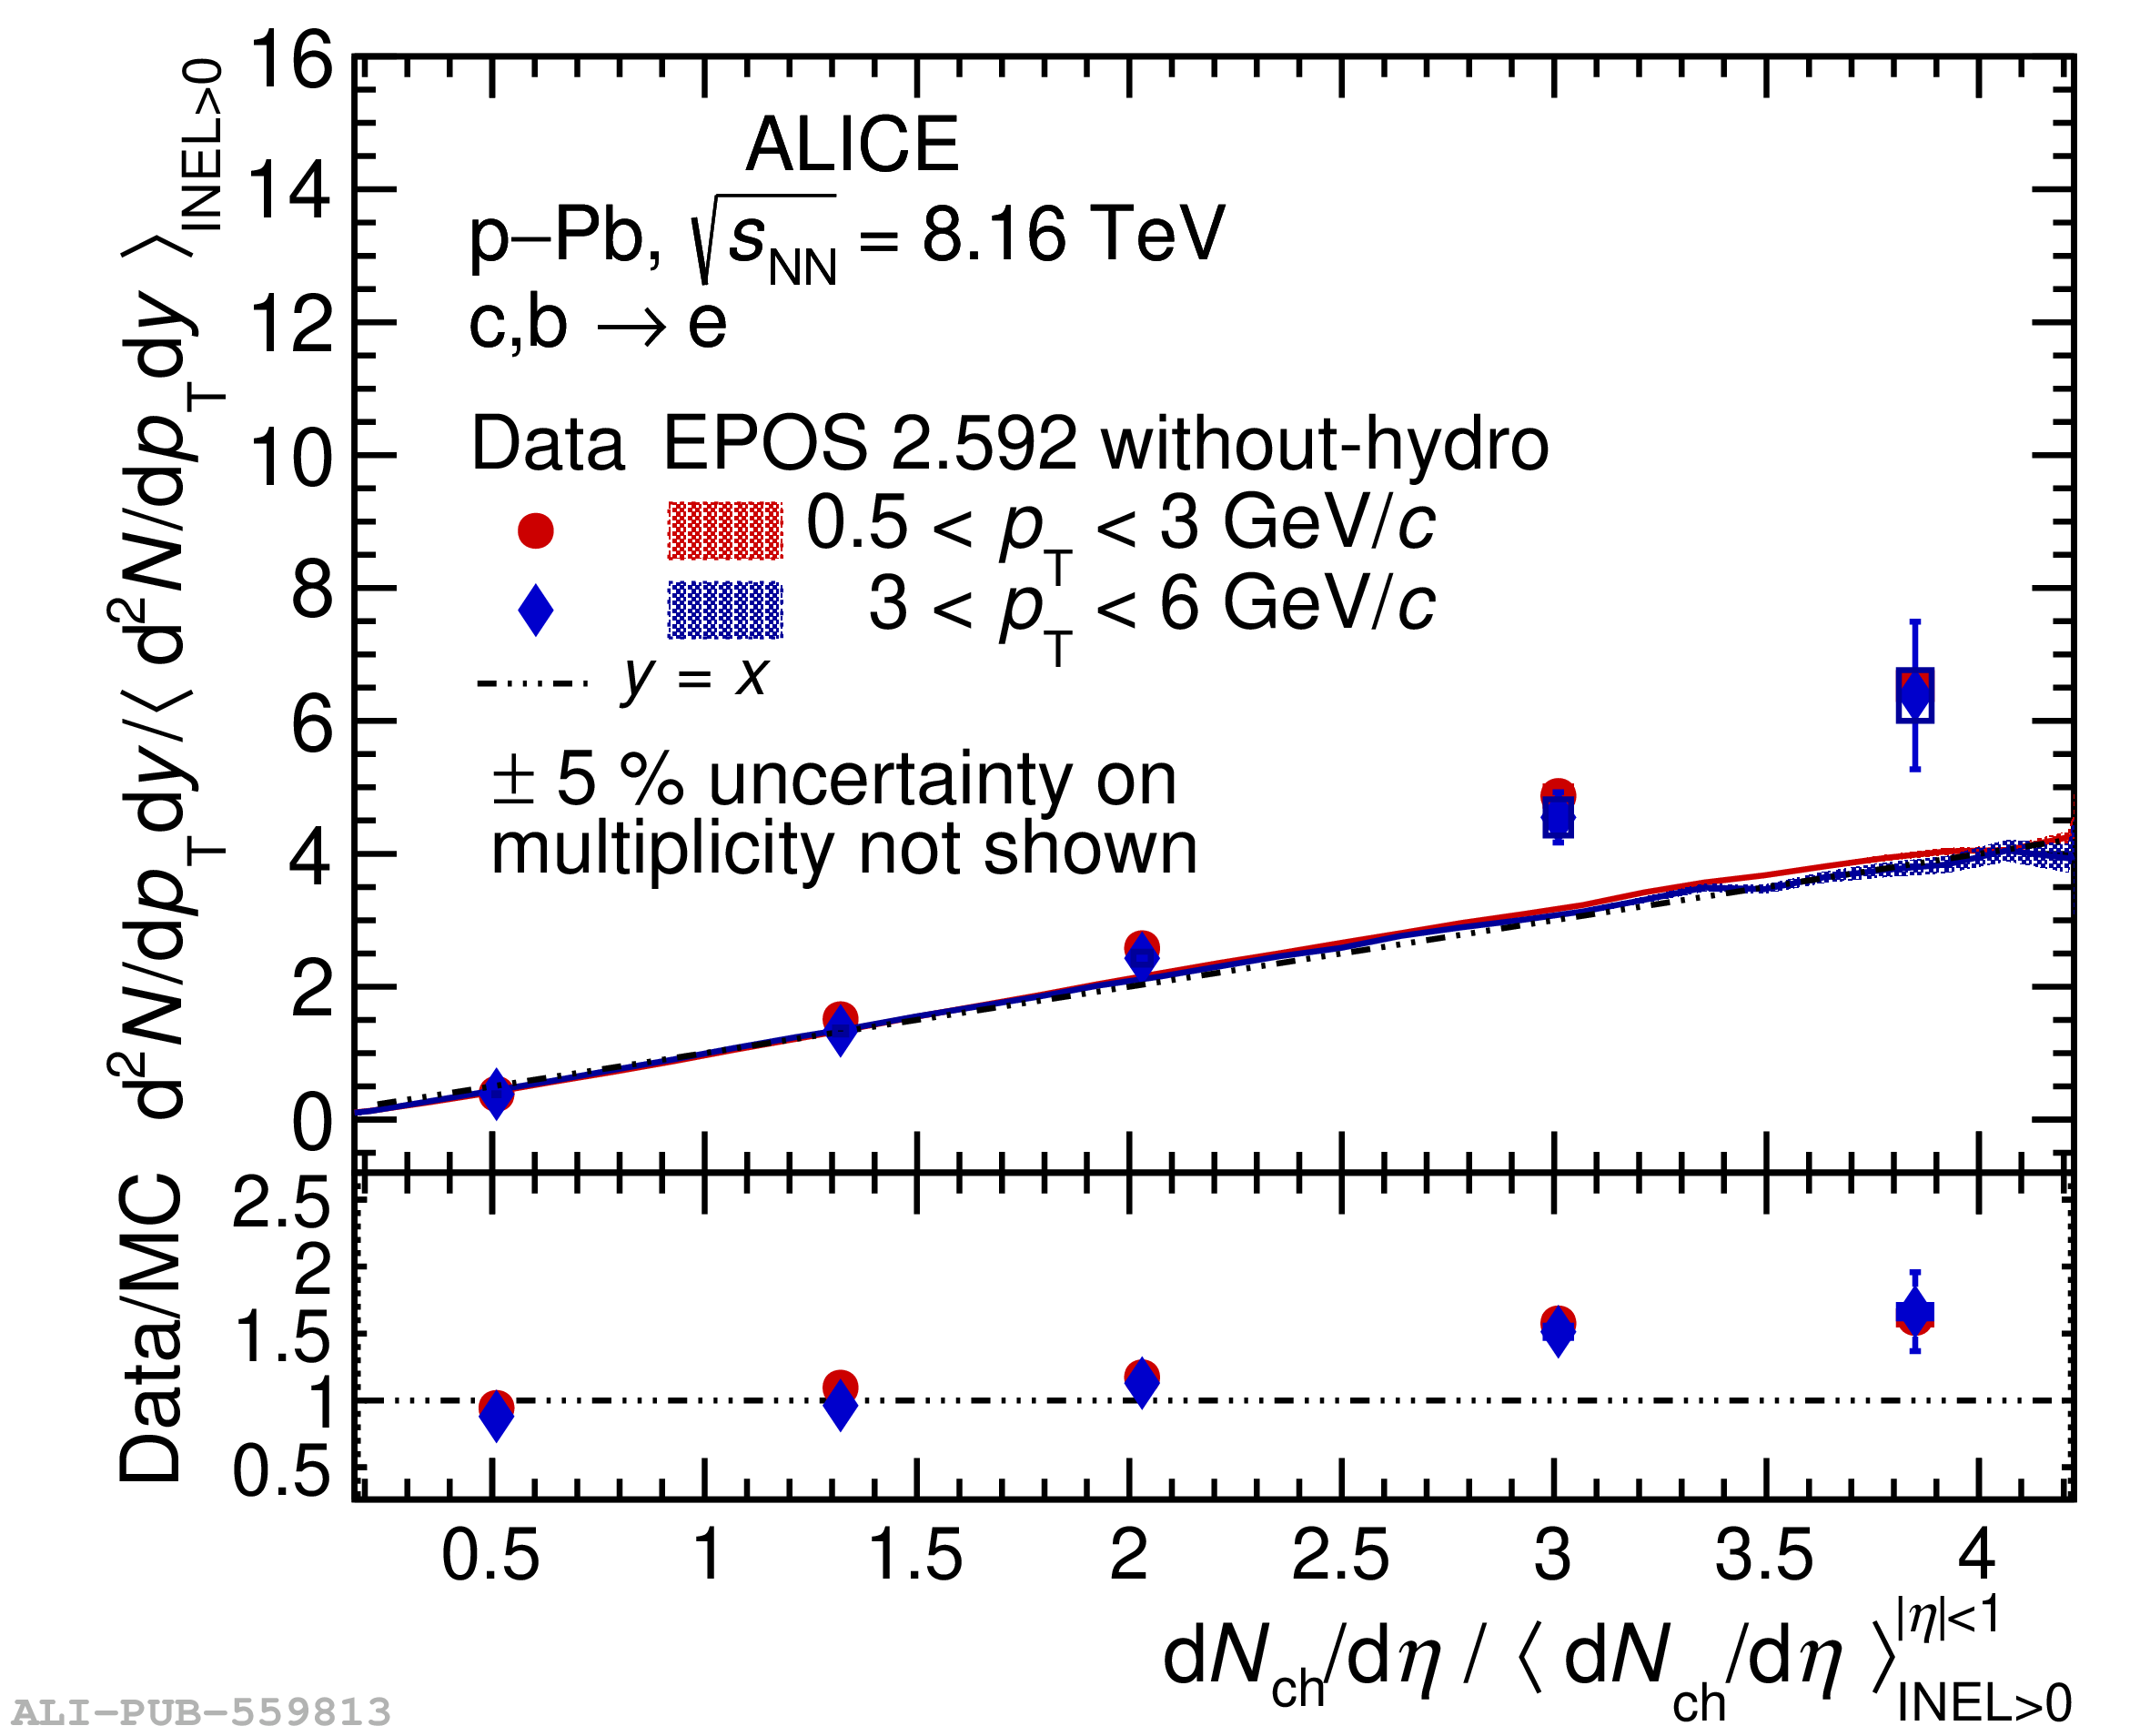 |
Figure 17
Self-normalised yields of electrons from heavy-flavour hadron decays measured in \pPb collisions at \sqrtsNN $= 8.16 \rm TeV$ for different \pt intervals compared with self-normalised yields of D mesons in \pPb collisions at \sqrtsNN $= 5.02 \rm TeV$. The position of the points for \pPb collisions at \sqrtsNN $= 5.02 \rm TeV$ on the $x$-axis are shifted horizontally by $\rm \delta x$ to improve the visibility. |  |