Comparison of the self-normalised yield of electrons from heavy-flavour hadron decays as a function of multiplicity measured in \pp collisions at \sqrts $= 13 \rm TeV$ for different \pt intervals with PYTHIA 8.2 Monash tune (left) and PYTHIA 8.2 with CR mode 2 (right). The width of the band is the statistical uncertainty from PYTHIA simulations. The bottom panel shows the ratio of data with respect to the MC predictions. The vertical bars correspond to the propagated statistical error from the data and the MC predictions, and the boxes correspond to systematical uncertainties from the data. | 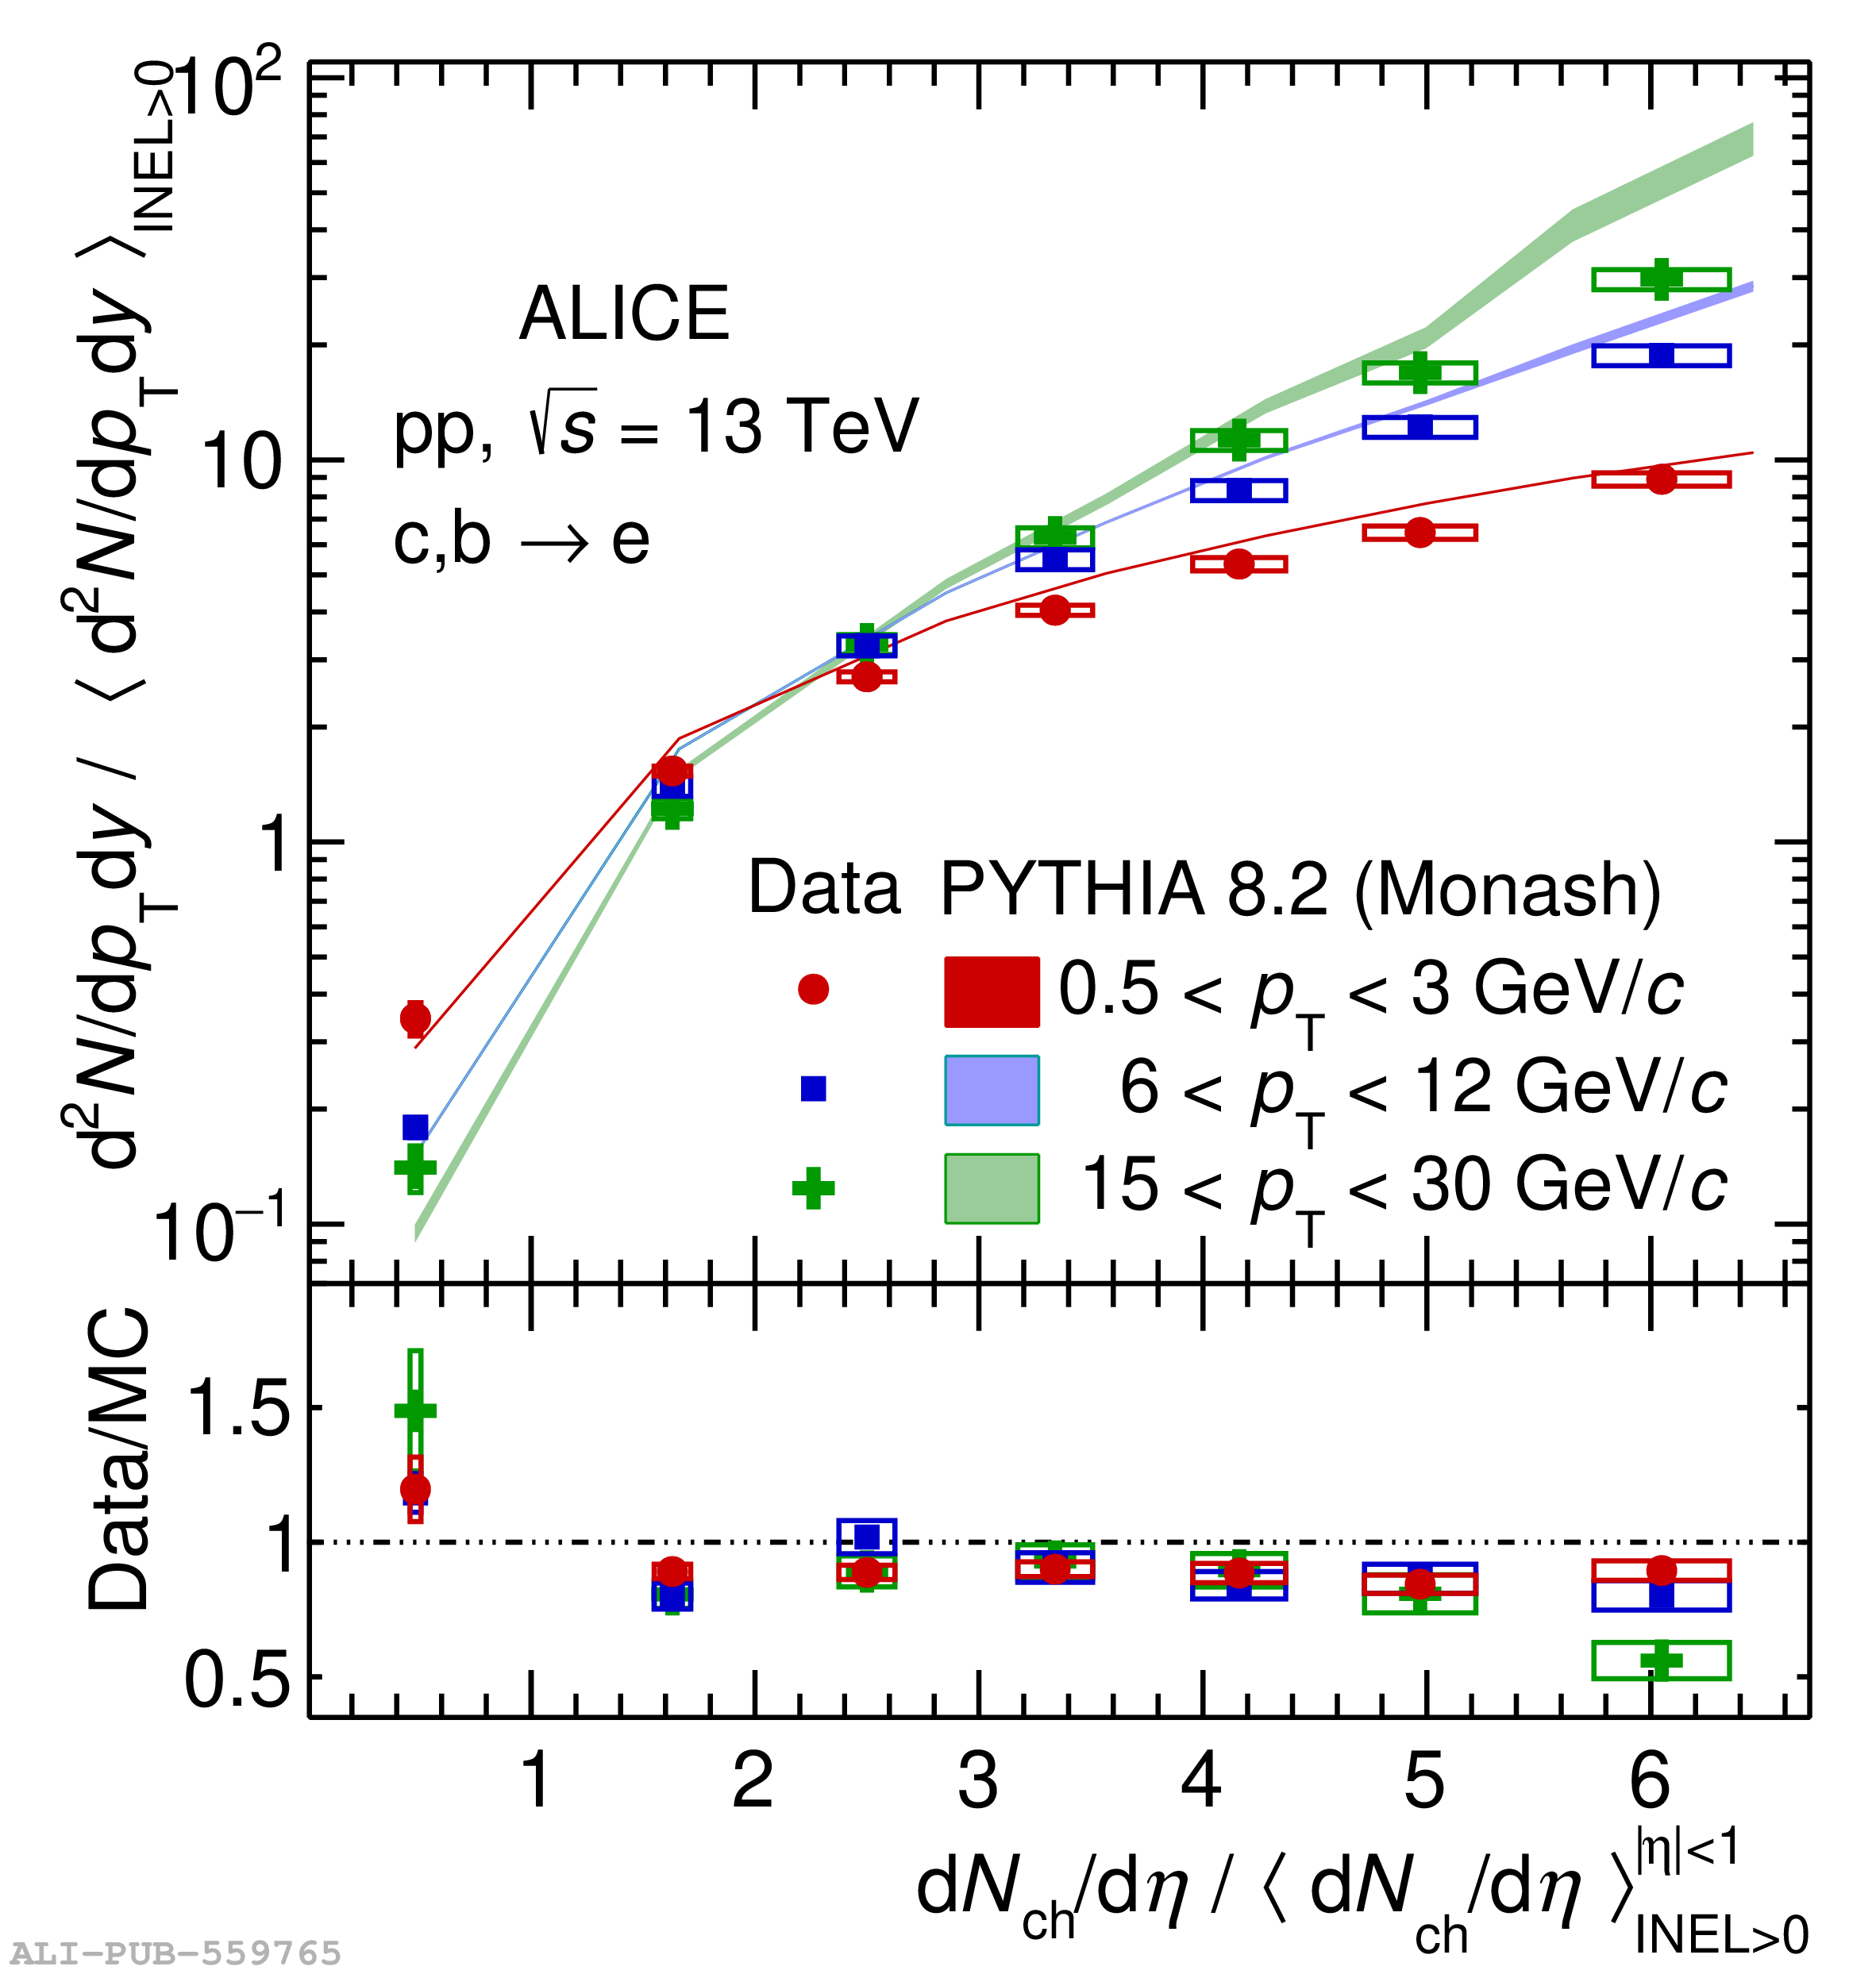 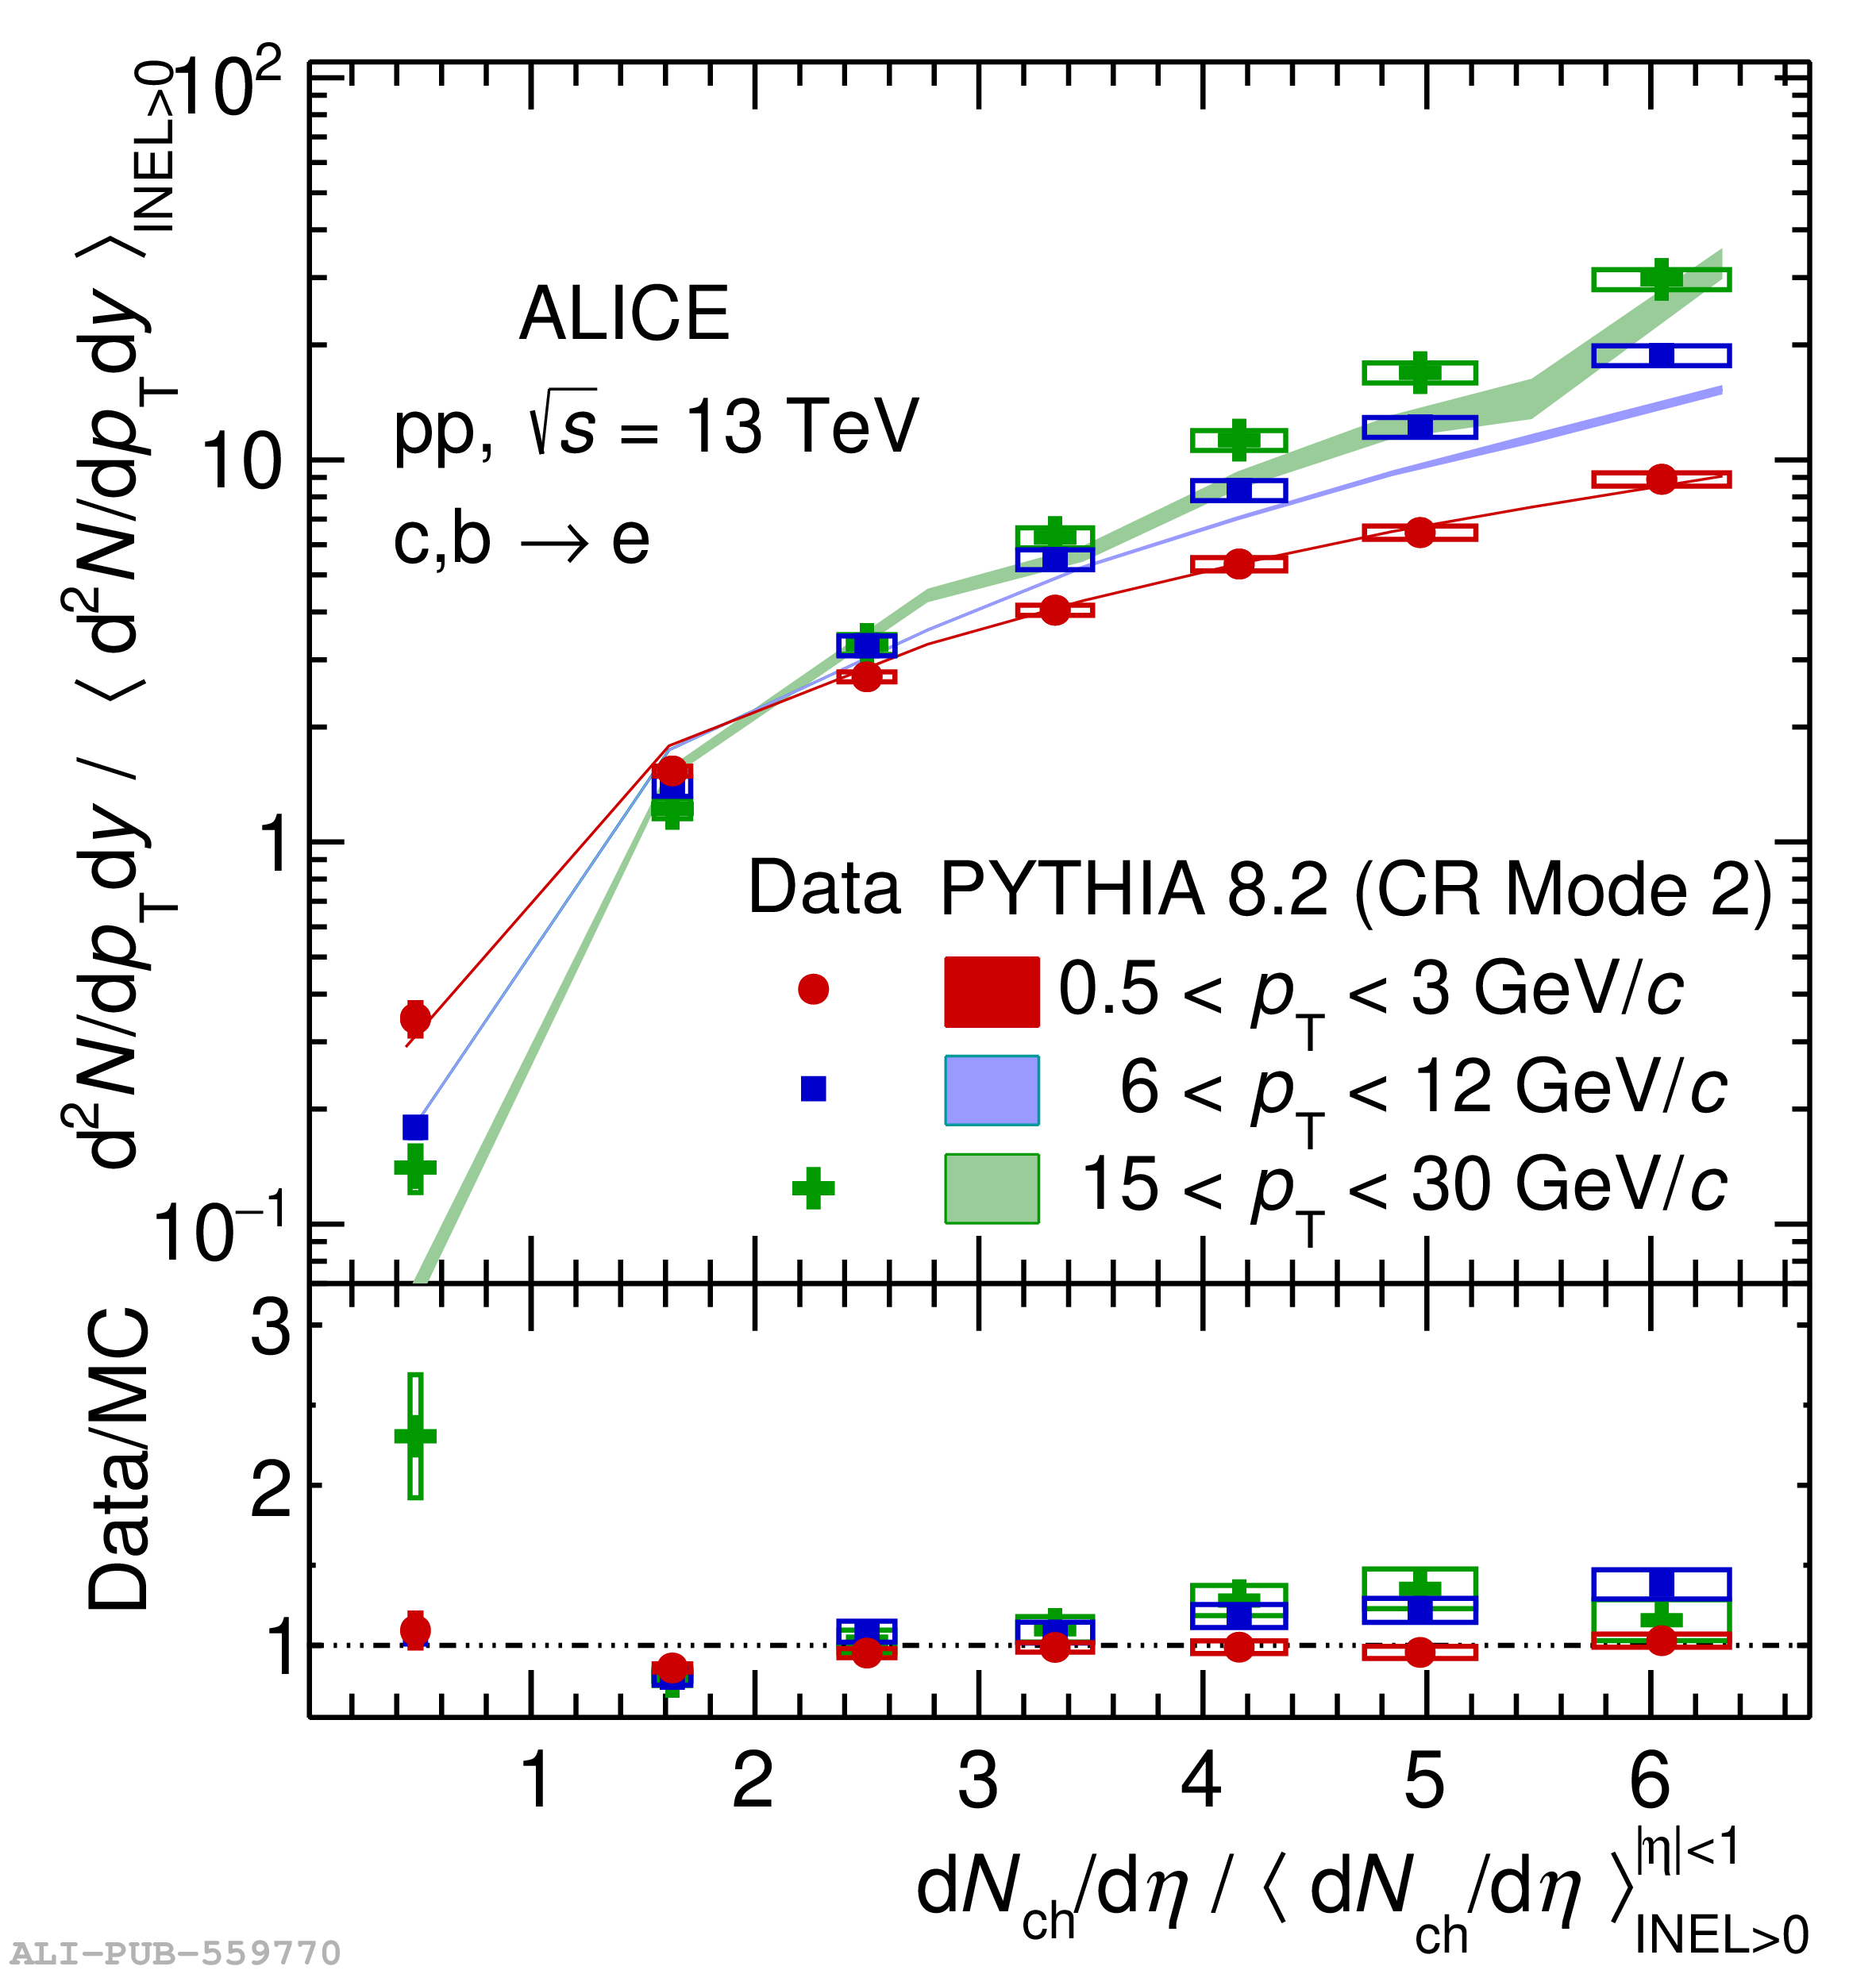 |