Distributions of the shower shape parameter $\shshlo$ of neutral clusters in data and simulations as used in this analysis. The different panels show different neutral cluster \pt\ intervals. All distributions are normalised to the integral. Data are shown as black histograms and simulations, PYTHIA 6 jet-jet $+$ $\gamma$-jet events, with GEANT3 default settings in blue. The red histograms are also simulations based on GEANT3, but tuned to reproduce the cross-talk observed in the EMCal electronics. |  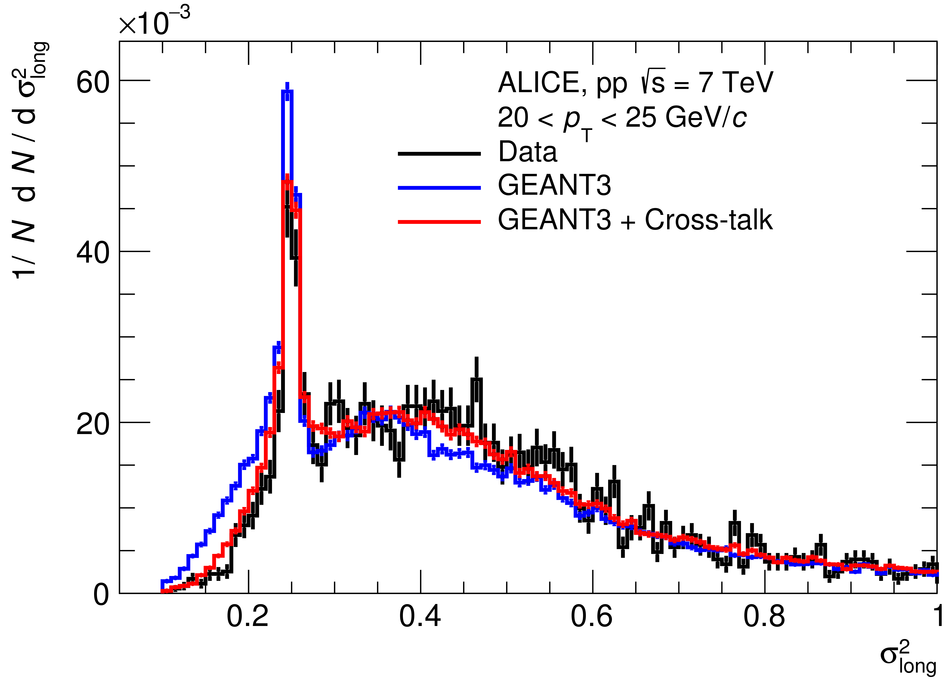 |