[Color online] Invariant mass distributions of cluster pairs for $\pT>1.7 \GeVc$ in the $\pi^0$ (left) and $\eta$ (right) mass region after calibration with per-channel $\pi^0$ peak equalization. For the $\pi^0$ data, the solid curve shows the fitting function using thesum of the Crystal Ball and a polynomial function. For the $\eta$ data, the solid curve shows the fit function composed of a Gaussian and a polynomial function. The dashed lines represent the background contributions in both plots. | 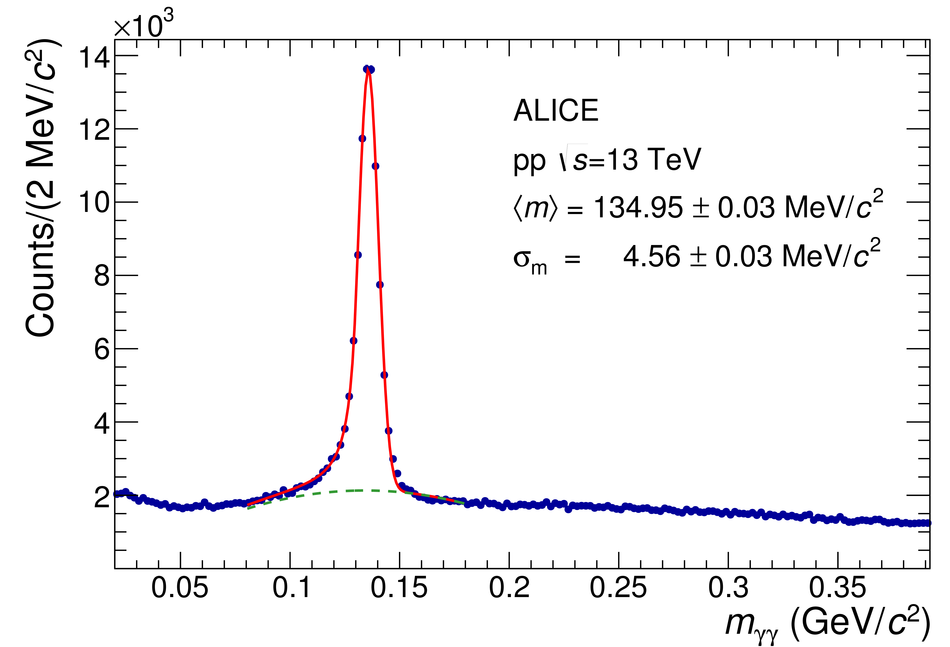 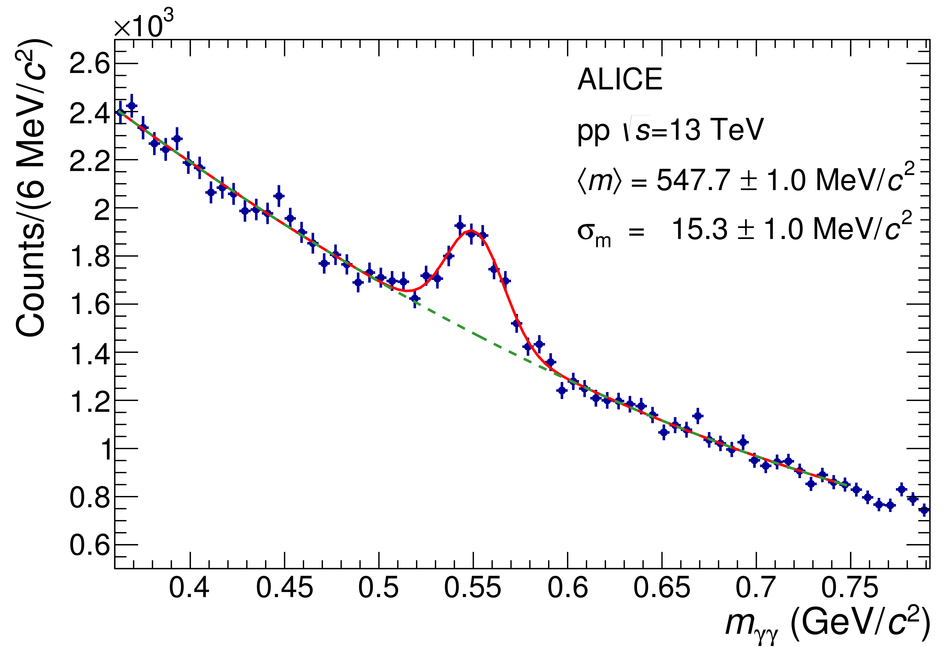 |