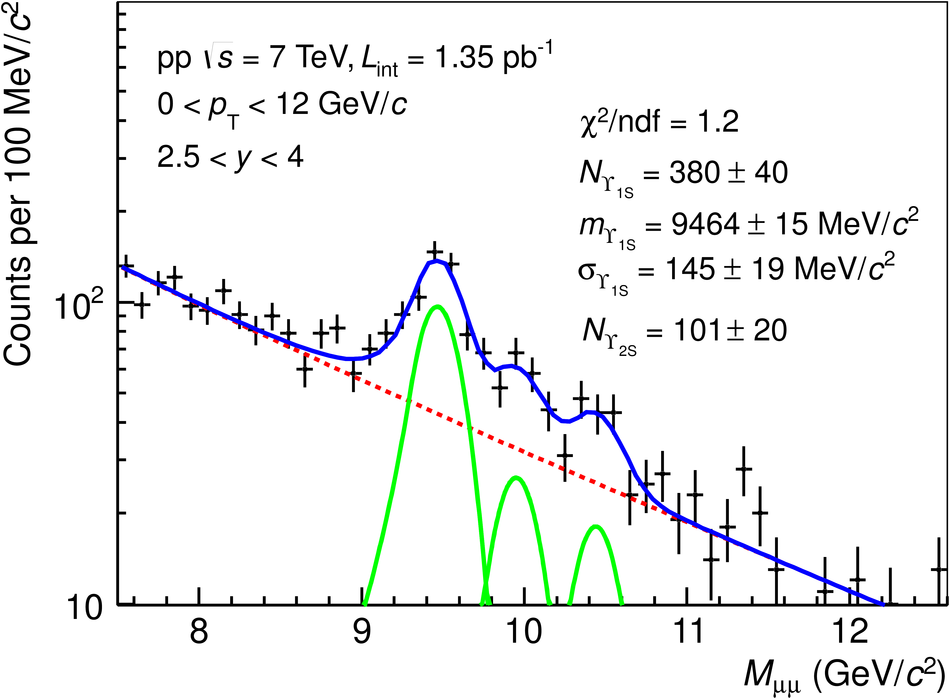
Dimuon invariant mass distribution in the region of charmonia (top) and bottomonia (bottom). Solid (dotted) lines correspond to signal (background) fit functions. The sum of the various fit functions is also shown as a solid line. For the J/$\psi$ and $\psi^\prime$, a combination of two extended Crystal Ball functions is used for the signal and a variable width Gaussian function is used for the background. For the $\rm\Upsilon$ resonances, a combination of extended Crystal Ball functions is used for the signals and two power law functions for the background. |  |