Distributions of the invariant mass for $\Dzero$ (upper panels) and $\Dplus$ (central panels) candidates and of the mass difference for $\Dstar$ candidates (lower panels) in the two $\Delta\varphi$ intervals used in the event plane method, for Pb-Pb collisions in the 30-50% centrality class. The rapidity interval is $|y|< y_{\rm fid}$ (see text for details). For each meson species three $\pt$ intervals are shown, along with the fits used to extract the signal yield. The definition of the two $\Delta\varphi$ intervals is sketched in the top-left panel. | 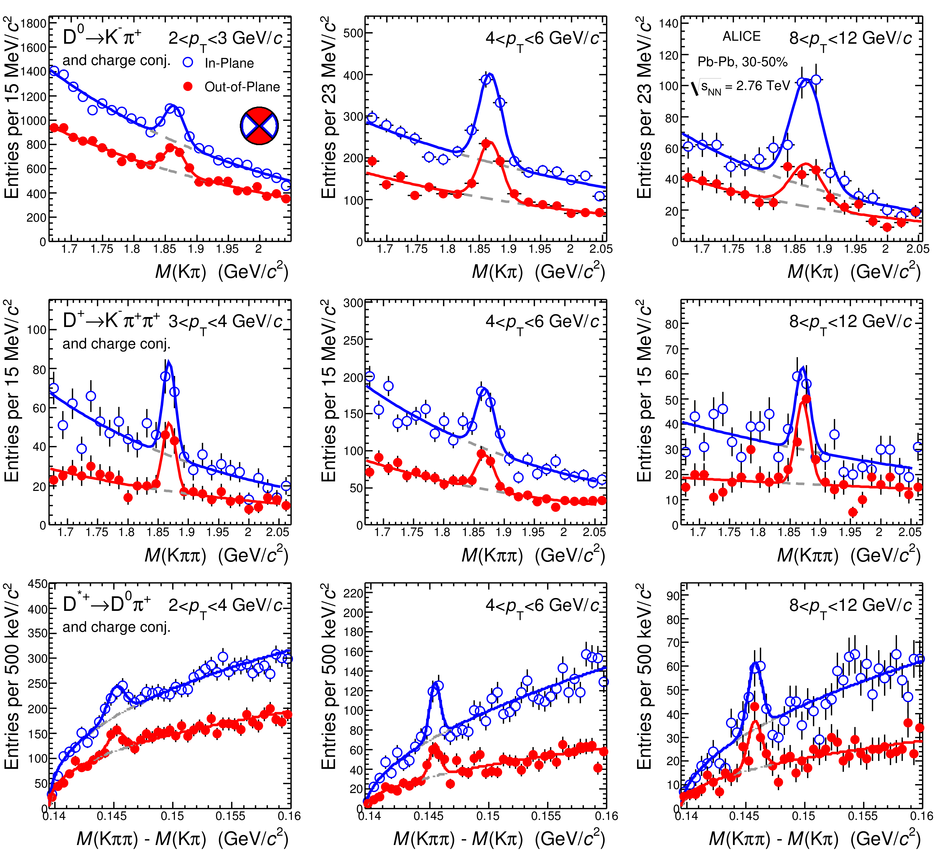 |