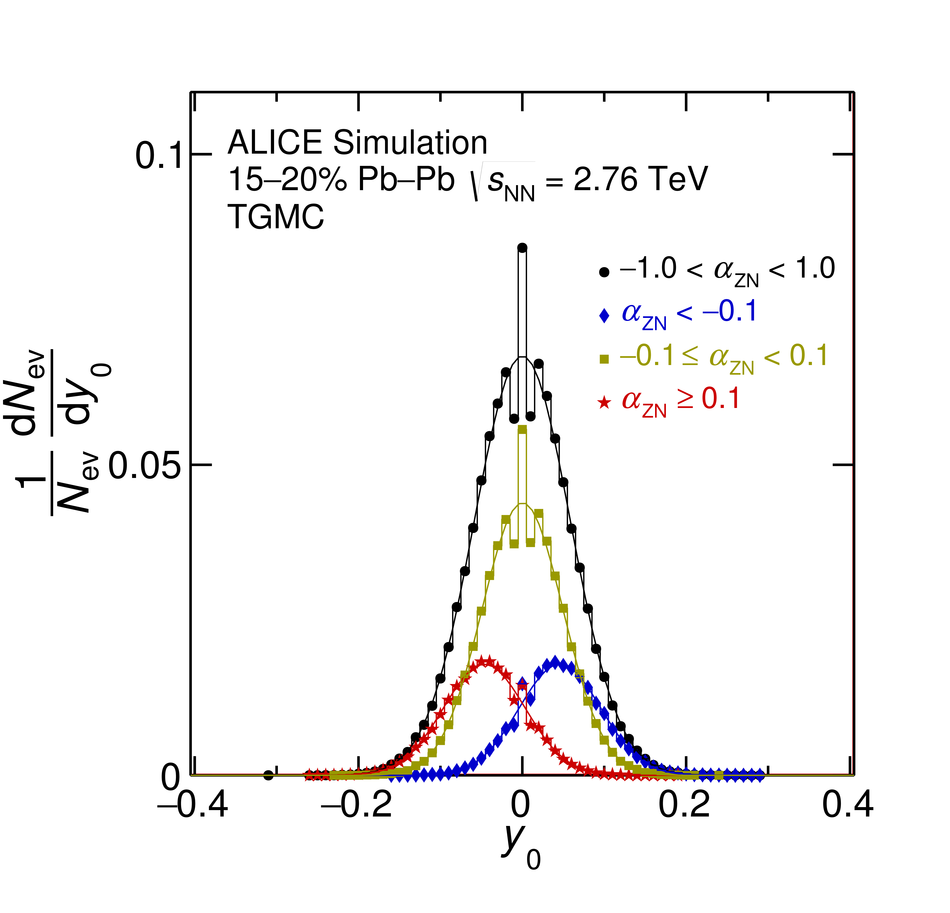
The distribution of rapidity-shifts for the events from the three different regions of measured asymmetry shown in Fig. ???. Determination of $y_{\rm 0}$ uses the difference in number of nucleons. For small values of this difference, the changes in values near $y_0 = 0$ are discrete, and are smeared into a continuous distribution as $y_{\rm 0}$ increases. |  |