Left: \e /\pai ratio as function of \pT measured in NSD \pPb collisions at -1.365 $< y_{\mathrm{cms}}< $ 0.435 at \spPb The statistical uncertainties are shown as vertical error bars. The systematic uncertainties are represented as boxes. For comparison, also the \e /\pai ratios measured in \unit[7]{TeV} pp collisions with ALICE , in d-Au collisions at \sNNR with PHENIX , and in \pAu and \pBe collisions at \sNNSPS with TAPS/CERES are shown, as well as the ratio where the \e yield is obtained via \mT scaling from the measured \pPb \pai yield. Right: Ratio of the measured \e /\pai ratio to the one obtained via \mT scaling. | 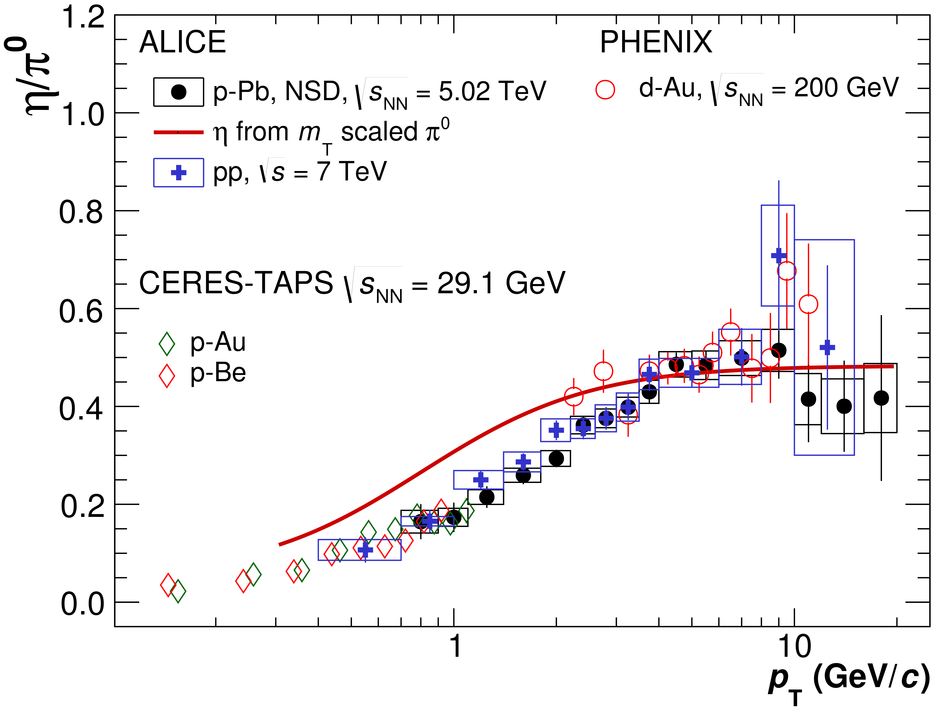 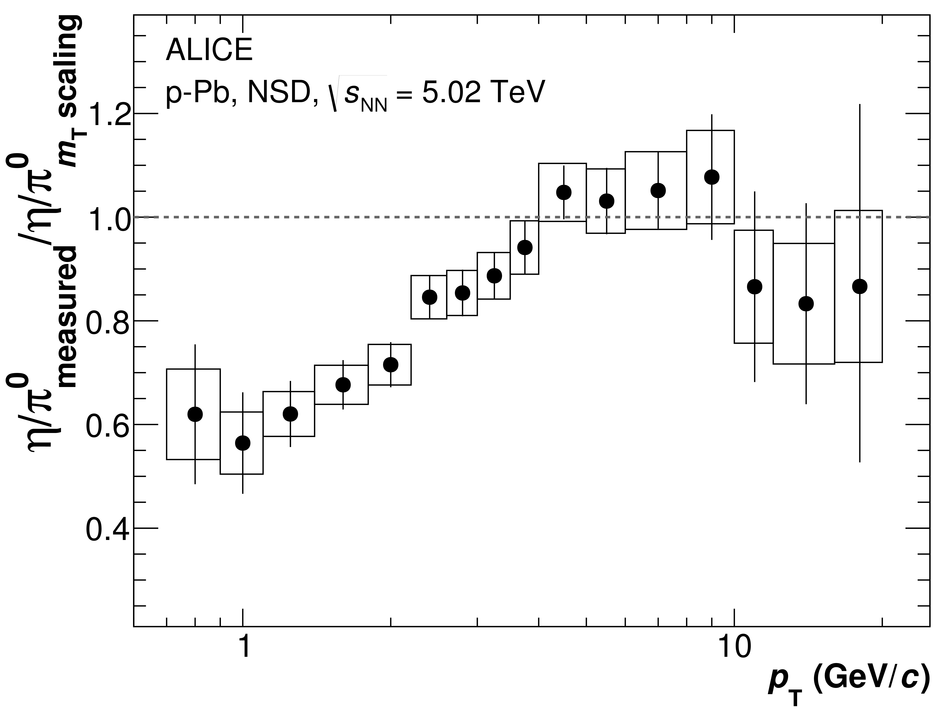 |