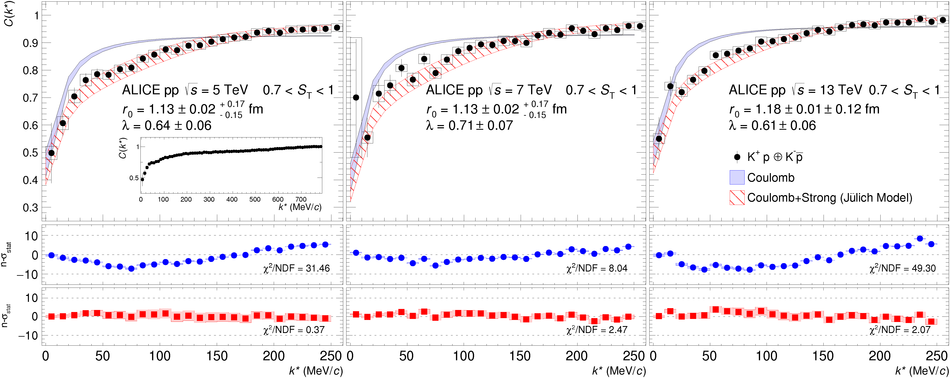
The study of the strength and behaviour of the antikaon-nucleon ($\mathrm{\overline{K}N}$) interaction constitutes one of the key focuses of the strangeness sector in low-energy Quantum Chromodynamics (QCD). In this letter a unique high-precision measurement of the strong interaction between kaons and protons, close and above the kinematic threshold, is presented. The femtoscopic measurements of the correlation function at low pair-frame relative momentum of (K$^+$ p $\oplus$ K$^-$ $\overline{\mathrm{p}}$) and (K$^-$ p $\oplus$ K$^+$ $\overline{\mathrm{p}}$) pairs measured in pp collisions at $\sqrt{s}$ = 5, 7 and 13 TeV are reported. A structure observed around a relative momentum of 58 MeV/$c$ in the measured correlation function of (K$^-$ p $\oplus$ K$^+$ $\overline{\mathrm{p}}$) with a significance of 4.4. $\sigma$ constitutes the first experimental evidence for the opening of the $(\mathrm{\overline{K}^0 n} \oplus \mathrm{K^0 \overline{n}})$ isospin breaking channel due to the mass difference between charged and neutral kaons. The measured correlation functions have been compared to J\"{u}lich and Kyoto models in addition to the Coulomb potential. The high-precision data at low relative momenta presented in this work prove femtoscopy to be a powerful complementary tool to scattering experiments and provide new constraints above the $\mathrm{\overline{K}N}$ threshold for low-energy QCD chiral models.
Phys. Rev. Lett. 124 (2020) 092301
HEP Data
e-Print: arXiv:1905.13470 | PDF | inSPIRE


