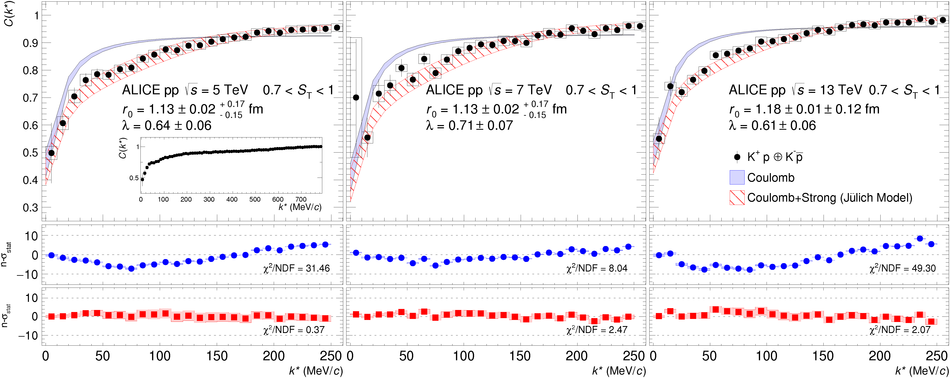
(\kp p \opl\ \km \ap) correlation functions obtained from pp collisions at \s = 5 TeV (left), 7 TeV (middle) and 13 TeV (right). The inset shows the correlation function evaluated for pp collisions at \s = 5 TeV in a wider \kstar interval. The measurement is shown by the black markers, the vertical lines and the boxes represent the statistical and systematic uncertainties respectively. Bottom panels represent comparison with models as described in the text. |  |