Azimuthal correlation at $\sqrt{s}=0.9$ TeV (left) and $\sqrt{s}=7$ TeV (right). Leading-track: 6.0 $< p_{T,LT}< $ \unit[10.0]{GeV/$c$}. For visualization purposes the $\Delta \phi$ axis is not centered around 0. Shaded area in upper plots: systematic uncertainties. Shaded areas in bottom plots: sum in quadrature of statistical and systematic uncertainties. Horizontal error bars: bin width. | 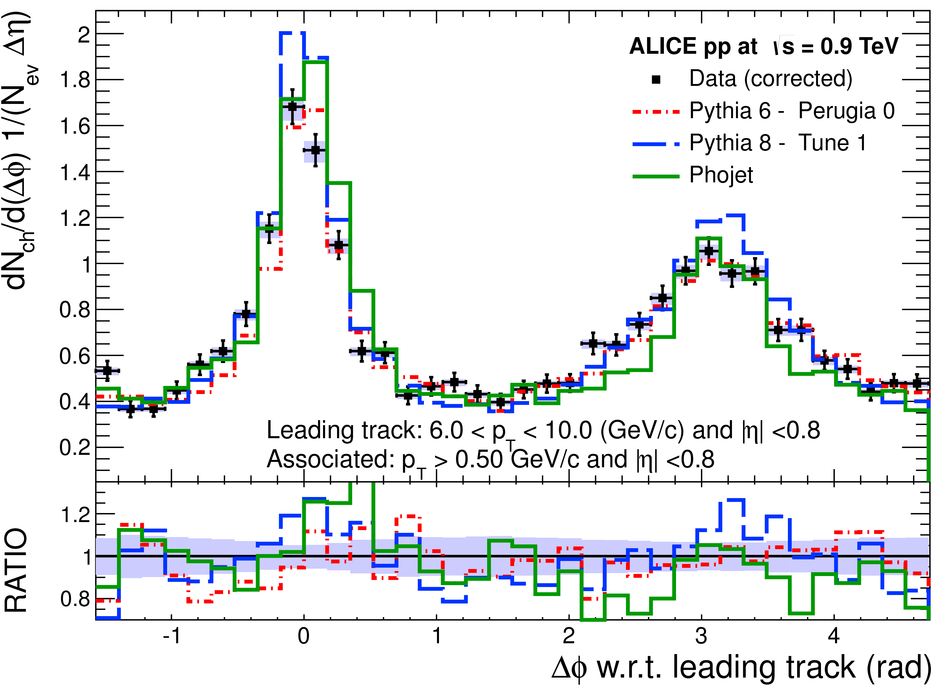 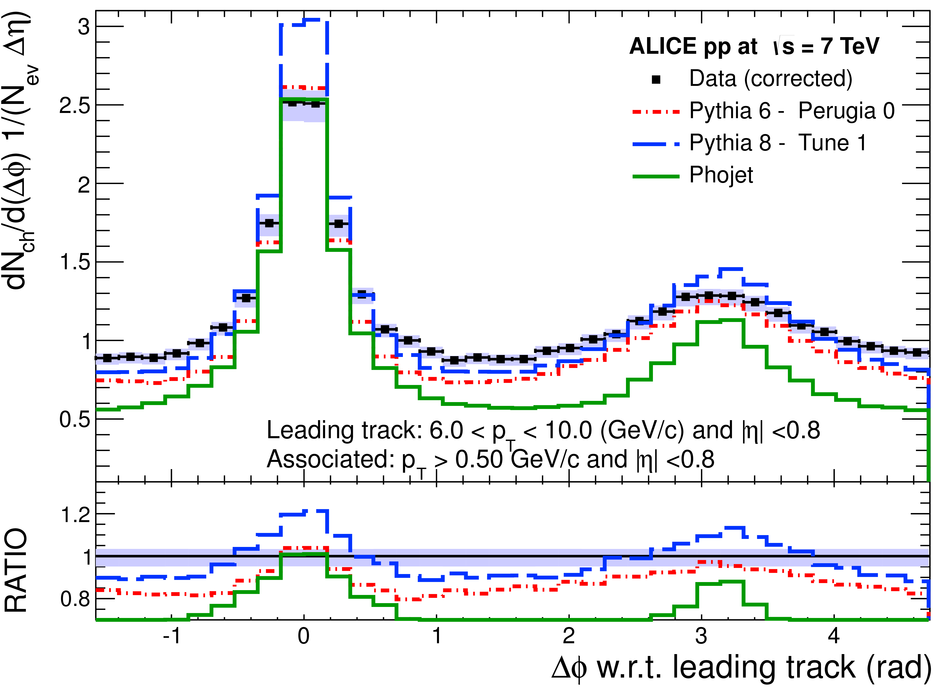 |