The measurement of the mass differences for systems bound by the strong force has reached a very high precision with protons and anti-protons. The extension of such measurement from (anti-)baryons to (anti-)nuclei allows one to probe any difference in the interactions between nucleons and anti-nucleons encoded in the (anti-)nuclei masses. This force is a remnant of the underlying strong interaction among quarks and gluons and can be described by effective theories, but cannot yet be directly derived from quantum chromodynamics. Here we report a measurement of the difference between the ratios of the mass and charge of deuterons and anti-deuterons, and $^{3}{\rm He}$ and $^3\overline{\rm He}$ nuclei carried out with the ALICE (A Large Ion Collider Experiment) detector in Pb-Pb collisions at a centre-of-mass energy per nucleon pair of 2.76 TeV. Our direct measurement of the mass-over-charge differences confirm CPT invariance to an unprecedented precision in the sector of light nuclei. This fundamental symmetry of nature, which exchanges particles with anti-particles, implies that all physics laws are the same under the simultaneous reversal of charge(s) (charge conjugation C), reflection of spatial coordinates (parity transformation P) and time inversion (T).
Nature Physics 11 (2015) 811-814
e-Print: arXiv:1508.03986 | PDF | inSPIRE
CERN-PH-EP-2015-035
Figure 1
Examples of squared mass-over-charge ratio distributionsfor deuterons (left) and $\rm{^{3}He}$ (right) in selected rigidity intervals. Particle and anti-particle spectraare in the top and bottom plots, respectively. The fit function (red curve)also includes, for the (anti-)deuteron case, an exponential term to describe the background In the rigidity intervals shown here the background is about 4% for(anti-)deuterons, while it is 0.7% for $^3{\rm He}$ and $^3\overline{\rm He}$.
| 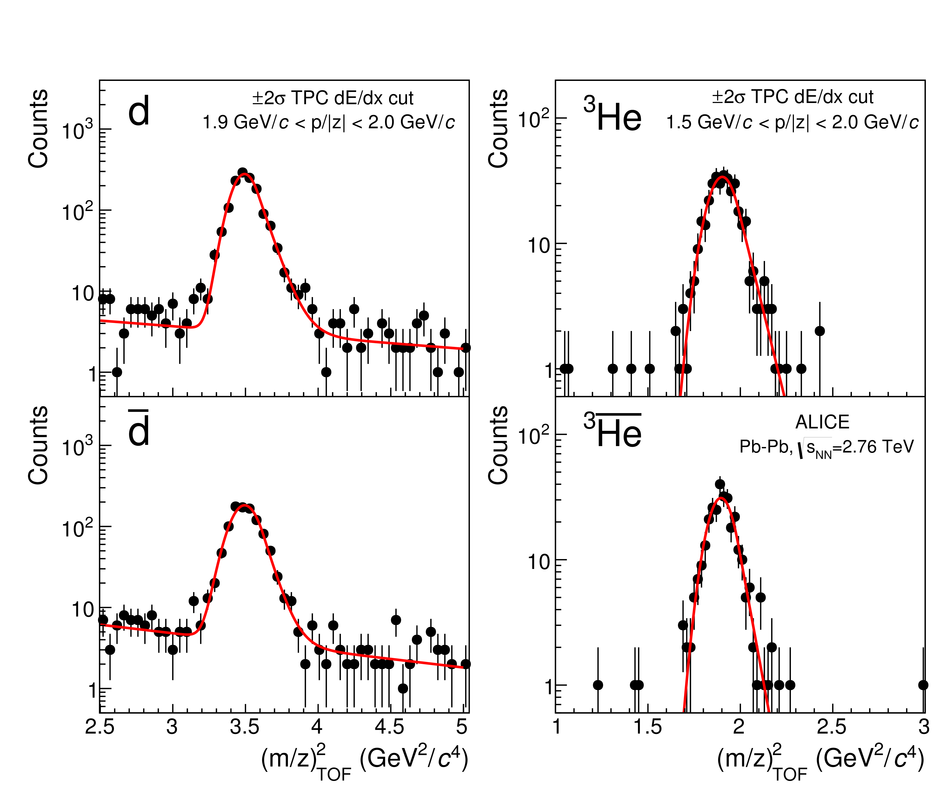 |
Figure 2
The $d-\overline{d}$ (top) and $^3{\rm He}-^3\overline{\rm He}$ (bottom) mass-over-charge ratio difference measurements as a function of the particle rigidity. Vertical bars and open boxes show the statistical and the uncorrelated systematic uncertainties (standard deviations), respectively. Both are taken into account to extract the combined result in the full rigidity range, together with the correlated systematic uncertainty, which is shown as a box with tilted lines. Also shown are the $1\sigma$ and $2\sigma$ bands around the central value, where $\sigma$ is the sum in quadrature of the statistical and systematic uncertainties. | 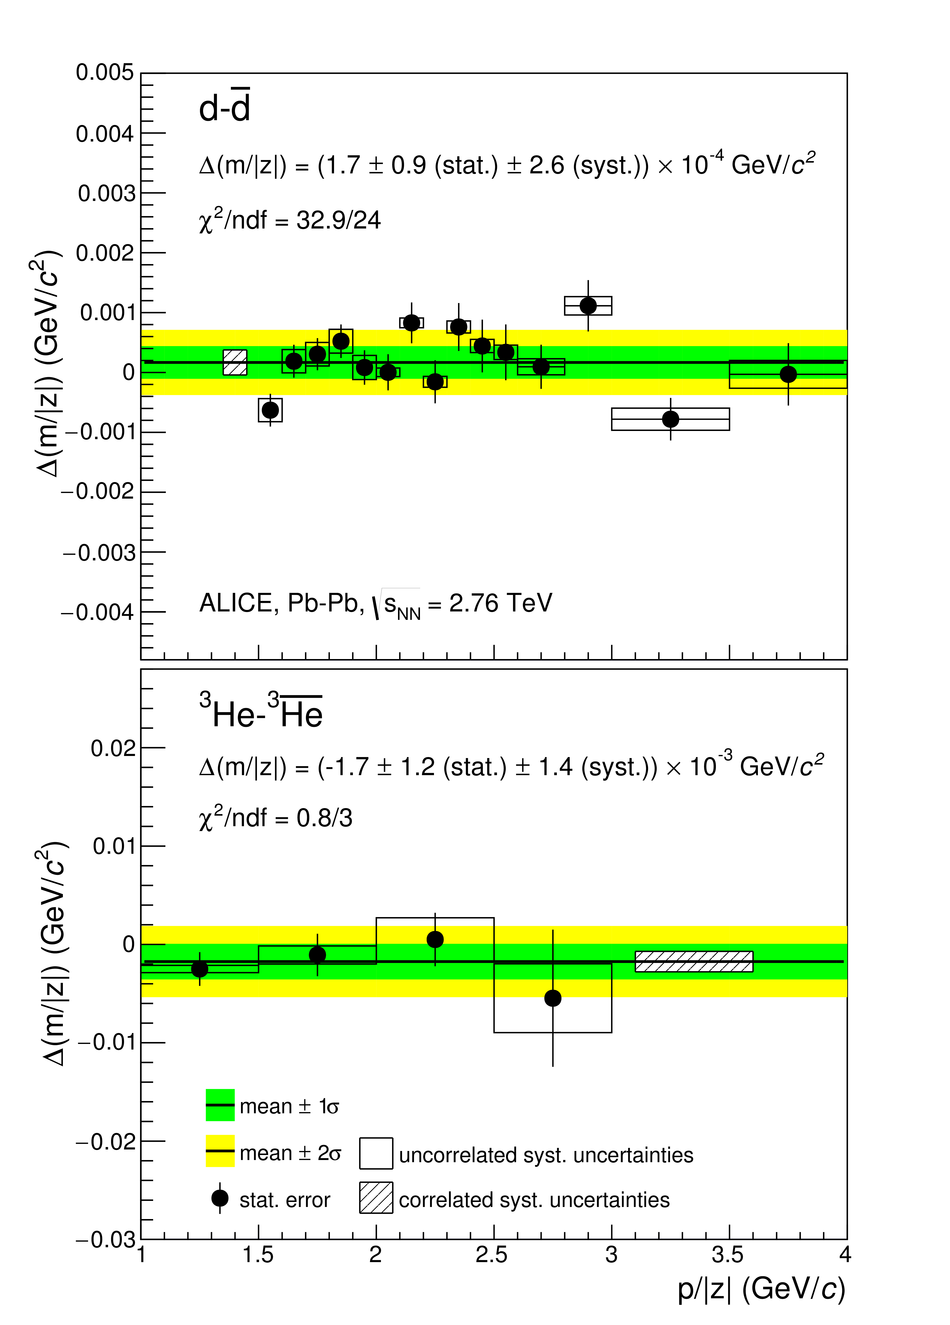 |
Figure 3
The ALICE measurements for $d-\overline{d}$ (top) and $^3{\rm He}-^3\overline{\rm He}$ mass-over-charge ratio differences compared with CPT invariance expectation (dotted lines) andexisting mass measurements MAS65, DOR65 and ANT71 (left panel). The inset shows the ALICE results on a finer $\Delta(m/z)/(m/z)$ scale. The right panel shows our determination of the binding energy differences compared with direct measurements from DEN71 and KES99. Error bars represent the sum in quadrature of the statistical and systematic uncertainties (standard deviations). | 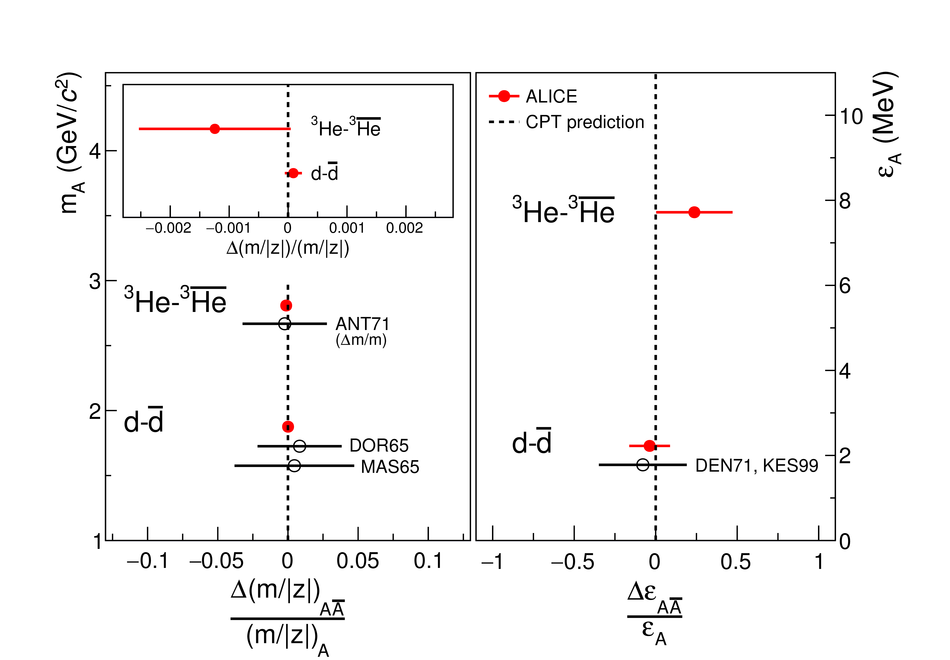 |