The ALICE measurements for $d-\overline{d}$ (top) and $^3{\rm He}-^3\overline{\rm He}$ mass-over-charge ratio differences compared with CPT invariance expectation (dotted lines) andexisting mass measurements MAS65, DOR65 and ANT71 (left panel). The inset shows the ALICE results on a finer $\Delta(m/z)/(m/z)$ scale. The right panel shows our determination of the binding energy differences compared with direct measurements from DEN71 and KES99. Error bars represent the sum in quadrature of the statistical and systematic uncertainties (standard deviations). | 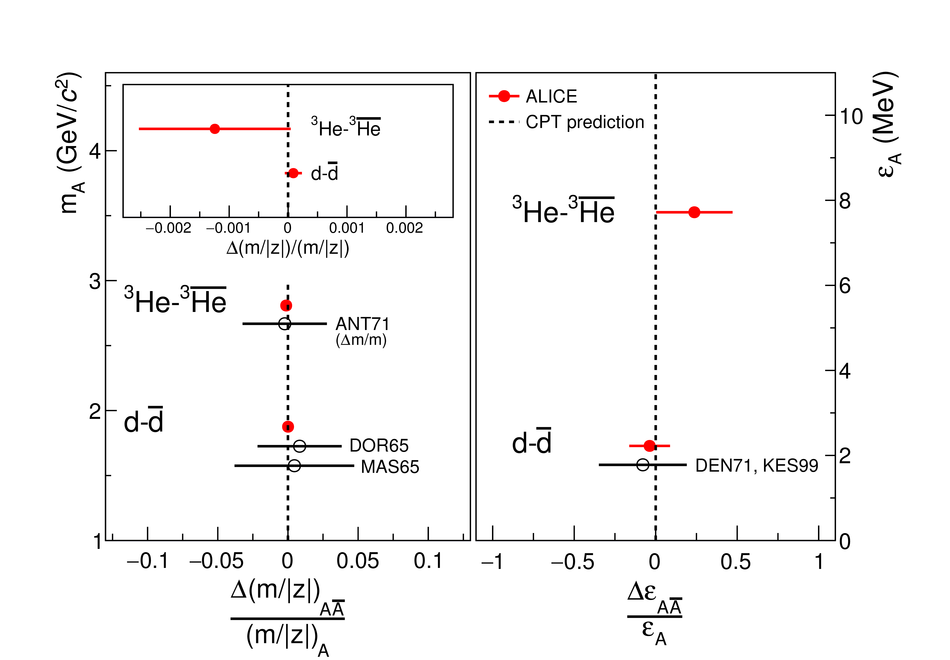 |