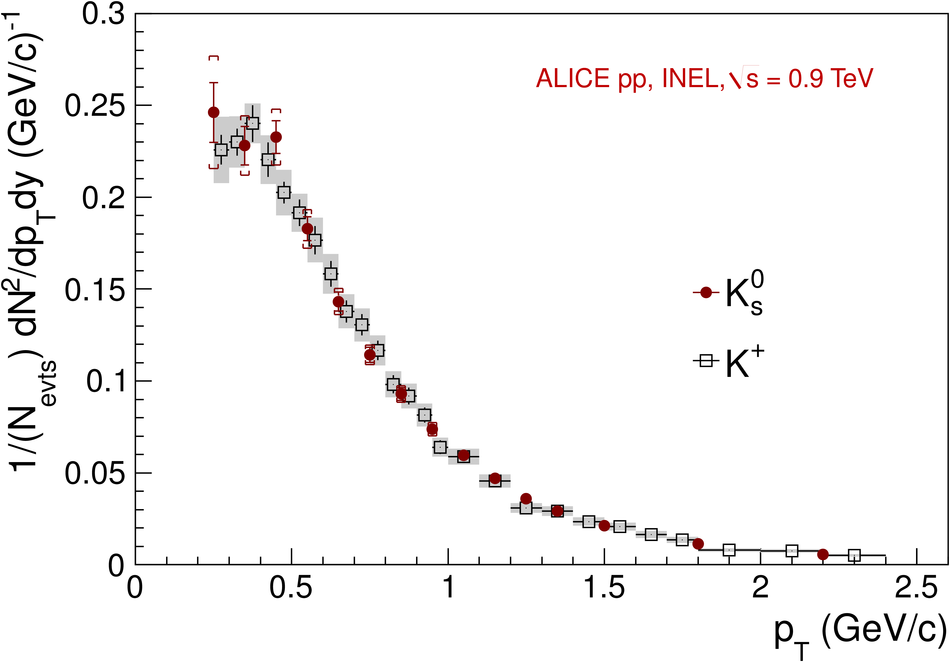
Comparison of the corrected yields as a function of $\pT$ for $\Kzs$ (circle) and charged kaons ($\mathrm{K^{+}}$) (open squares), identified via energy loss in the TPC and ITS, and via time of flight in the TOF The points are plotted at the centre of the bins The full vertical lines associated to the $\Kzs$ points, as well as the gray shaded areas associated to the $\mathrm{K^{+}}$ points, correspond to the statistical and systematic uncertainties summed in quadrature whereas the inner vertical lines contain only the statistical uncertainties (i.e. the number of reconstructed particles) and the systematics from the signal extraction. |  |