Correlation functions for identical pions from $pp$ collisions at $\sqrt{s}$ = 900 GeV (full dots) and those obtained from a simulation using PHOJET (open circles). Positive and negative pion pairs were combined The three columns represent collisions with different charged-particlemultiplicities $M$; the transverse momentum of pion pairs $\kt $(GeV/c) increases from top to bottom The lines going through the points represent the Gaussian fits discussed inthe text | 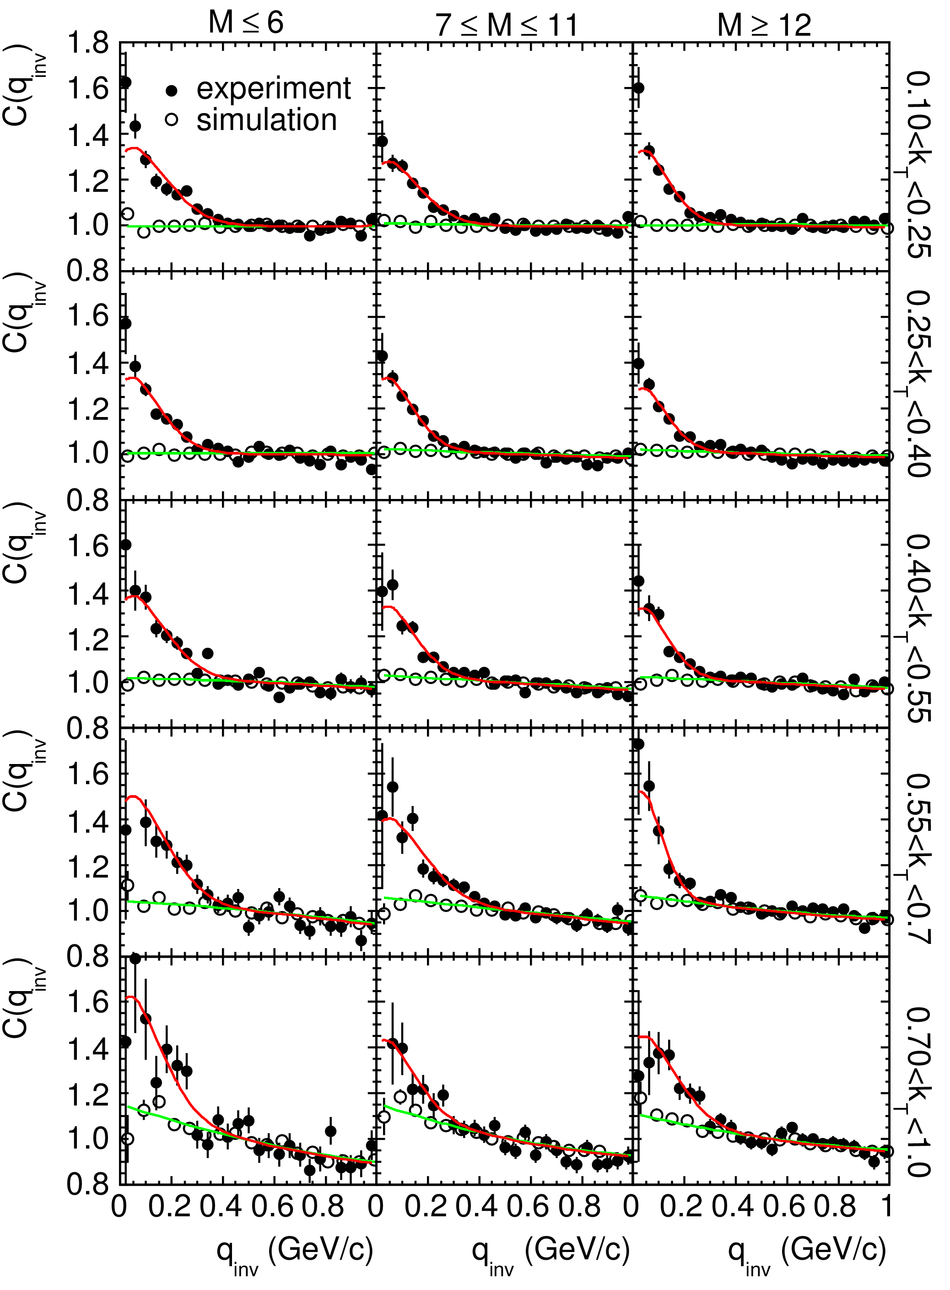 |