We report on the measurement of two-pion correlation functions from pp collisions at $\sqrt{s}$=900 GeV performed by the ALICE experiment at the Large Hadron Collider. Our analysis shows an increase of the HBT radius with increasing event multiplicity, in line with other measurements done in particle- and nuclear collisions. Conversely, the strong decrease of the radius with increasing transverse momentum, as observed at RHIC and at Tevatron, is not manifest in our data.
Phys. Rev. D 82 (2010) 052001
HEP Data
e-Print: arXiv:1007.0516 | PDF | inSPIRE
CERN Record
Figure 1
Correlation functions for identical pions from $pp$ collisions at $\sqrt{s}$ = 900 GeV (full dots) and those obtained from a simulation using PHOJET (open circles). Positive and negative pion pairs were combined The three columns represent collisions with different charged-particlemultiplicities $M$; the transverse momentum of pion pairs $\kt $(GeV/c) increases from top to bottom The lines going through the points represent the Gaussian fits discussed inthe text | 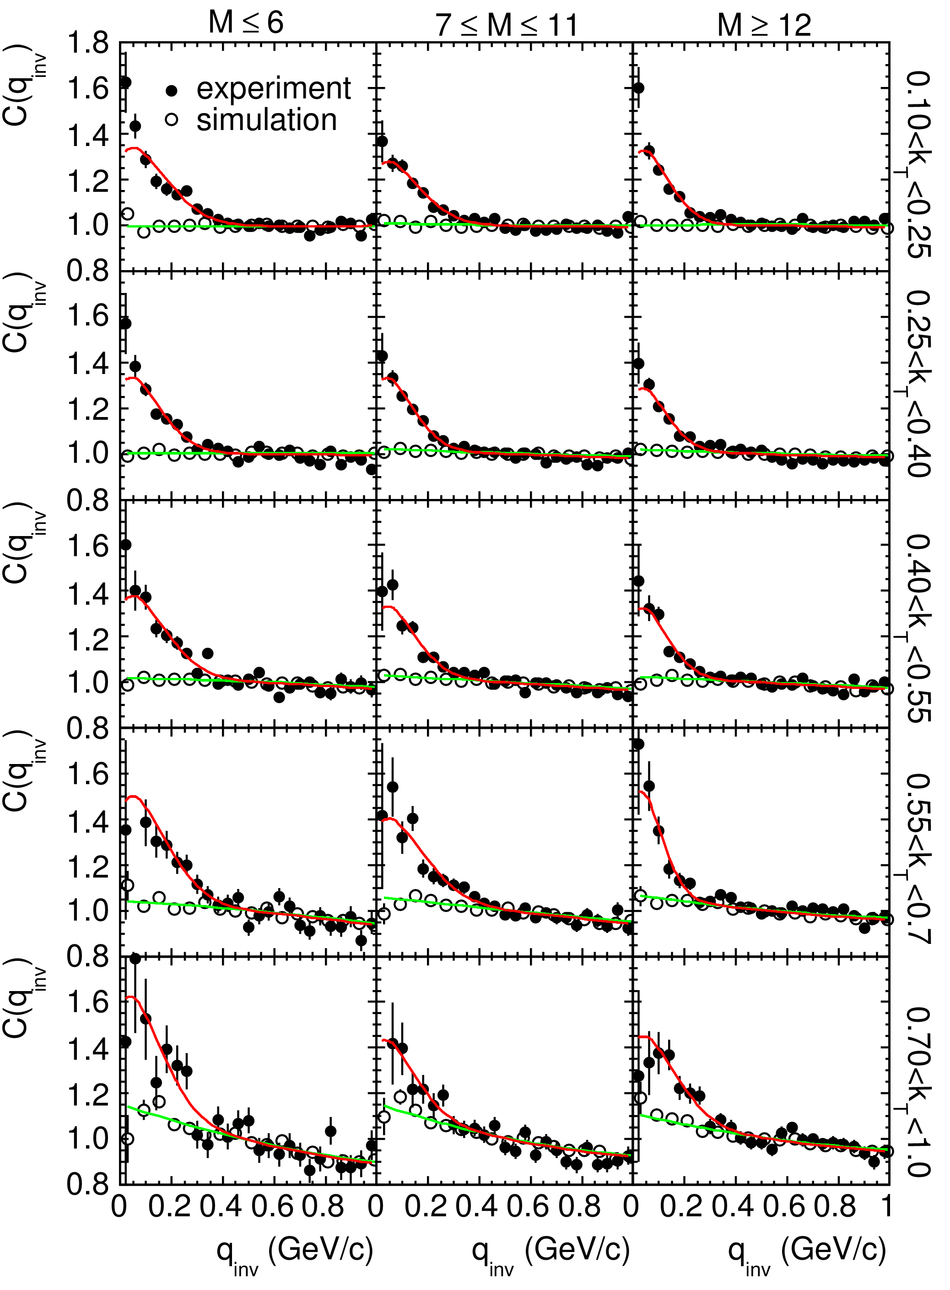 |
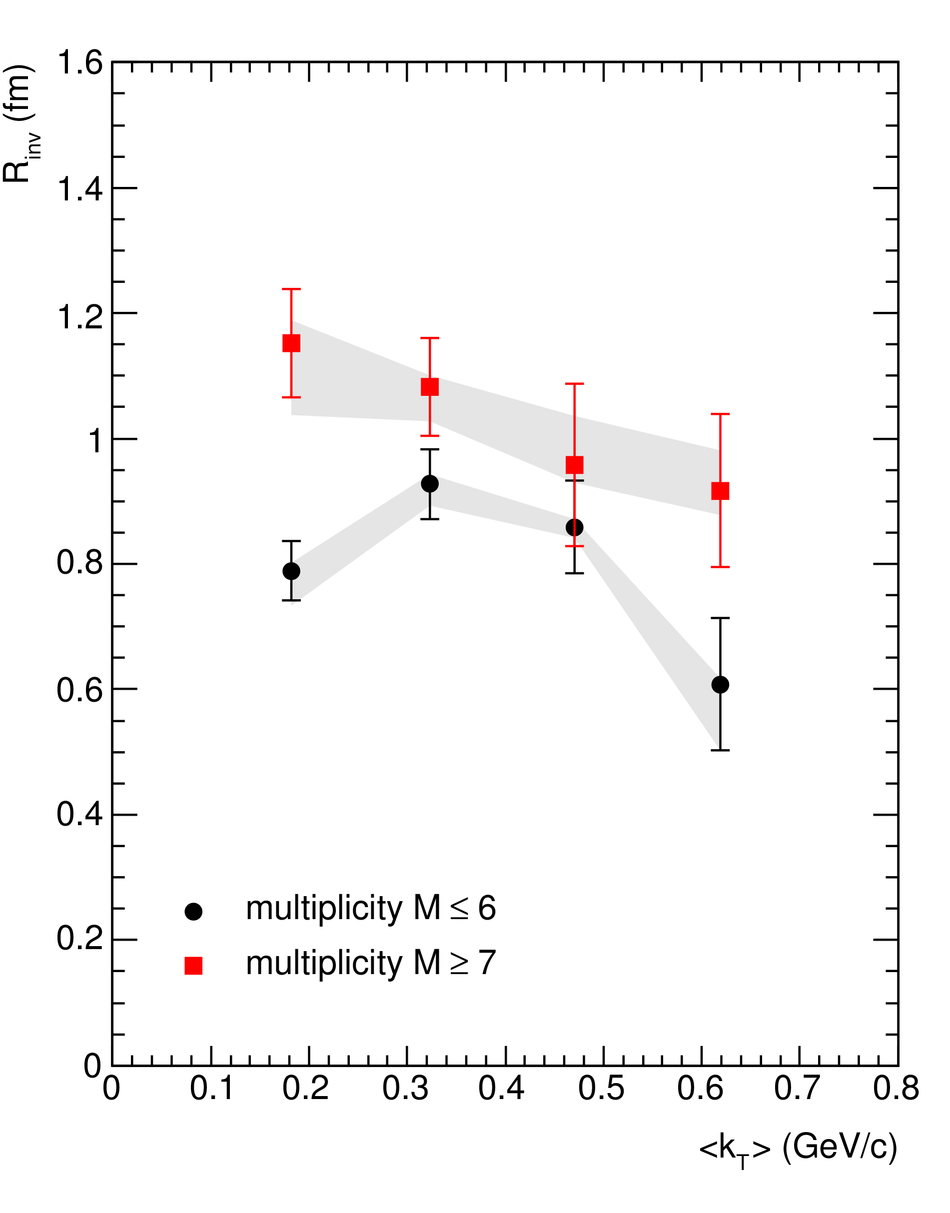
Figure 4
One-dimensional Gaussian HBT radius in $pp$ collisions at $\sqrt{s}$ = 900 GeV, determined using pion pairs with $kt = 0.1-0.55$ GeV/$c$, $\langle$\kt$\rangle$ = 0.32 GeV/$c$, and shown as a function of the charged-particle multiplicity at midrapidity(full dots) The shaded band represents the systematic errors (see text) For comparison, open symbols, red stars, and green filled boxes represent the data taken at the ISR [24],RHIC [14],and Tevatron [25], respectively |  |
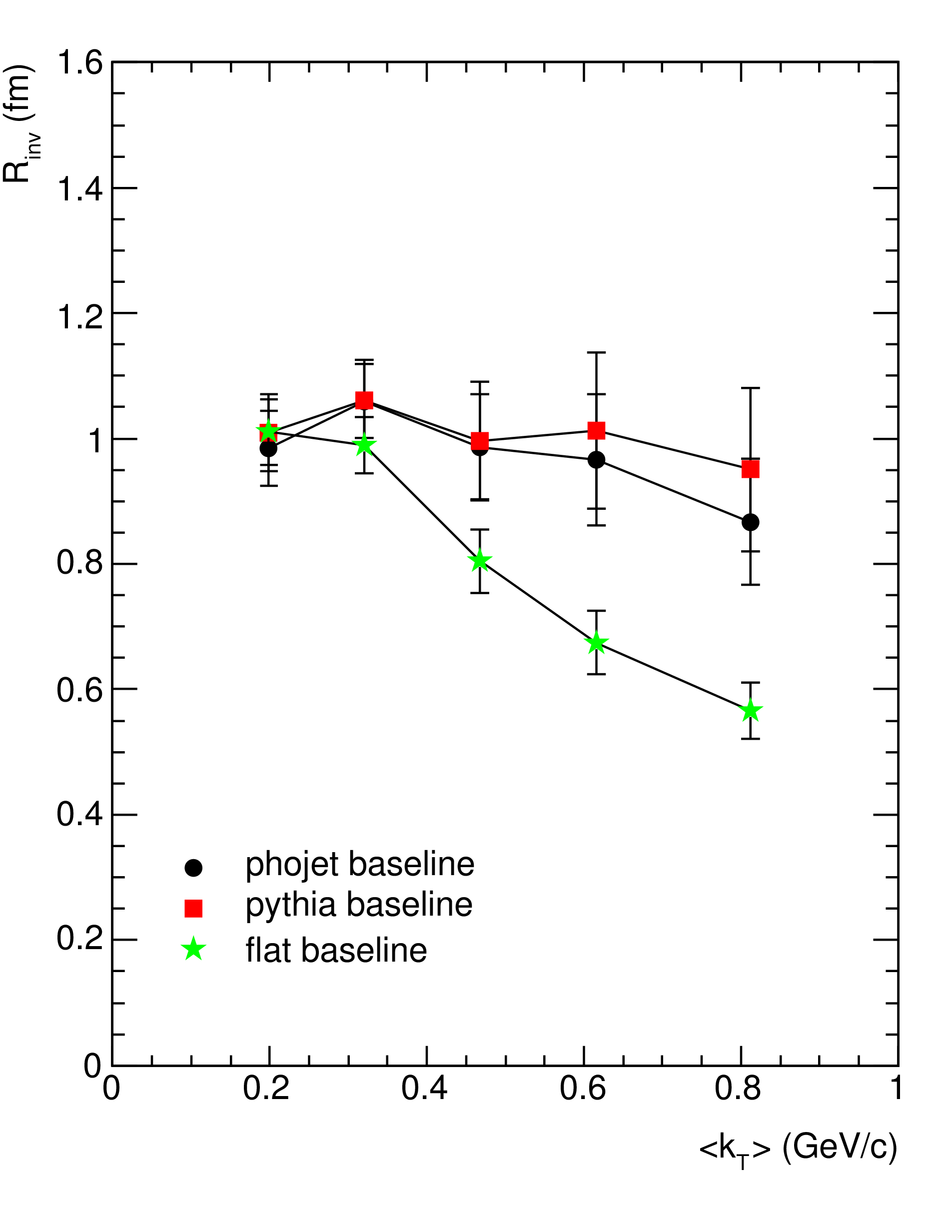
Figure 6
One-dimensional Gaussian HBT radius in \pp collisions at $\sqrt{s}$ = 900 GeV as a function of transverse momentum $\kt$ (full dots) The mean charged-particle multiplicity density was $\langle$d$N_{\rm ch}$/d$\eta$$\rangle$ = 3.6 PHOJET simulation was used to determine the baseline of the correlations Using PYTHIA and a flat baseline leads to systematic deviations up and down,respectively; the related systematic errors as indicated by the shaded area Stars and filled boxes represent the radii measured at RHIC [14] and Tevatron [25], respectively. |  |