Angular correlations between unidentified charged trigger ($t$) and associated ($a$) particles are measured by the ALICE experiment in Pb-Pb collisions at $\sqrt{s_{\rm NN}}=2.76$ TeV for transverse momenta $0.25 <~ p_{T}^{t,\, a} <~ 15$ GeV/$c$, where $p_{T}^t > p_{T}^a$. The shapes of the pair correlation distributions are studied in a variety of collision centrality classes between 0 and 50% of the total hadronic cross section for particles in the pseudorapidity interval $|\eta| <~ 1.0$. Distributions in relative azimuth $\Delta\phi \equiv \phi^t - \phi^a$ are analyzed for $|\Delta\eta| \equiv |\eta^t - \eta^a| > 0.8$, and are referred to as "long-range correlations". Fourier components $V_{n\Delta} \equiv \langle \cos(n\Delta\phi)\rangle$ are extracted from the long-range azimuthal correlation functions. If particle pairs are correlated to one another through their individual correlation to a common symmetry plane, then the pair anisotropy $V_{n\Delta}(p_{T}^t, p_{T}^a)$ is fully described in terms of single-particle anisotropies $v_n (p_{T})$ as $V_{n\Delta}(p_{T}^t, p_{T}^a) = v_n(p_{T}^t) \, v_n(p_{T}^a)$. This expectation is tested for $1 \leq n \leq 5$ by applying a global fit of all $V_{n\Delta} (p_{T}^t, p_{T}^a)$ to obtain the best values $v_{n}\{GF\} (p_{T})$. It is found that for $2 \leq n \leq 5$, the fit agrees well with data up to $p_T^a \sim 3$-4 GeV/$c$, with a trend of increasing deviation as $p_{T}^t$ and $p_{T}^a$ are increased or as collisions become more peripheral. This suggests that no pair correlation harmonic can be described over the full $0.25 <~ p_{T} <~ 15$ GeV/$c$ range using a single $v_n(p_T)$ curve; such a description is however approximately possible for $2 \leq n \leq 5$ when $p_T^a <~ 4$ GeV/$c$. For the $n=1$ harmonic, however, a single $v_1(p_T$ curve is not obtained even within the reduced range $p_T^a <~ 4$ GeV/$c$.
Phys.Lett. B 708 (2012) 249-264
HEP Data
e-Print: arXiv:1109.2501 | PDF | inSPIRE
CERN-PH-EP-2011-152
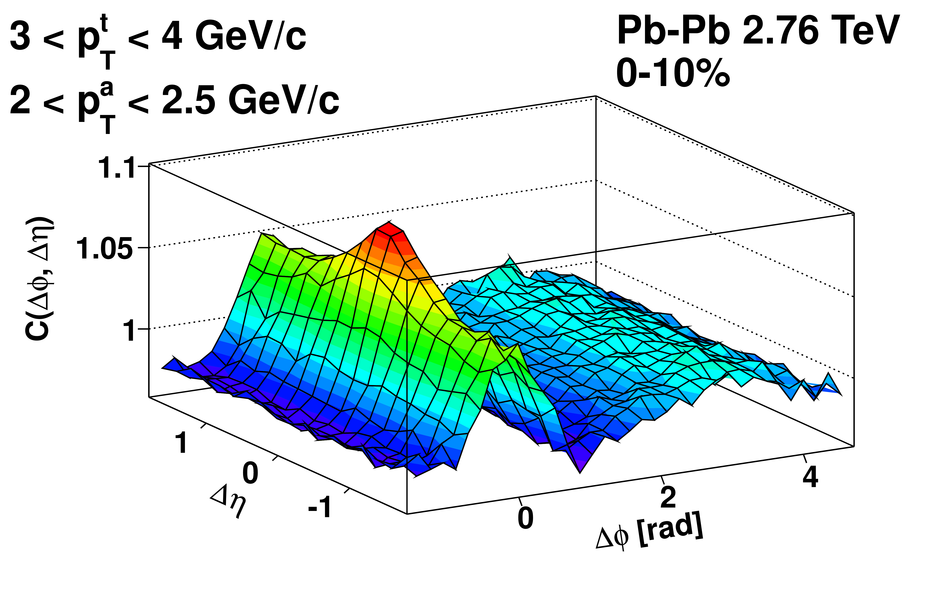
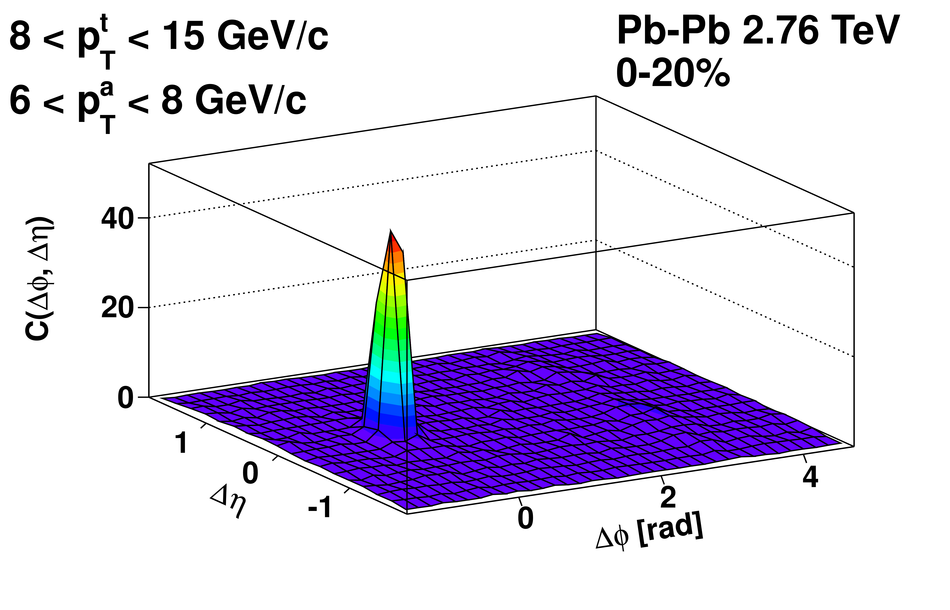
Figure 2
Left: ${C \left(\Delta \phi \right)}$ for particle pairs at $|{\Delta\eta}| > 0.8$. The Fourier harmonics for $V_{1\Delta}$ to $V_{5\Delta}$ are superimposed in color. Their sum is shown as the dashed curve. The ratio of data to the $n \leq 5$ sum is shown in the lower panel. Center: Amplitude of ${V_{n\Delta}}$ harmonics vs.\ $n$ for the same ${p_{T}^{t}}$, ${p_{T}^{a}}$, and centrality class. Right: ${V_{n\Delta}}$ spectra for a variety of centrality classes. Systematic uncertainties are represented with boxes (see section 4 Factorization and the global fit), and statistical uncertainties are shown as error bars. | 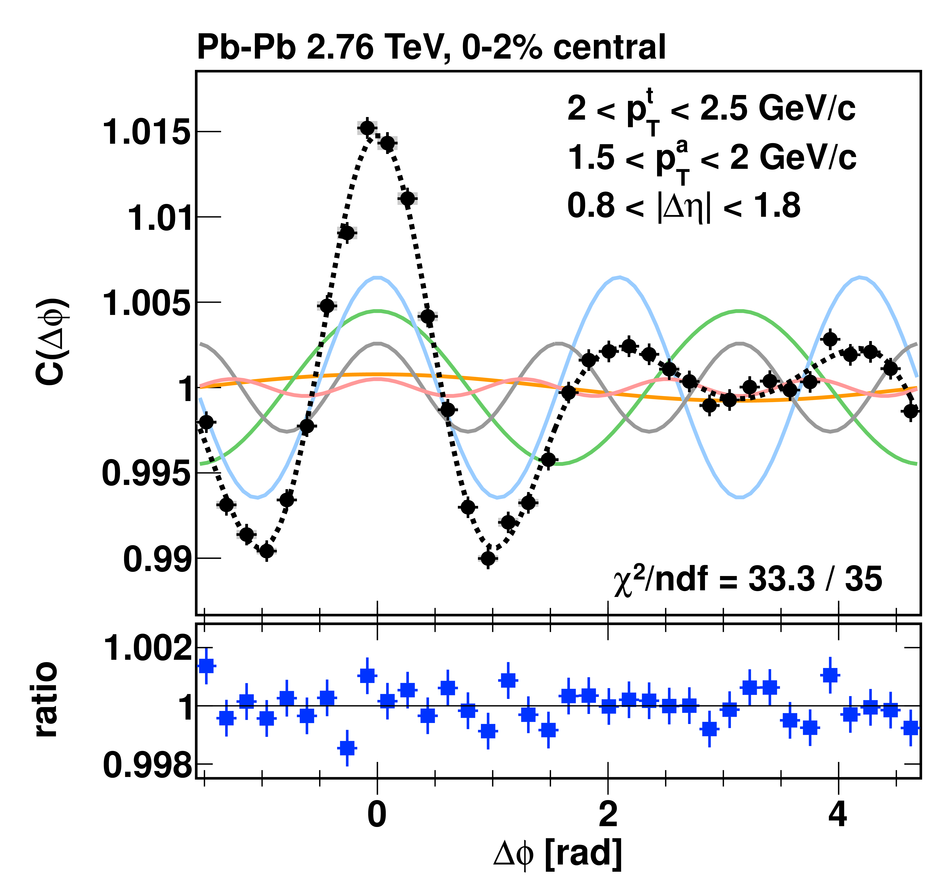 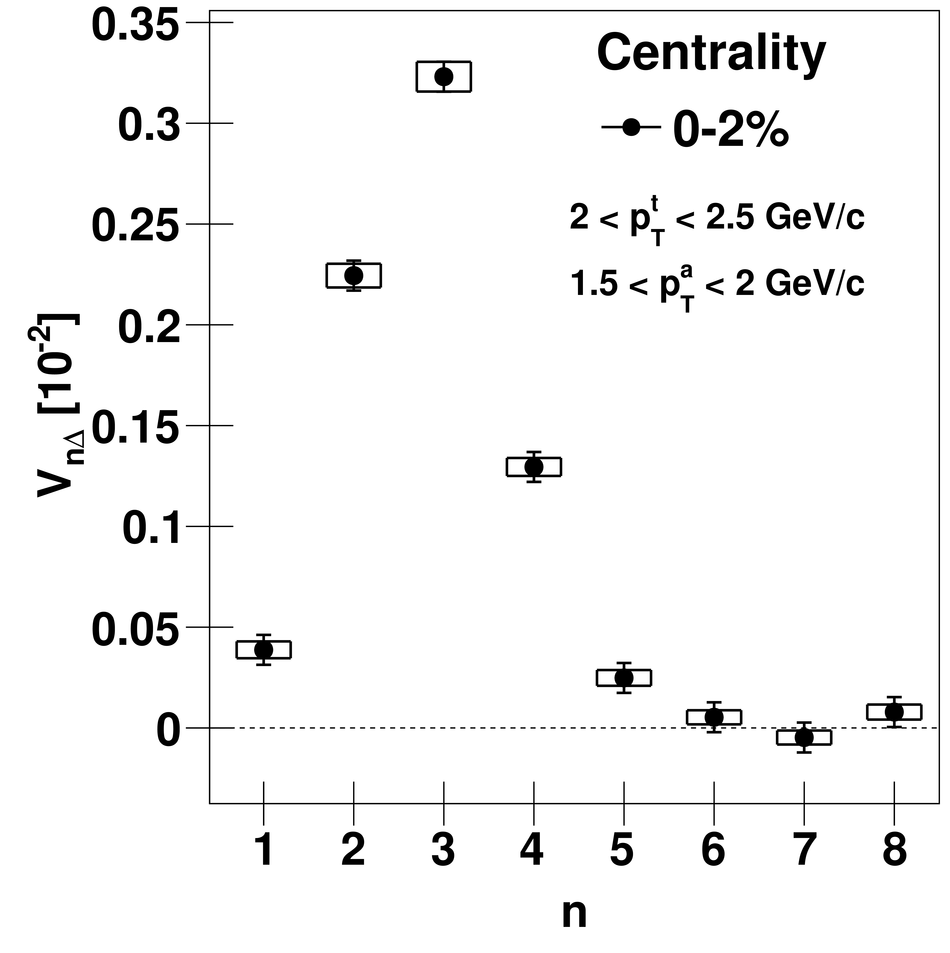 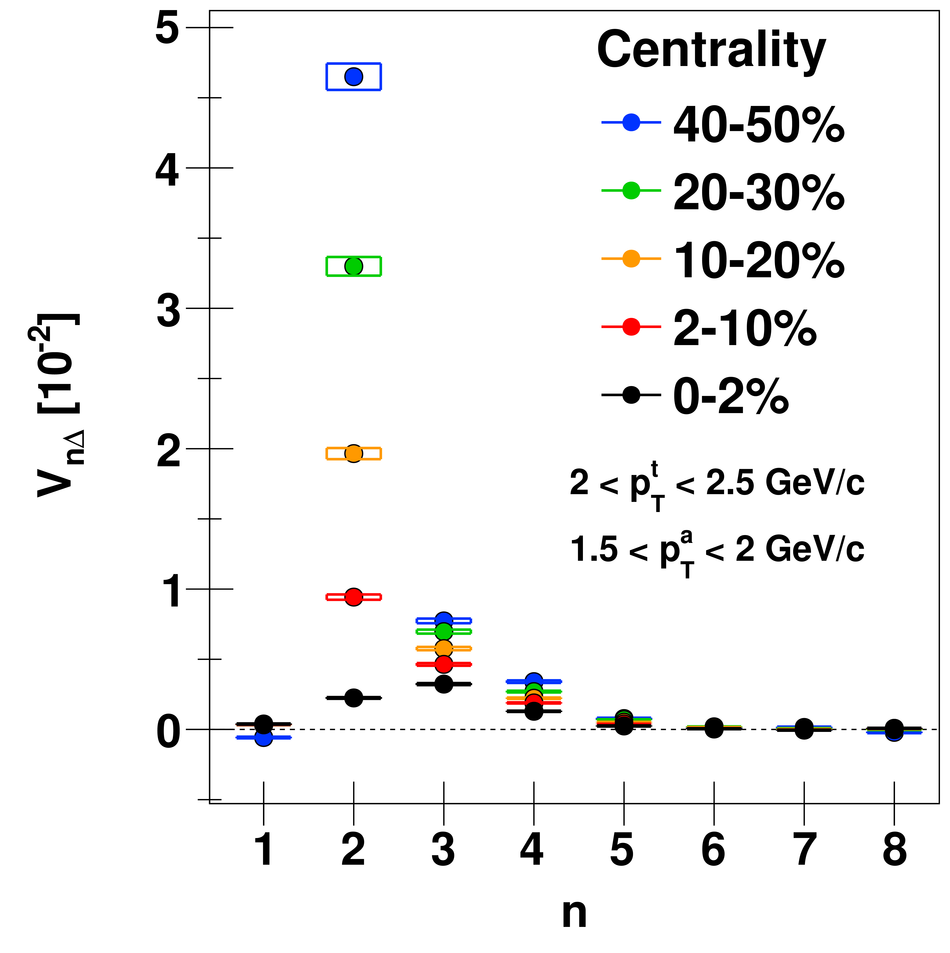 |
Figure 3
Left: ${C \left(\Delta \phi \right)}$ at $|{\Delta\eta}| > 0.8$ for higher-$\pt$ particles than in Fig.2. The Fourier harmonics ${V_{n\Delta}}$ for $n \leq 5$ are superimposed in color. Their sum is shown as the dashed curve. The ratio of data to the $n \leq 5$ sum is shown in the lower panel. Right: Amplitude of ${V_{n\Delta}}$ harmonics vs.\ $n$ at the same ${p_{T}^{t}}$, ${p_{T}^{a}}$ for two centrality bins. Systematic uncertainties are represented with boxes (see section 4 Factorization and the global fit), and statistical uncertainties are shown as error bars. | 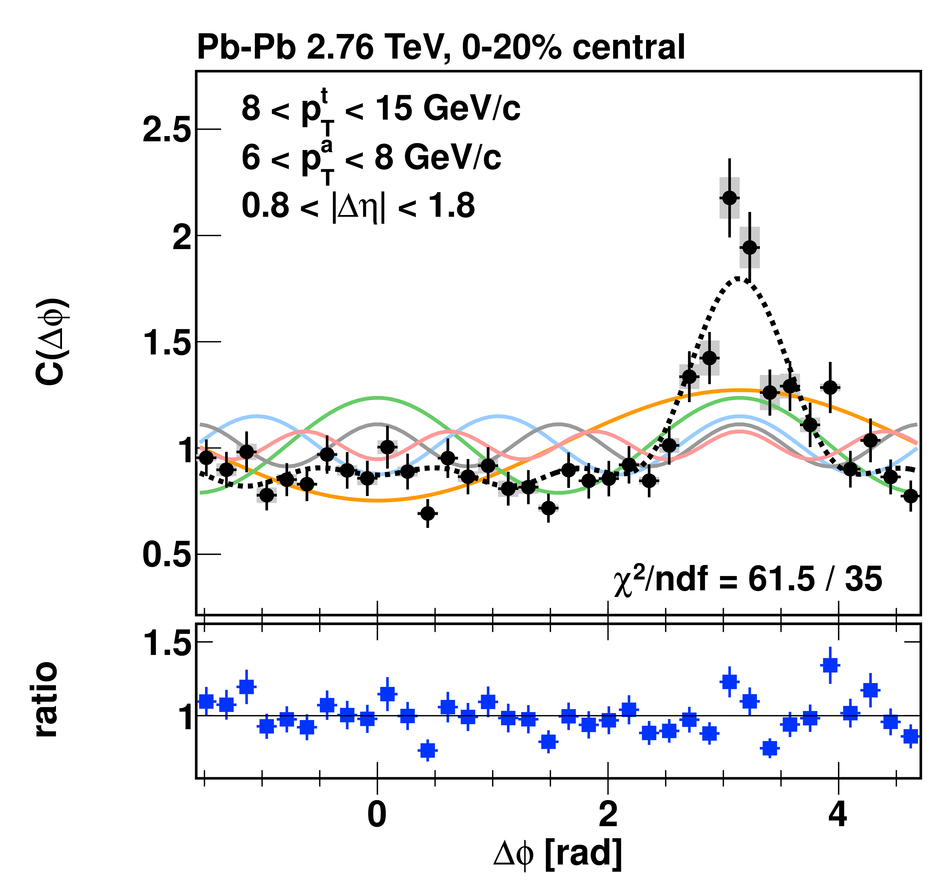 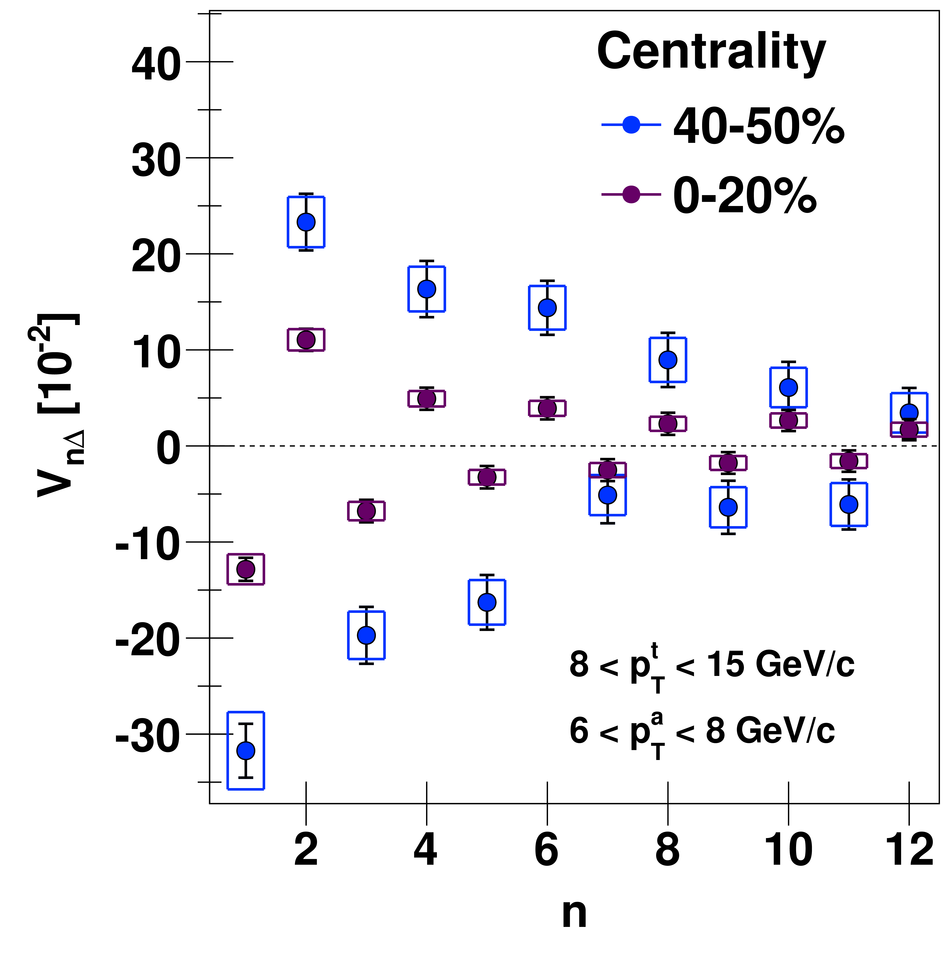 |

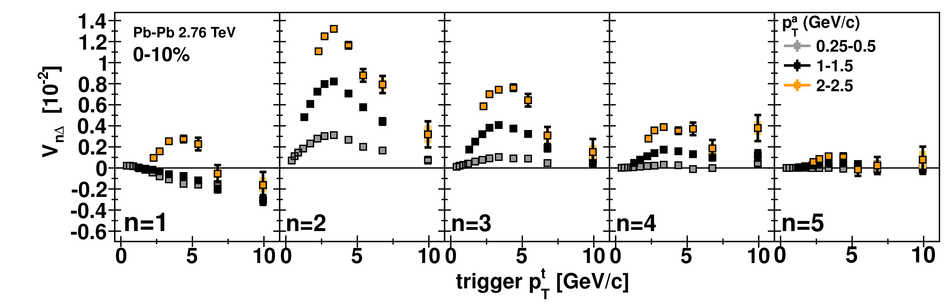

Figure 5
Global fit examples in $0$--$10$% central events for $n=2,3,4$ and $5$. The measured ${V_{n\Delta}}$ coefficients are plotted on an interleaved ${p_{T}^{t}}$, ${p_{T}^{a}}$ axis in the upper panels, and the global fit function (Eq. 6}) is shown as the red curves. The global fit systematic uncertainty is represented by dashed lines. The lower section of each panel shows the ratio of the data to the fit, and the shaded bands represent the systematic uncertainty propagated to the ratio. In all cases, off-scale points are indicated with arrows. \begin{align*} (6) V_{n\Delta} ({p_{T}^{t}}, {p_{T}^{a}}) &=& \langle\langle e^{in(\phi_a - \phi_t)} \rangle \rangle \nonumber \\ &=& \langle \langle e^{in(\phi_a - \Psi_n)} \rangle \langle e^{-in(\phi_t - \Psi_n)} \rangle \rangle \nonumber \\ &=& \langle v_n\{2\}({p_{T}^{t}}) \, v_n\{2\}({p_{T}^{a}}) \rangle \end{align*} | 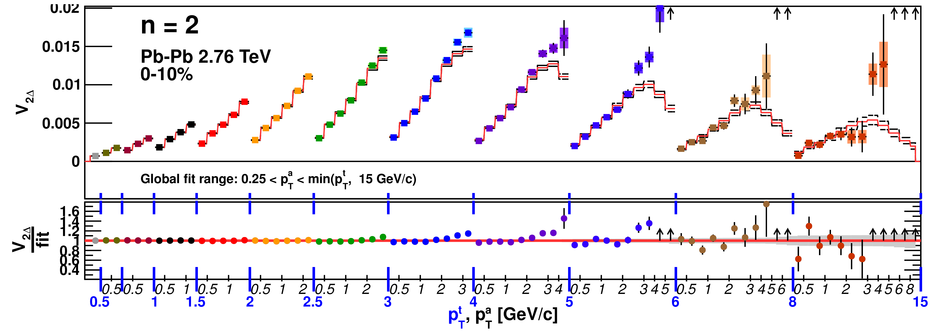 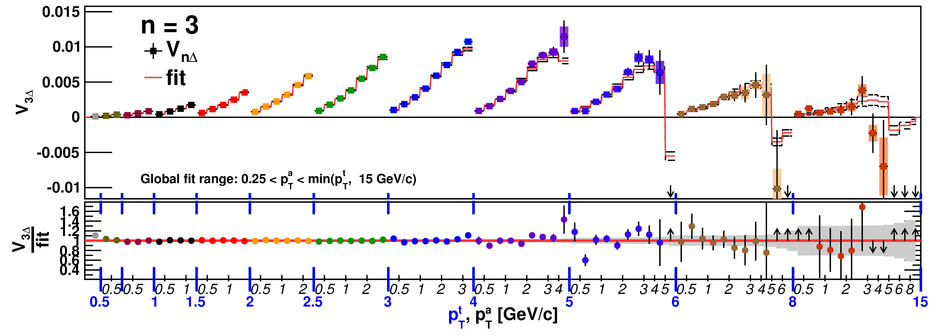  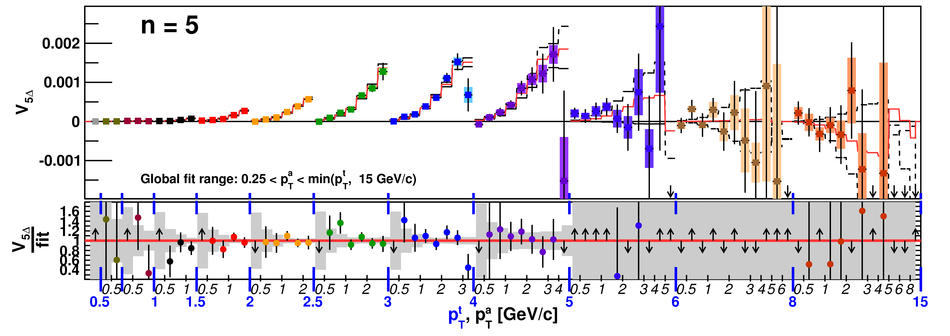 |
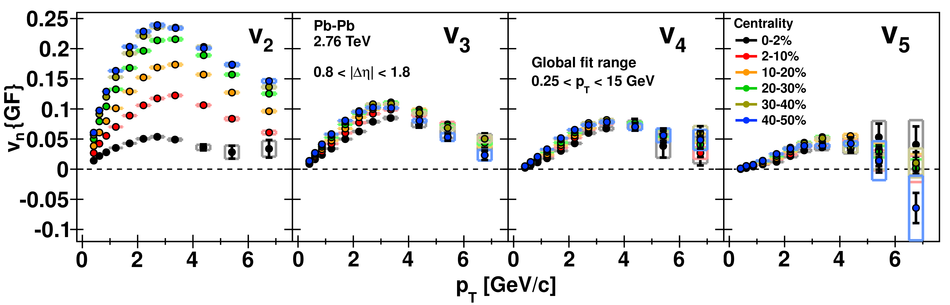
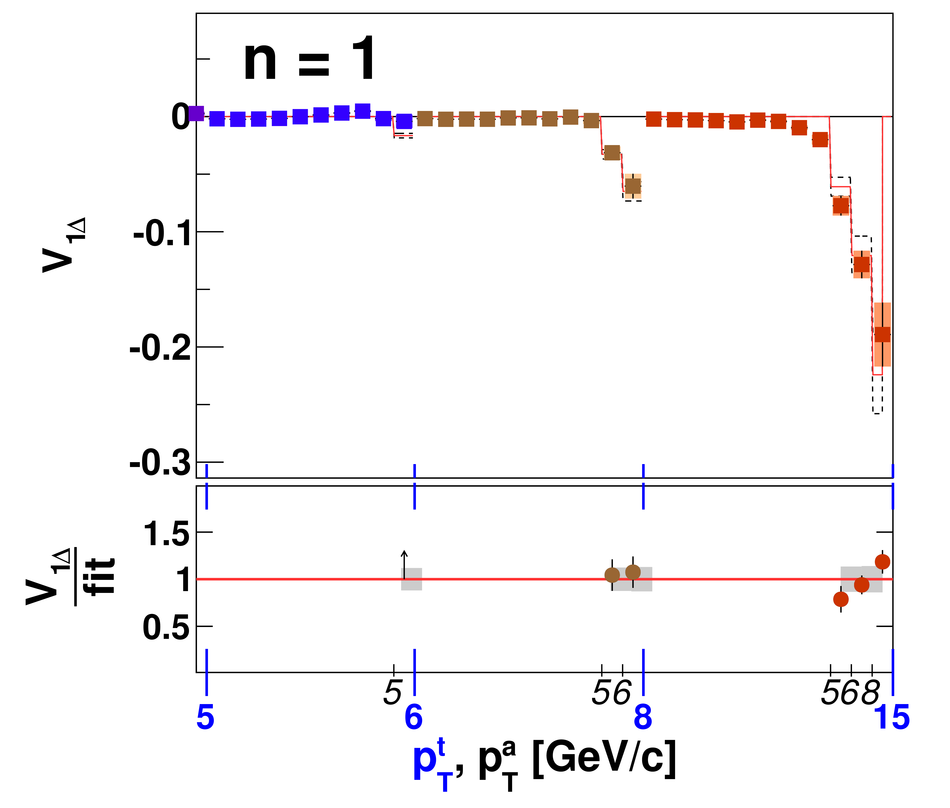
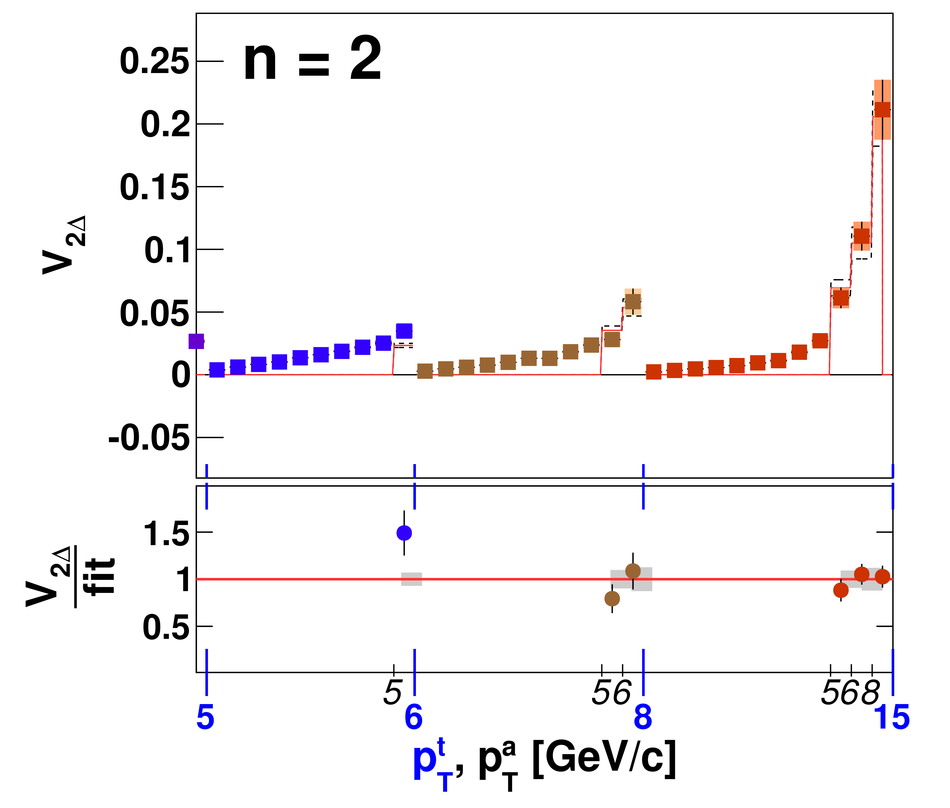

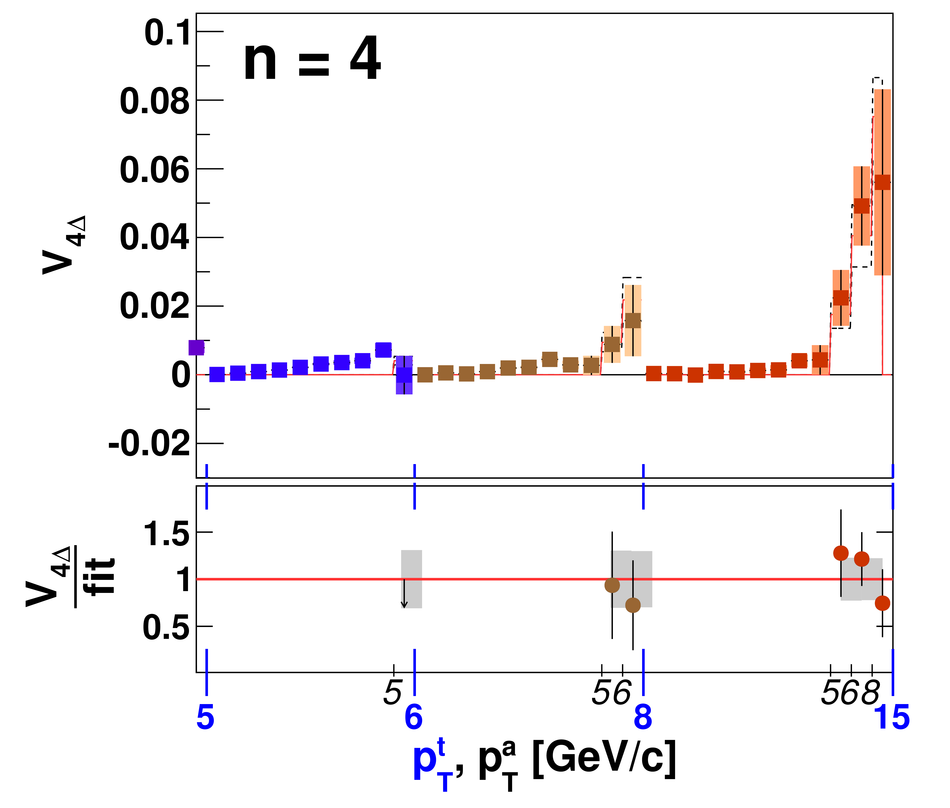
Figure 8
(Color online) The global-fit parameters, ${v_{n} \{ GF \} }$, for $1 \leq n \leq 5$ as obtained using restricted ${p_{T}^{a}}$ fit ranges at two different centralities. The solid (open) points represent fits using only $0.25 < {p_{T}^{a}} < 5$ ($5 < {p_{T}^{a}} < 15$) GeV/$c$. The open points represent the magnitude of ${v_{n} \{ GF \} }$ from high-${p_{T}^{t}}$, high-${p_{T}^{a}}$ long-range correlations. Statistical uncertainties are represented by error bars on the points, while systematic uncertainty is depicted by open rectangles. | 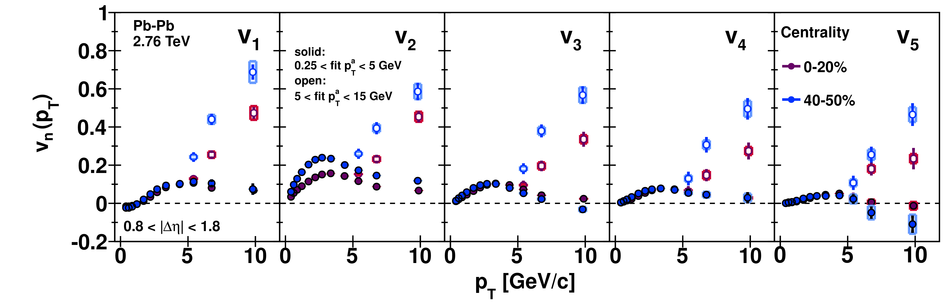 |
Figure 9
${V_{n\Delta}}$ values from $0$--$10$% central Pb--Pb collisions (points) and global fit results (solid lines) for $3.0 < {p_{T}^{t}} < 4.0$ GeV/$c$ as a function of the minimum $|{\Delta\eta}|$ separation for a selection of ${p_{T}^{a}}$ bins. For clarity, points are shown with statistical error bars only. For reference, a dashed line (drawn only in the $n=2$ panel) indicates the $|{\Delta\eta}|_{\mathrm{min}} = 0.8$ requirement applied throughout this analysis. |  |

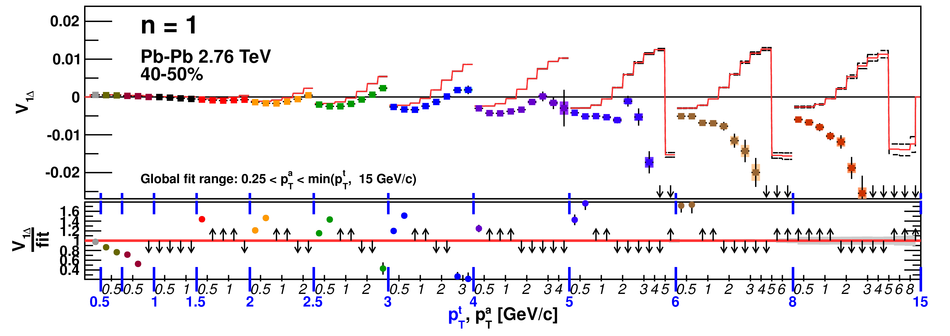
Figure 11
$v_1\{GF\}$ (left) and $v_2\{GF\}$ (right) as obtained using restricted ${p_{T}^{a}}$ fit ranges at two different centralities. The open circles (solid squares) represent fits using only $0.25 < {p_{T}^{a}} < 1$ ($2 < {p_{T}^{a}} < 4$) GeV/$c$. For the more central $v_2$ points, the two different fit ranges lead to a similar curve, indicating an approximate factorization. In contrast, a divergence with rising ${p_{T}^{t}}$ is observed for $v_1\{GF\}$. For both $n=1$ and $n=2$, the divergence is enhanced in more peripheral centrality classes. | 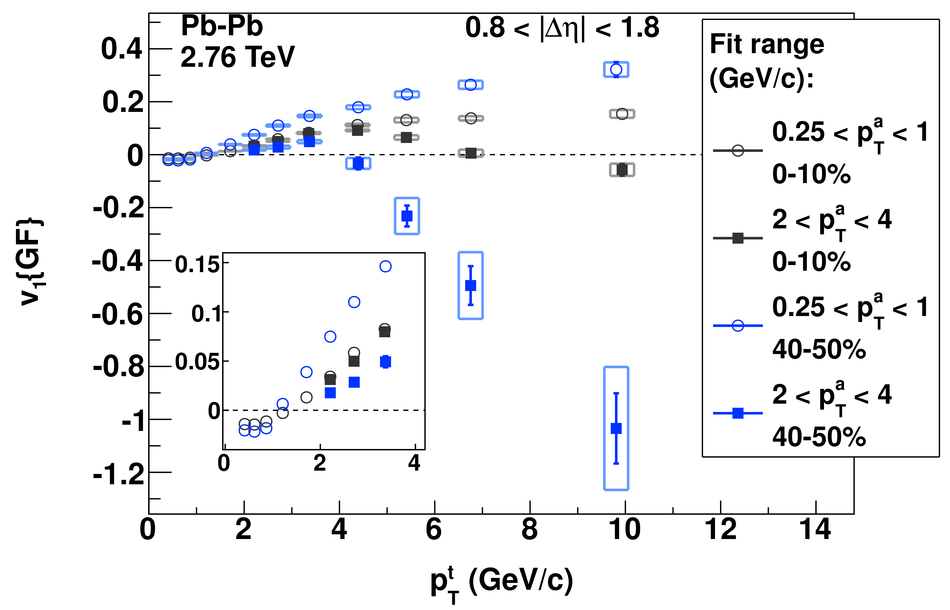 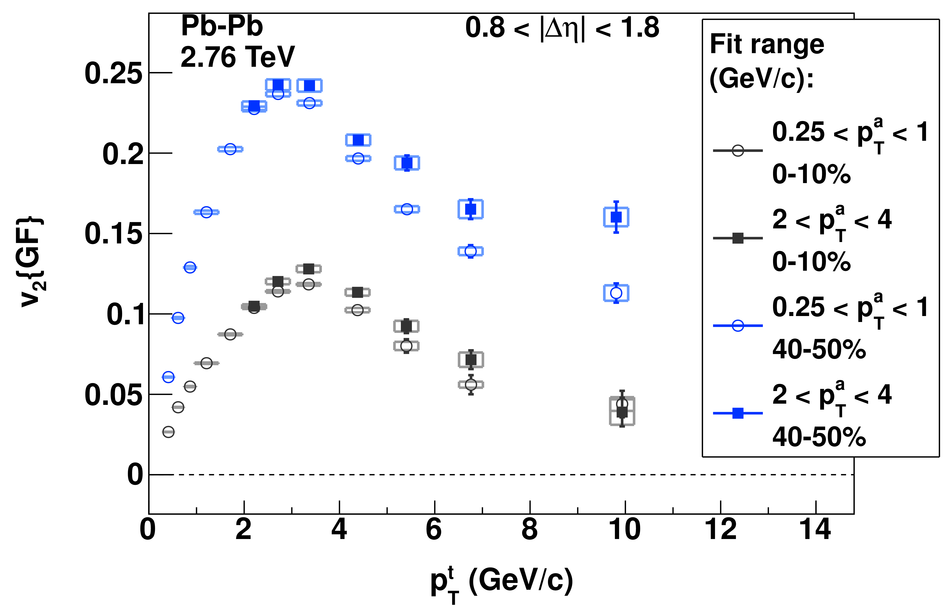 |