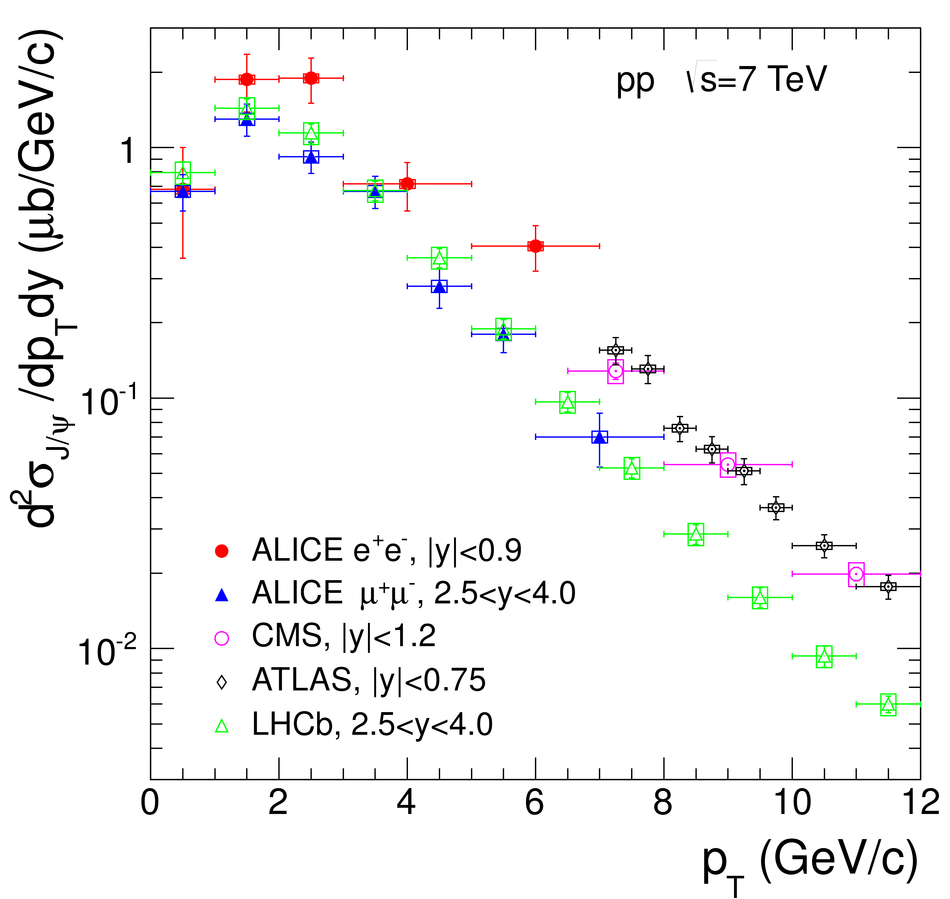
$\mathrm{d}^2\sigma_{\rm J/\psi}/\mathrm{d}p_{\rm T}\mathrm{d}y$ for the midrapidity range and for the forward rapidity data, compared with results from the other LHC experiments [15,16,17], obtained in similar rapidity ranges. The error bars represent the quadratic sum of the statistical and systematic errors, while the systematic uncertainties on luminosity are shown as boxes The symbols are plotted at the center of each bin. |  |