The ALICE experiment at the LHC has studied inclusive $\rm J/\psi$ production at central and forward rapidities in pp collisions at $\sqrt{s} = 7~$TeV. In this Letter, we report on the first results obtained detecting the $\rm J/\psi$ through the dilepton decay into e$^+$e$^-$ and $\mu^+\mu^-$ pairs in the rapidity ranges $|y|<0.9$ and $2.5<y<4$, respectively, and with acceptance down to zero $p_{\rm T}$.In the dielectron channel the analysis was carried out on a data sample corresponding to an integrated luminosity $L_{\rm int}$ =5.6~nb$^{-1}$ and the number of signal events is $N_{\rm J/\psi}$ = 352 $\pm$ 32 (stat.) $\pm$ 28 (syst.) the corresponding figures in the dimuon channel are $L_{\rm int}$ = 15.6 nb$^{-1}$ and $N_{\rm J/\psi}$ = 1924 $\pm$ 77 (stat.) $\pm$ 144 (syst.).The measured production cross sections are $\sigma_{\rm J/\psi}(|y|<0.9)$ = %10.7 $\pm$ 1.0 (stat.) $\pm$ 1.6 (syst.) $^{+ 1.6}_{-2.3}$ (syst.pol.) $\mu$b and12.4 $\pm$ 1.1 (stat.) $\pm$ 1.8 (syst.) $^{+ 1.8}_{-2.7}$ (syst.pol.) $\mu$b and $\sigma_{\rm J/\psi}(2.5<y<4)$ = 6.31 $\pm$ 0.25 (stat.) $\pm$ 0.76 (syst.) $^{+0.95}_{-1.96} $(syst.pol.) $\mu$b. The differential cross sections, in transverse momentum and rapidity, of the $\rm J/\psi$ were also measured.
Phys. Lett. B 704 (2011) 442, Phys. Lett. B 718 (2012) 692 (erratum)
HEP Data
e-Print: arXiv:1105.0380 | PDF | inSPIRE
CERN-PH-EP-2011-057
Figure 2
Top panel: invariant mass distributions for opposite-sign (OS) andlike-sign (LS) electron pairs ($|y|< 0.9$, all $p_{\rm T}$),as well as for pairs obtained with one trackrandomly rotated (TrkRot, see text). Bottom panel: the difference of the OSand LS distributions with the fit to the Monte Carlo (MC) signalsuperimposed. | 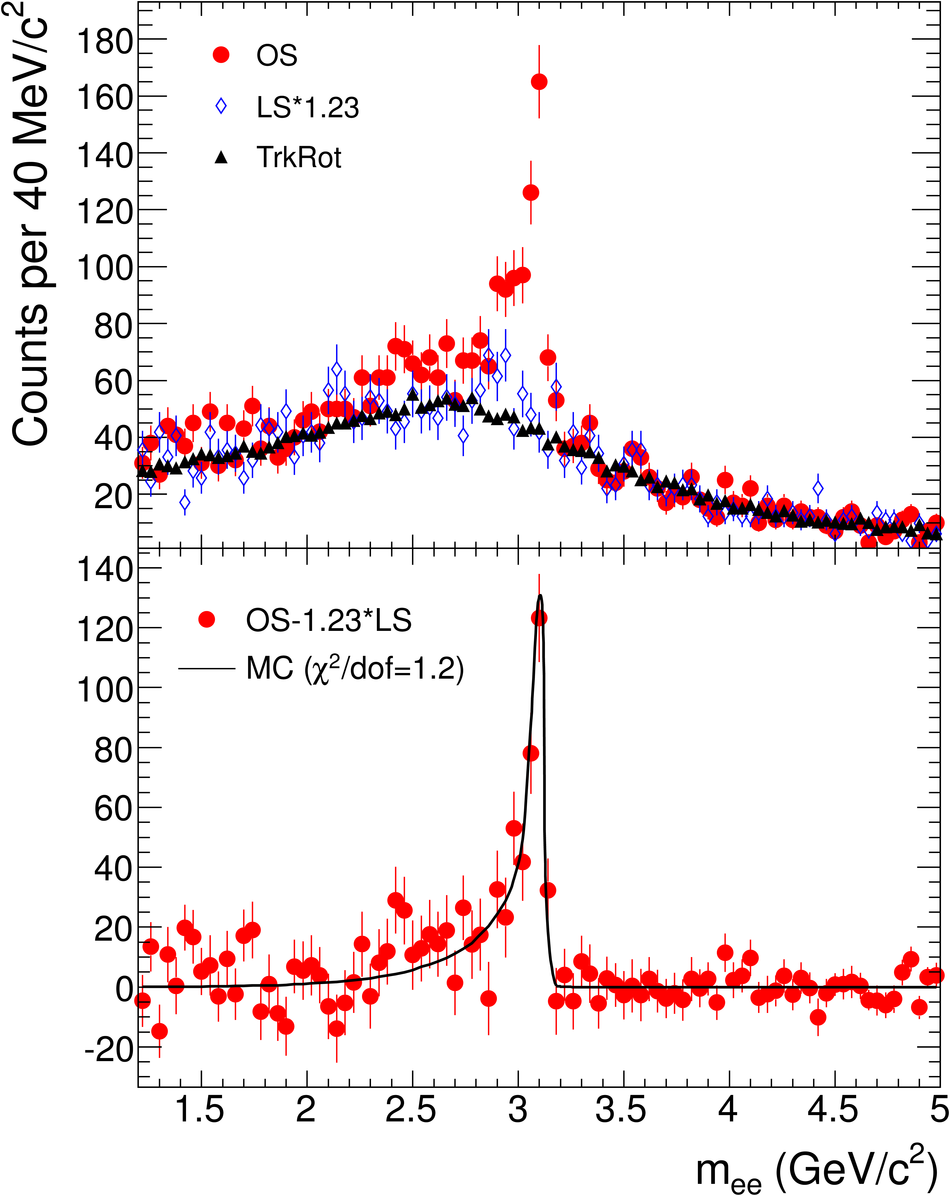 |
Figure 3
Invariant mass distribution for opposite-sign muon pairs ($2.5< y< 4$, all $p_{\rm T}$),in the mass region $1.5< m_{\mu\mu}< 5$ GeV/$c^2$ with the result of the fit. The plot refers to the sub-period with the largest statistics($N_{\rm J/\psi}=957\pm56$, corresponding to $L_{\rm int}$ = 7.9 nb$^{-1}$) The fitted J/$\psi$ and $\psi(2S)$ contributions, as well as the background, are also shown. | 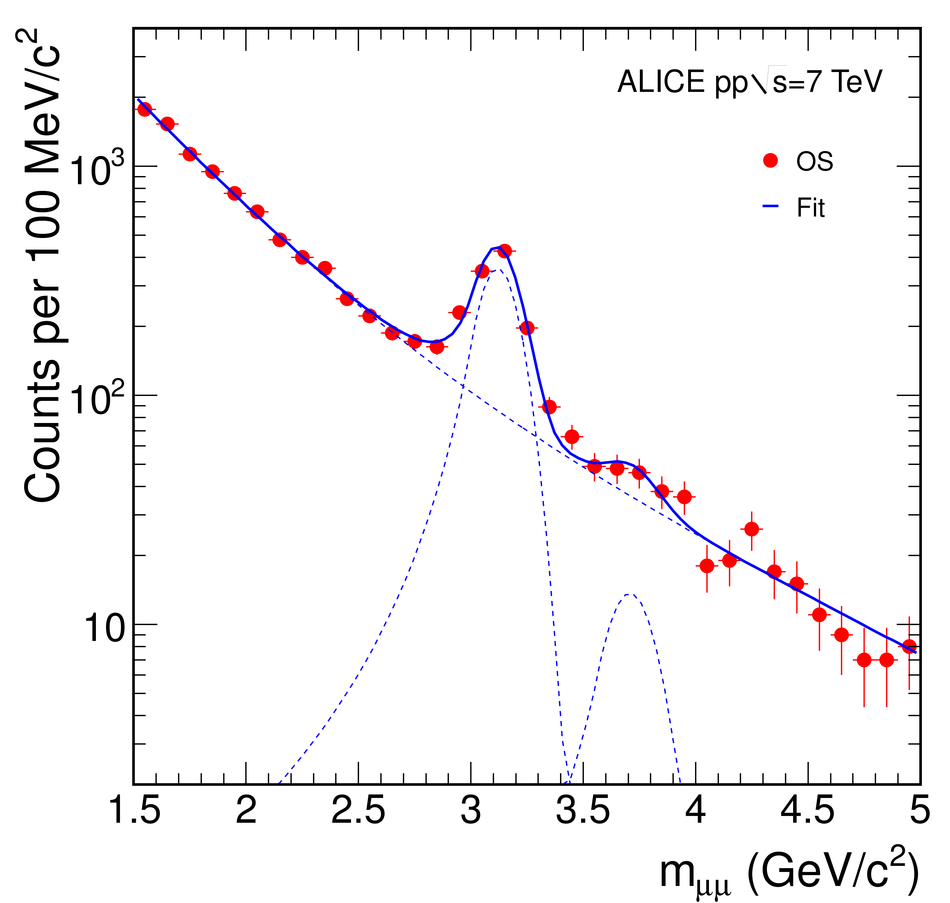 |

Figure 6
$\mathrm{d}^2\sigma_{\rm J/\psi}/\mathrm{d}p_{\rm T}\mathrm{d}y$ for the midrapidity range and for the forward rapidity data, compared with results from the other LHC experiments [15,16,17], obtained in similar rapidity ranges. The error bars represent the quadratic sum of the statistical and systematic errors, while the systematic uncertainties on luminosity are shown as boxes The symbols are plotted at the center of each bin. |  |
Figure 7
$\mathrm{d}\sigma_{\rm J/\psi}/\mathrm{d}y$, compared with results from the other LHC experiments [15,16,17]. The error bars represent the quadratic sum of the statistical and systematic errors, while the systematic uncertainties on luminosity are shown as boxes The symbols are plotted at the center of each bin. |  |