Opposite-sign dimuon invariant mass distribution for the 20-40$\%$, 40-60$\%$ and 60-90$\%$ centrality classes, for $2.5 < y < 4$ and $p_{\rm T} < 3$ Gev/$c$, before (top row) and after background subtraction (bottom row) via event mixing In these intervals the $\Psi$ signal is extracted whereas in all other centrality and $p_{\rm T}$ intervals, only the 95$\%$ confidence level upper limits are provided. | 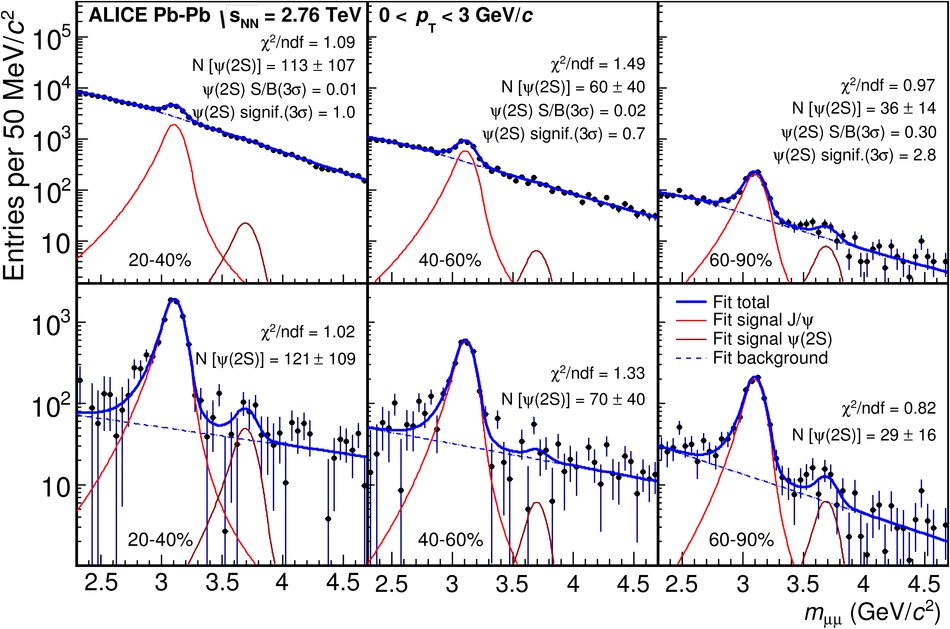 |