The production of J/$\psi$ and $\psi(2S)$ was measured with the ALICE detector in Pb-Pb collisions at the LHC. The measurement was performed at forward rapidity ($2.5 <~ y <~ 4 $) down to zero transverse momentum ($p_{\rm T}$) in the dimuon decay channel. Inclusive J/$\psi$ yields were extracted in different centrality classes and the centrality dependence of the average $p_{\rm T}$ is presented. The J/$\psi$ suppression, quantified with the nuclear modification factor ($R_{\rm AA}$), was studied as a function of centrality, transverse momentum and rapidity. Comparisons with similar measurements at lower collision energy and theoretical models indicate that the J/$\psi$ production is the result of an interplay between color screening and recombination mechanisms in a deconfined partonic medium, or at its hadronization. Results on the $\psi(2S)$ suppression are provided via the ratio of $\psi(2S)$ over J/$\psi$ measured in pp and Pb-Pb collisions.
JHEP 05 (2016) 179
HEP Data
e-Print: arXiv:1506.08804 | PDF | inSPIRE
CERN-PH-EP-2015-157

Figure 3
Opposite-sign dimuon invariant mass distribution for the 20-40$\%$, 40-60$\%$ and 60-90$\%$ centrality classes, for $2.5 < y < 4$ and $p_{\rm T} < 3$ Gev/$c$, before (top row) and after background subtraction (bottom row) via event mixing In these intervals the $\Psi$ signal is extracted whereas in all other centrality and $p_{\rm T}$ intervals, only the 95$\%$ confidence level upper limits are provided. | 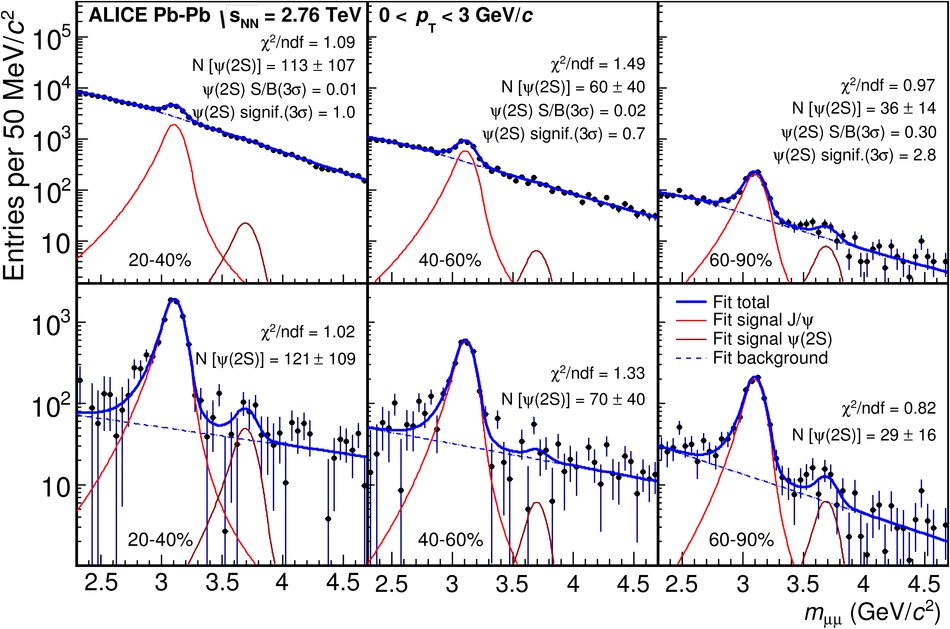 |
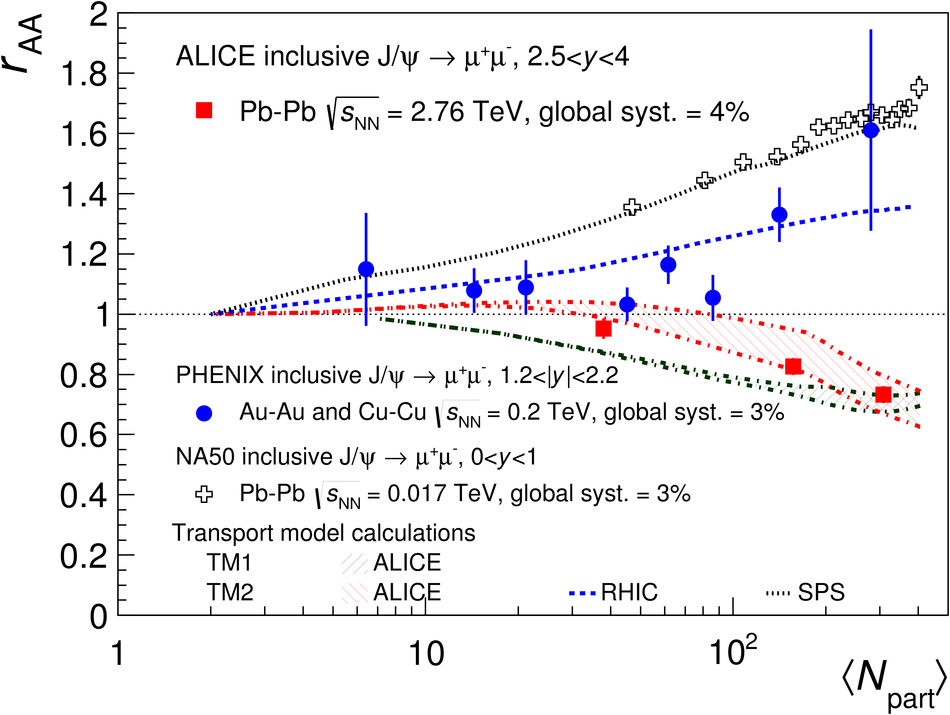
Figure 7
Inclusive J/$\Psi$ $R_{\rm AA}$ as a function of the number of participant nucleons measured in Pb-Pb collisions at $\sqrt{s_{\rm NN}}=2.76$ TeV, compared to the PHENIX measurement in Au-Au collisions at $\sqrt{s_{\rm NN}}=0.2$ TeV (left) and to theoretical models, which all include a J/$\Psi$ regeneration component (right). The brackets shown in the three most peripheral centrality classes on the right figure quantify the possible range of variation of the hadronic J/$\Psi$ $R_{\rm AA}$ for two extreme hypotheses on the photo-production contamination in the inclusive measurement, see text for details. | 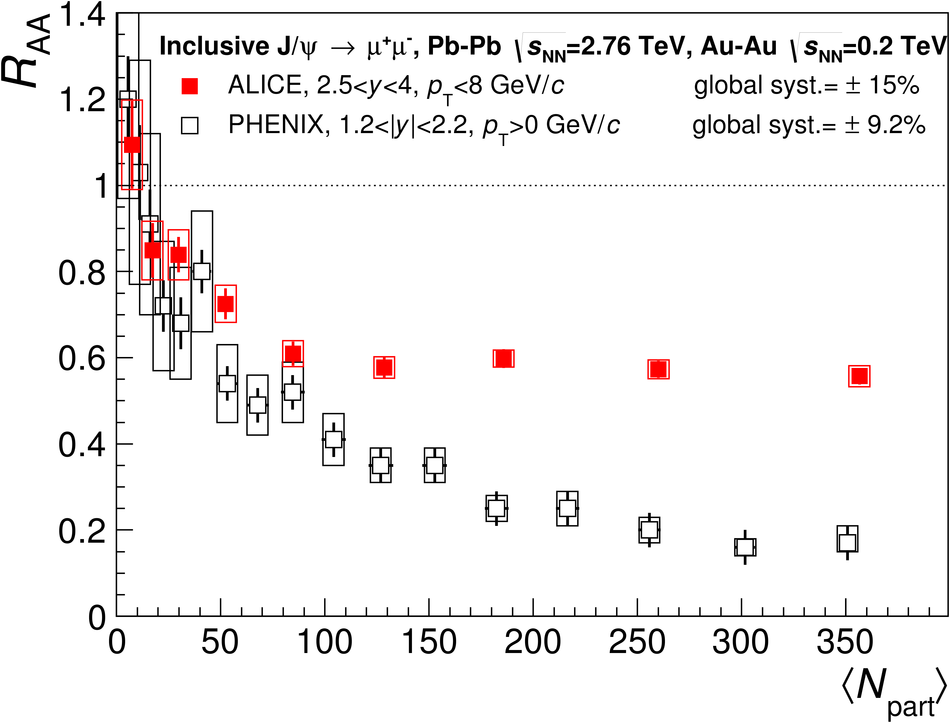 |
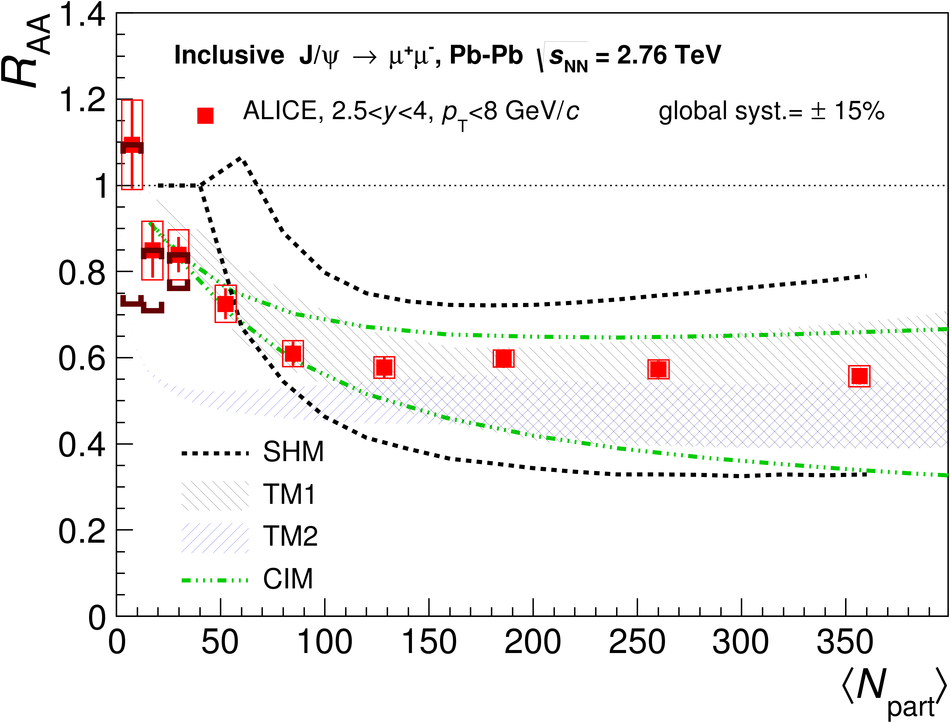
Figure 8
Inclusive J/$\Psi$ $R_{\rm AA}$ as a function of the number of participant nucleons measured in Pb-Pb collisions at $\sqrt{s_{\rm NN}}=2.76$ TeV for three $p_{\rm T}$ ranges (0-2, 2-5 and 5-8 Gev/$c$) and comparisons of the lowest and highest $p_{\rm T}$ range to the transport and to the comover interaction models. The brackets quantify the possible range of variation of the hadronic J/$\Psi$ $R_{\rm AA}$ for two extreme hypotheses on the photo-production contamination in the inclusive measurement. | 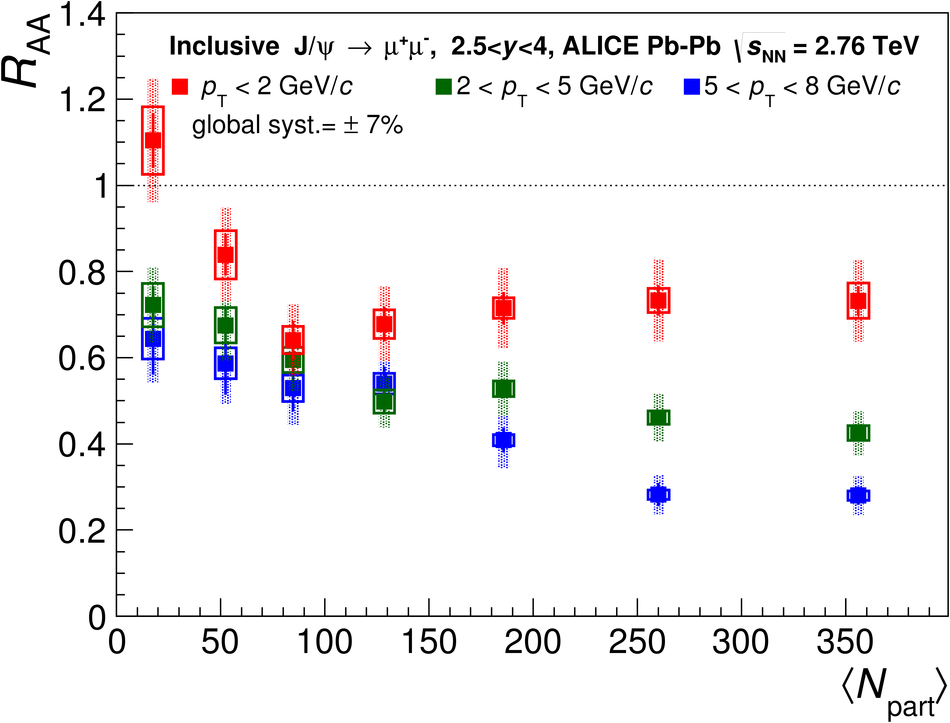 |
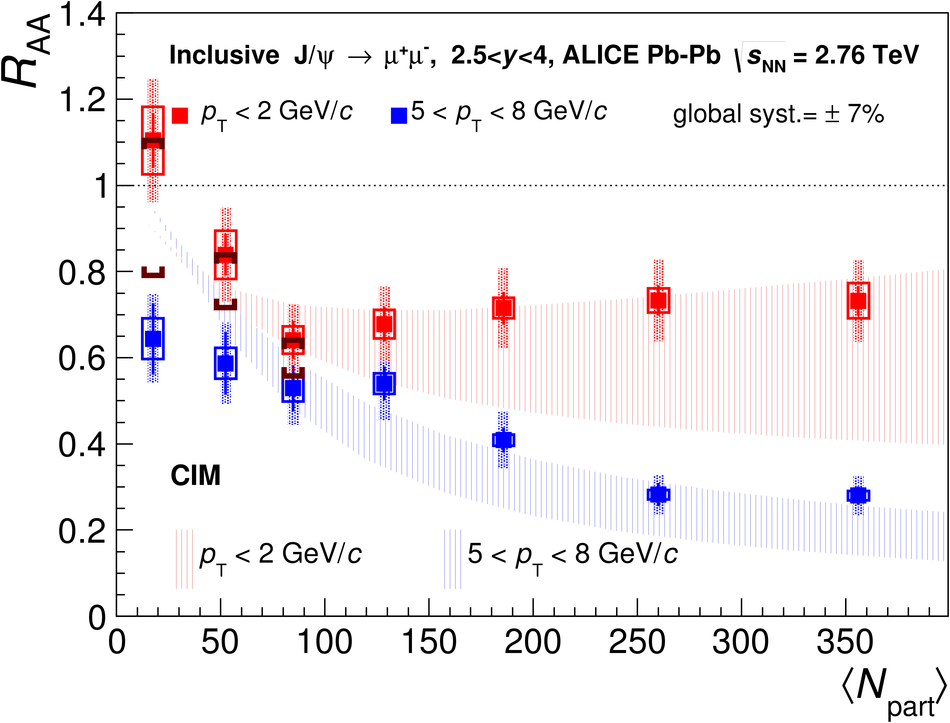
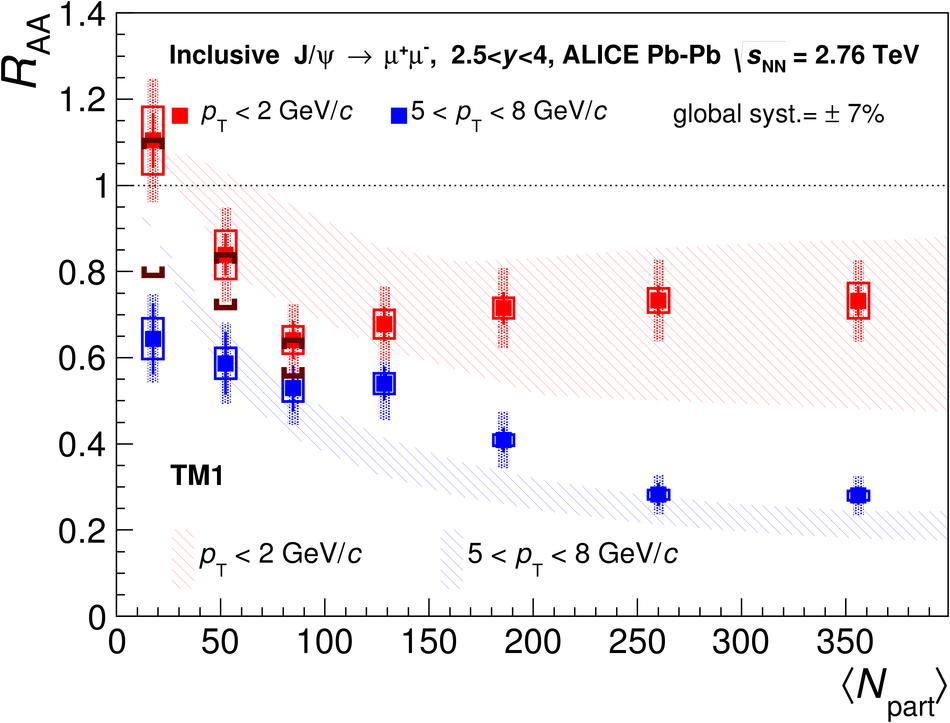
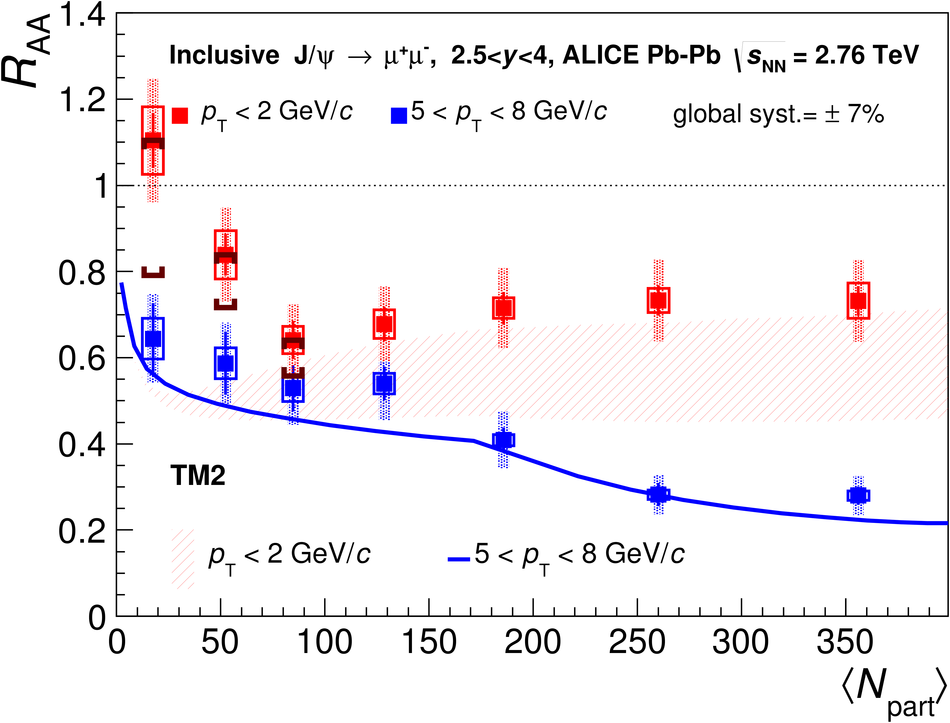
Figure 9
Inclusive J/$\Psi$ $R_{\rm AA}$ as a function of the J/$\Psi$ $p_{\rm T}$ for $2.5 < y < 4$ in the centrality class 0-90$\%$ compared to transport models (top left). The comparison is done with PHENIX results and transport models in the 0-20$\%$ (top right), 20-40$\%$ (bottom left) and 40-90$\%$ (bottom right) centrality classes The brackets shown in the lowest $p_{\rm T}$ interval for the centrality class 40-90$\%$ quantify the possible range of variation of the hadronic J/$\Psi$ $R_{\rm AA}$ for two extreme hypotheses on the photo-production contamination in the inclusive measurement Upper limits from PHENIX at high $p_{\rm T}$ are not represented. | 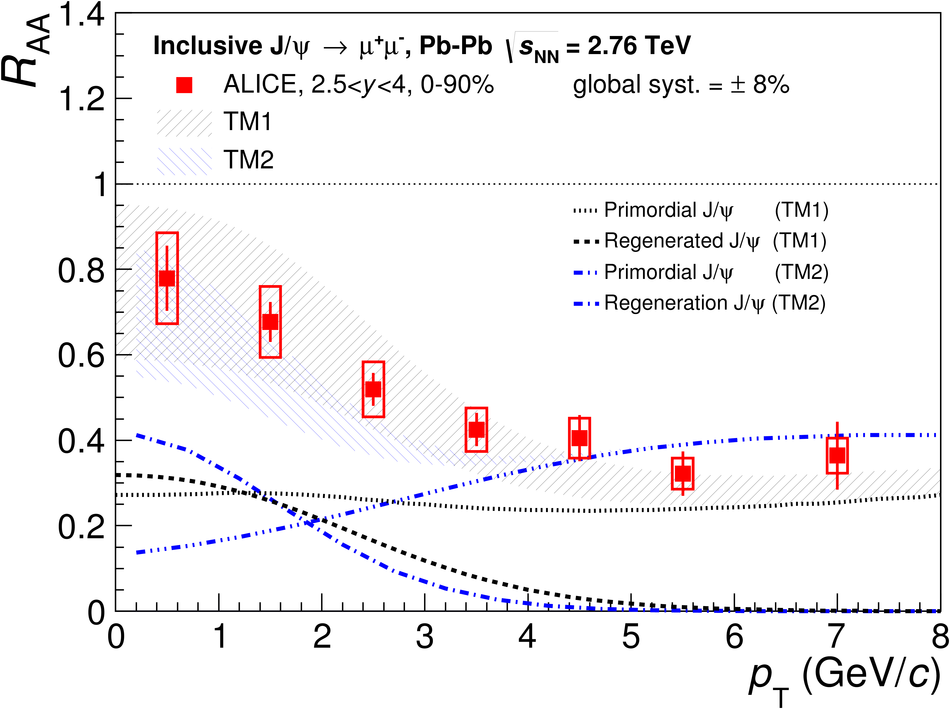 |
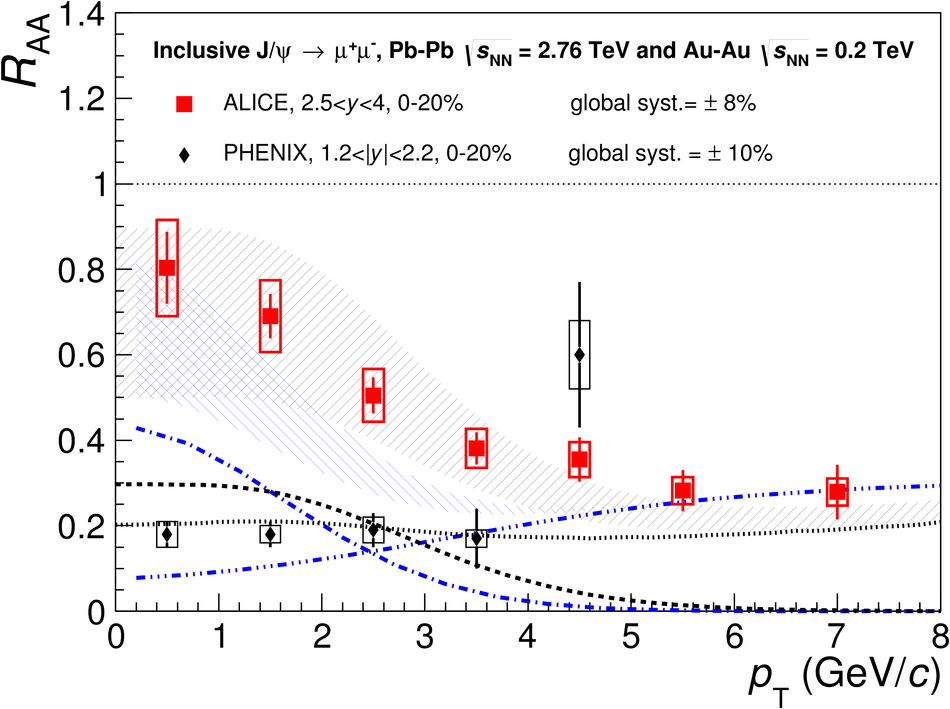
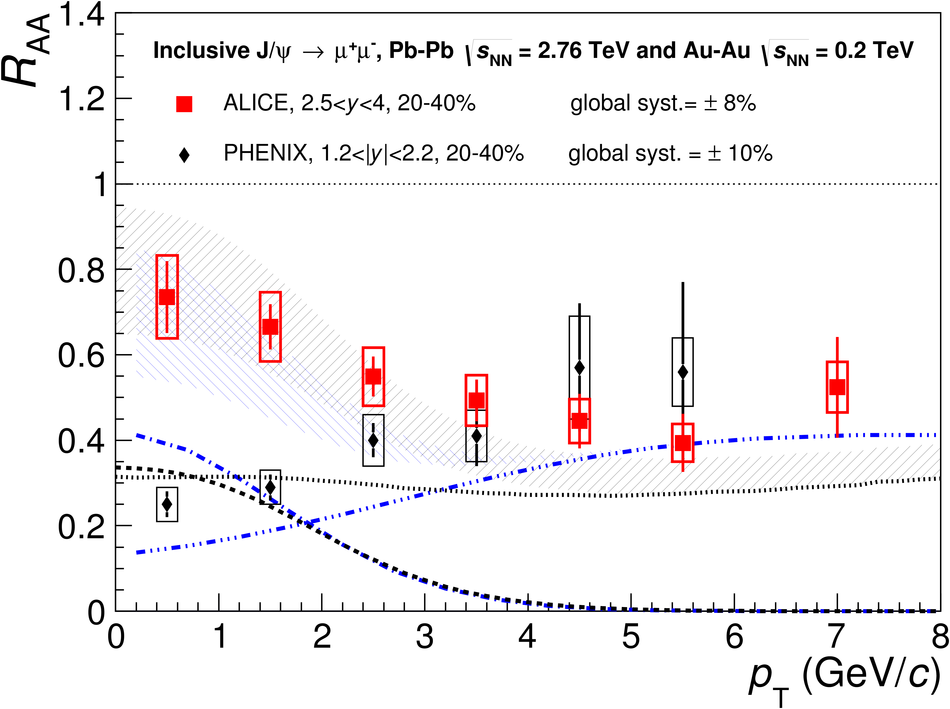
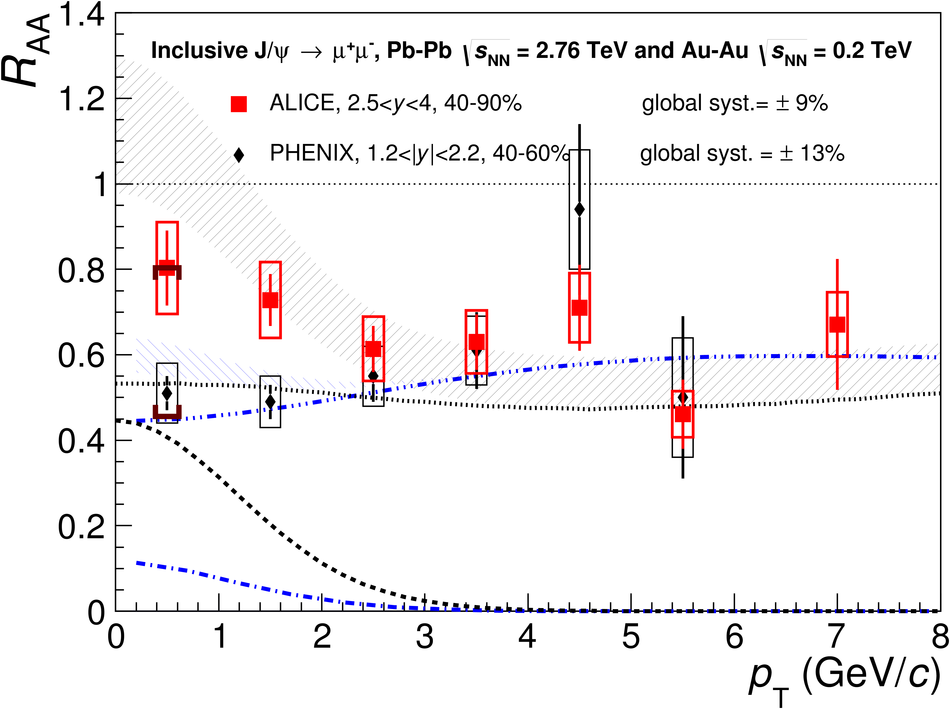
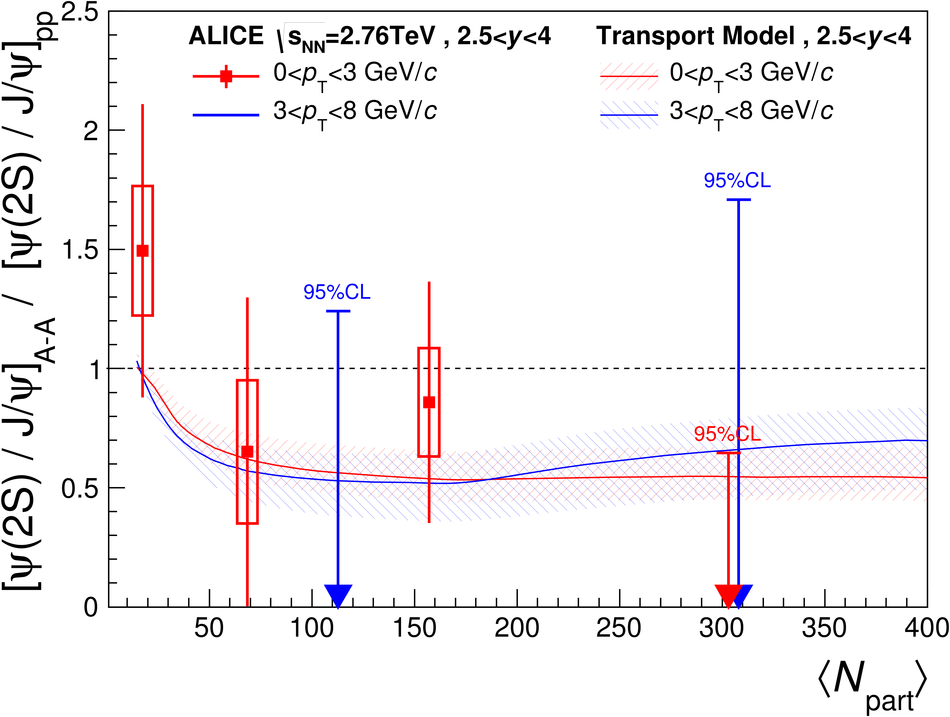
Figure 11
Inclusive [$\Psi(\rm {2S})$/J/$\Psi$] ratio measured as a function of < $N_{\rm part}$> in Pb-Pb collisions at $\sqrt{s_{\rm NN}}=2.76$ TeV for two $p_{\rm T}$ intervals, compared to NA50 results and to a theoretical calculation (left) Double ratio, as a function of $N_{\rm part}$, between the $\Psi(\rm {2S})$ and J/$\Psi$ measured in Pb-Pb at $\sqrt{s_{\rm NN}}=2.76$ TeV and pp collisions at $\sqrt{s}=7$ TeV, compared to theoretical calculations (right). | 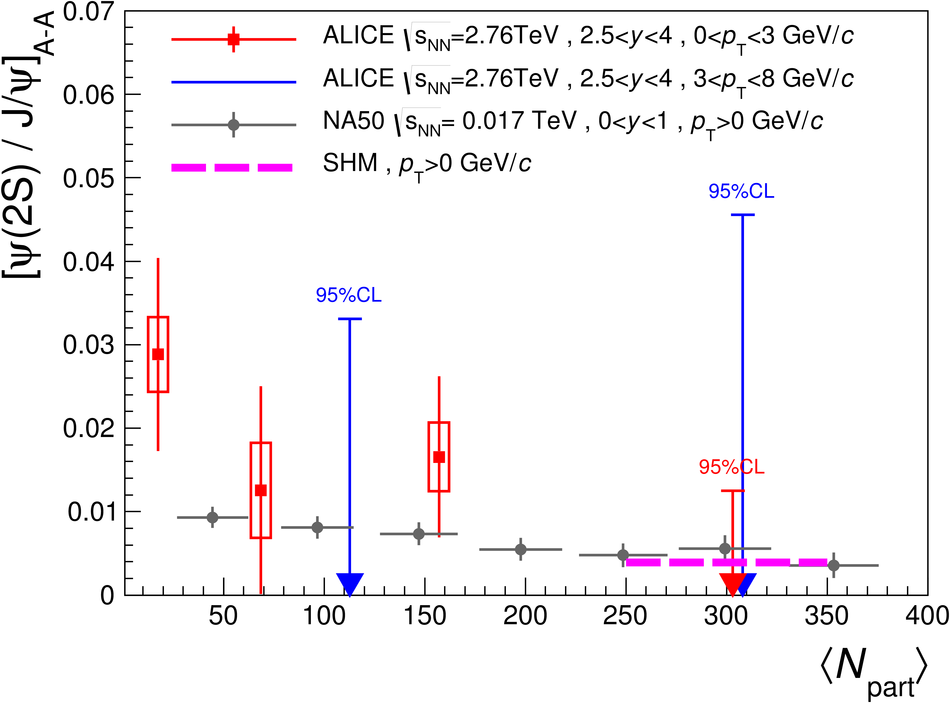 |