We have studied the transverse-momentum ($p_{\rm T}$) dependence of the inclusive J/$\psi$ production in p-Pb collisions at $\sqrt{s_{\rm NN}} = 5.02$ TeV, in three center-of-mass rapidity ($y_{\rm cms}$) regions, down to zero $p_{\rm T}$. Results in the forward and backward rapidity ranges ($2.03 <~ y_{\rm cms} <~ 3.53$ and $-4.46 <~y_{\rm cms}<~ -2.96$) are obtained by studying the J/$\psi$ decay to $\mu^+\mu^-$, while the mid-rapidity region ($-1.37 <~ y_{\rm cms} <~ 0.43$) is investigated by measuring the ${\rm e}^+{\rm e}^-$ decay channel. The $p_{\rm T}$ dependence of the J/$\psi$ production cross section and nuclear modification factor are presented for each of the rapidity intervals, as well as the J/$\psi$ mean $p_{\rm T}$ values. Forward and mid-rapidity results show a suppression of the J/$\psi$ yield, with respect to pp collisions, which decreases with increasing $p_{\rm T}$. At backward rapidity no significant J/$\psi$ suppression is observed. Theoretical models including a combination of cold nuclear matter effects such as shadowing and partonic energy loss, are in fair agreement with the data, except at forward rapidity and low transverse momentum. The implications of the p-Pb results for the evaluation of cold nuclear matter effects on J/$\psi$ production in Pb-Pb collisions are also discussed.
JHEP 06 (2015) 55
HEP Data
e-Print: arXiv:1503.07179 | PDF | inSPIRE
CERN-PH-EP-2015-030

Figure 2
Opposite-sign dielectron invariant massspectra (blue symbols) for various $p_{\rm T}$ intervals, compared to the background (black curve) estimated through mixed events The background is scaled to match the data in the mass ranges $2.0< m_{{\rm e}^+{\rm e}^-}< 2.5$ GeV/$c^2$ and $3.2< m_{{\rm e}^+{\rm e}^-}< 3.7$ GeV/$c^2$. | 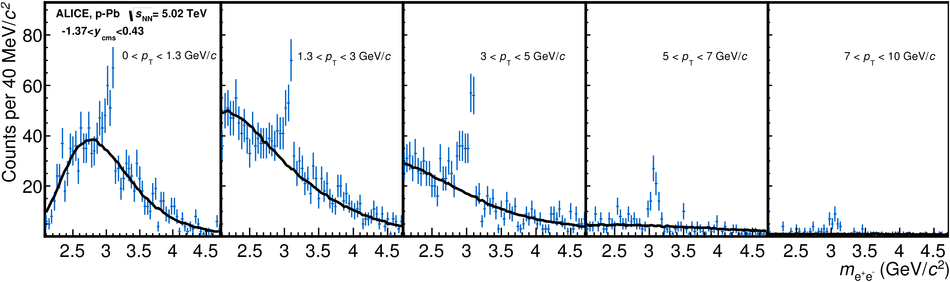 |
Figure 3
The opposite-sign dimuon invariant mass spectra for the various $p_{\rm T}$ bins, relative to the p--Pb data sample (blue symbols) The fits shown in this Figure (blue curves) were performed by using the sum of extended Crystal Ball functions for the $\rm J/\psi$ and $\psi(\rm{2S})$ signals, and a variable width Gaussian for the background. The signal and background components are shown separately as red curves.
| 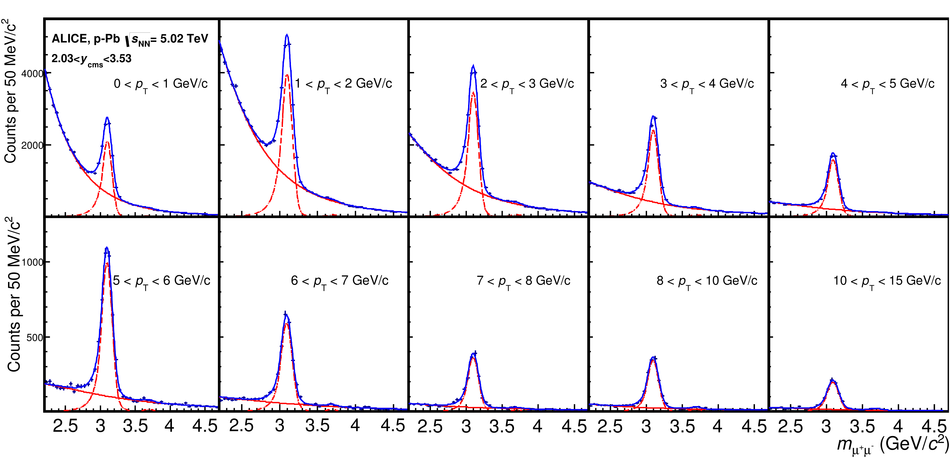 |
Figure 4
$p_{\rm T}$-differential inclusive $\rm J/\psi$ cross sections for the various rapidity regions under study The vertical error bars correspond to the statistical uncertainties, while open boxes represent the uncorrelated systematic uncertainties and the shaded boxes the quadratic sum of the fully and partially correlated ones. The numerical values can be read in Table 2 The horizontal bars correspond to the widths of the $p_{\rm T}$ bins.
| 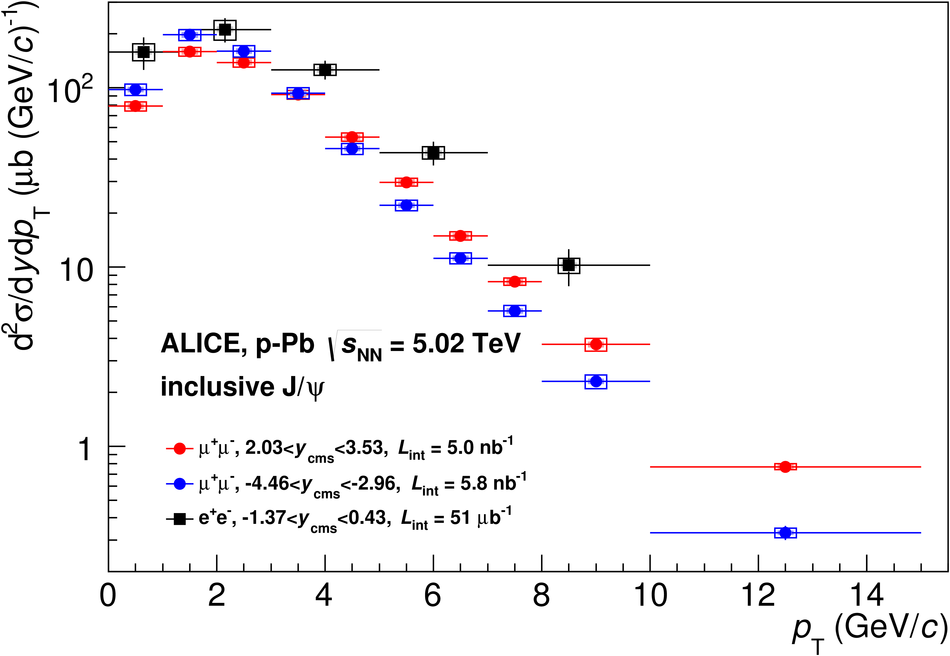 |
Figure 5
The $\rm J/\psi$ nuclear modification factor as a function of $p_{\rm T}$ at backward (top), mid (center) and forward (bottom) rapidities Statistical uncertainties are represented by vertical error bars, while open boxes correspond to uncorrelated uncertainties and the shaded areas to uncertaintiespartially correlated in $p_{\rm T}$. The boxes around $R_{\rm pPb}=1$ show the size of the correlated uncertainties The horizontal bars correspond to the widths of the $p_{\rm T}$ bins. Results from various models are also shown, including a pure shadowing calculation based on the EPS09 parameterization, a CGC-inspired model, and the results of the coherent energy loss calculation, with or without the inclusion of an EPS09 shadowing contribution. |  |


Figure 6
The estimate of the $\pt$-dependence of CNM effects in Pb--Pb, calculated as $R^2_{\mathrm{pPb}}$ for mid-rapidity data (top) and as $R_{\mathrm{pPb}} \times R_{\mathrm{Pbp}}$ (bottom) at forward rapidity. The quantities are compared to $R_{\mathrm{PbPb}}$ measured in Pb--Pb collisions in the (approximately) corresponding $y$-ranges. The vertical error bars correspond to the statistical uncertainties, the open boxes (shaded areas) represent $p_{\rm T}$-uncorrelated (partially correlated) systematic uncertainties, while the boxes around $R_{\rm pPb}=1$ show the size of the correlated uncertainties. The horizontal bars correspond to the widths of the $\pt$ bins. The Pb--Pb points in the bottom panel were slightly displaced in $\pt$, to improve visibility. | 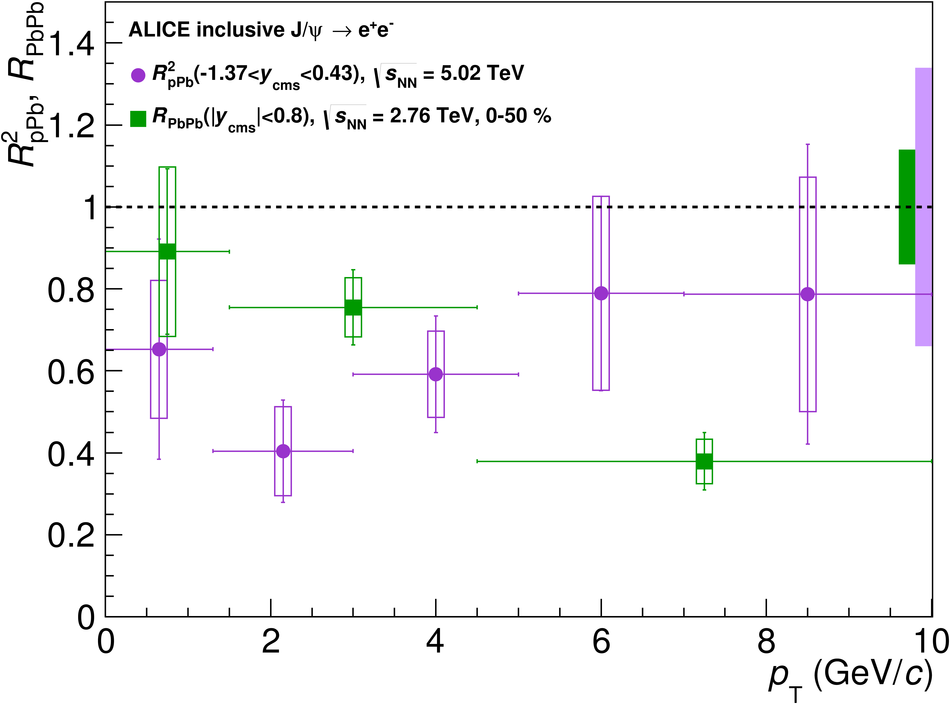 |
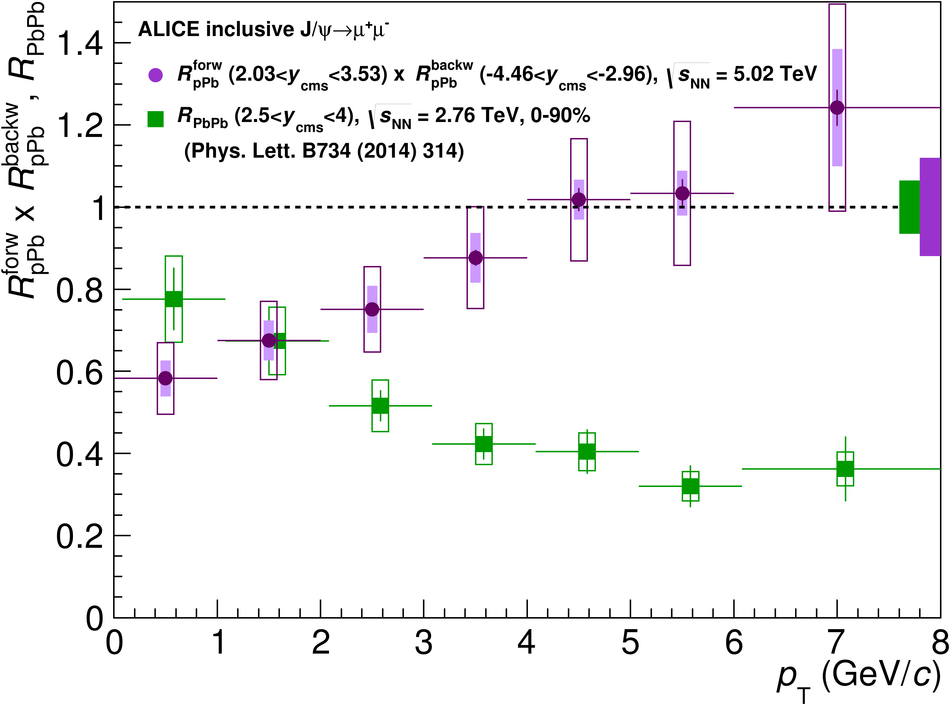
Figure 7
The ratio between $R_{\mathrm{PbPb}}$ for inclusive $\jpsi$ at forward rapidity and the product $R_{\mathrm{pPb}} \times R_{\mathrm{Pbp}}$ of the nuclear modification factors at forward and backward rapidity. None of the uncertainties cancels out in the ratio. Statistical uncertainties are shown as vertical error bars, while the boxes around the points represent a quadratic combination of uncorrelated and partially correlated systematic uncertainties. The box around $S_{\rm J/\psi}=1$ corresponds to correlated uncertainties The horizontal bars coincide with the widths of the $\pt$ bins. | 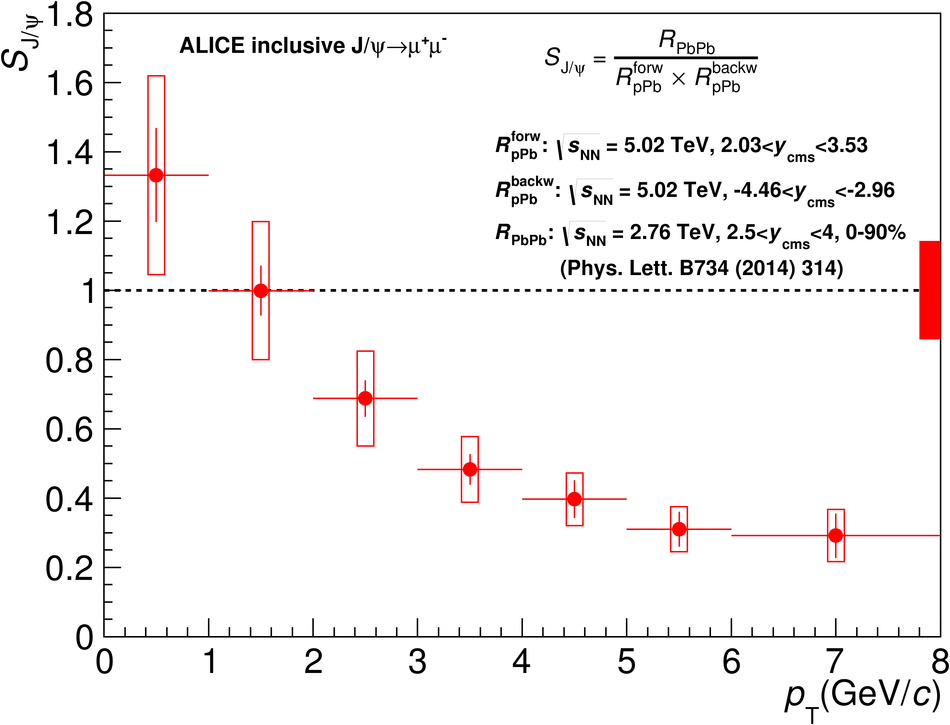 |