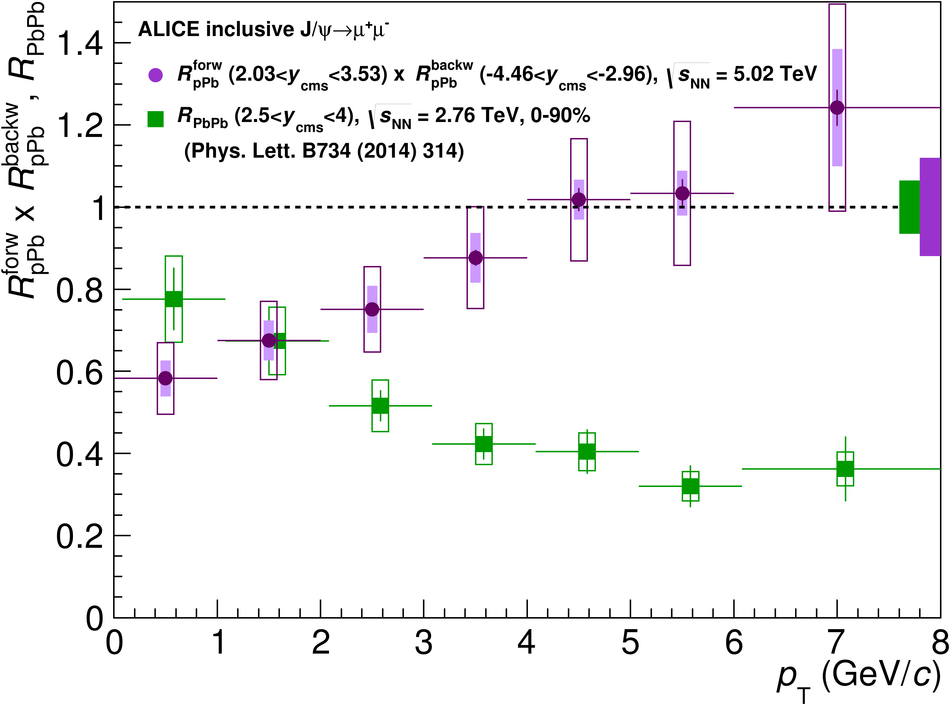
The estimate of the $\pt$-dependence of CNM effects in Pb--Pb, calculated as $R^2_{\mathrm{pPb}}$ for mid-rapidity data (top) and as $R_{\mathrm{pPb}} \times R_{\mathrm{Pbp}}$ (bottom) at forward rapidity. The quantities are compared to $R_{\mathrm{PbPb}}$ measured in Pb--Pb collisions in the (approximately) corresponding $y$-ranges. The vertical error bars correspond to the statistical uncertainties, the open boxes (shaded areas) represent $p_{\rm T}$-uncorrelated (partially correlated) systematic uncertainties, while the boxes around $R_{\rm pPb}=1$ show the size of the correlated uncertainties. The horizontal bars correspond to the widths of the $\pt$ bins. The Pb--Pb points in the bottom panel were slightly displaced in $\pt$, to improve visibility. | 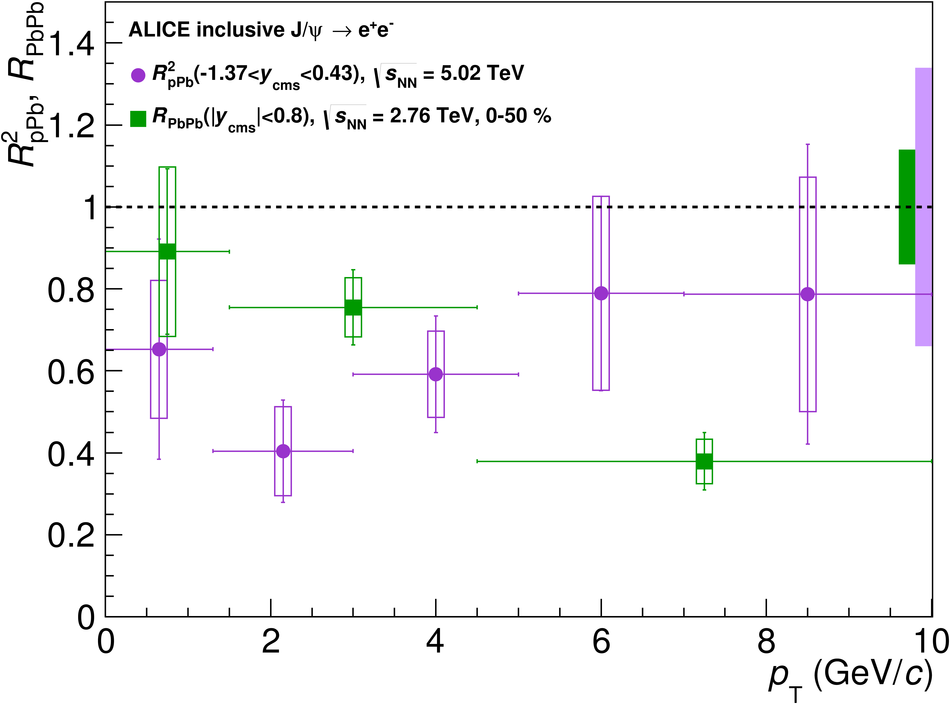 |