Azimuthally differential pion femtoscopy in Pb-Pb collisions at $\sqrt{s_{\rm NN}}=2.76$ TeV

We present the first azimuthally differential measurements of the pion source size relative to the second harmonic event plane in Pb-Pb collisions at a center-of-mass energy per nucleon-nucleon pair of $\sqrt{s_{\rm NN}}=2.76$ TeV. The measurements have been performed in the centrality range 0-50% and for pion pair transverse momenta $0.2 <~ k_{\rm T} <~ 0.7$ GeV/$c$. We find that the $R_{\rm side}$ and $R_{\rm out}$ radii, which characterize the pion source size in the directions perpendicular and parallel to the pion transverse momentum, oscillate out of phase, similar to what was observed at the Relativistic Heavy Ion Collider (RHIC). The final-state source eccentricity, estimated via $R_{\rm side}$ oscillations, is found to be significantly smaller than the initial-state source eccentricity, but remains positive -- indicating that even after a stronger expansion in the in-plane direction, the pion source at the freeze-out is still elongated in the out-of-plane direction. The 3+1D hydrodynamic calculations are in qualitative agreement with observed centrality and transverse momentum $R_{\rm side}$ oscillations, but systematically underestimate the oscillation magnitude.


Phys. Rev. Lett. 118 (2017) 222301
HEP Data
e-Print: arXiv:1702.01612 | PDF | inSPIRE
CERN-EP-2017-013

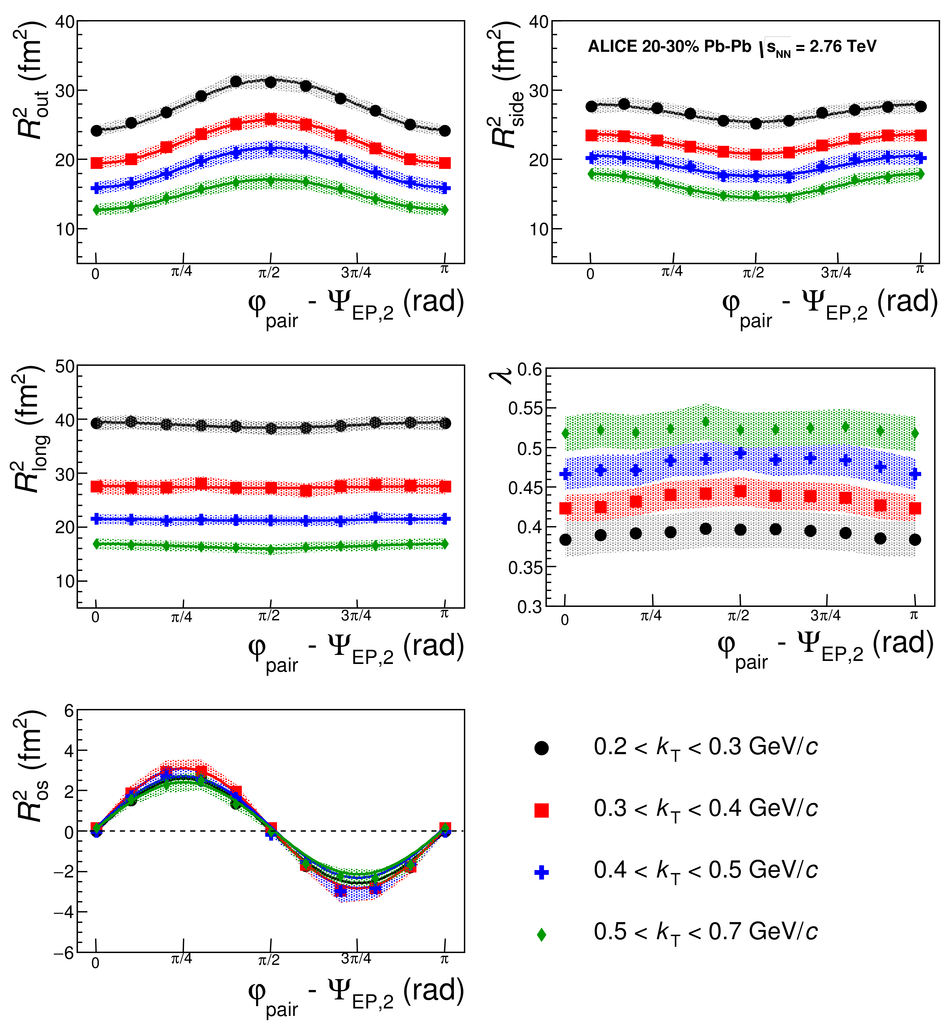
Figure 1

The azimuthal dependence of $R^{2}_{\rm out}$, $R^{2}_{\rm side}$, $R^{2}_{\rm long}$, $R^{2}_{\rm os}$, and $\lambda$ as a function of $\Delta\varphi=\rm{\varphi_{pair}}-\Psi_{EP,2}$ for the centrality 20-30% and $k_{\rm T}$ ranges 0.2-0.3, 0.3-0.4, 0.4-0.5, and 0.5-0.7 GeV/$c$. Bands indicate the systematic errors. The results are not corrected for the event plane resolution of about 85-95%.

Figure 2

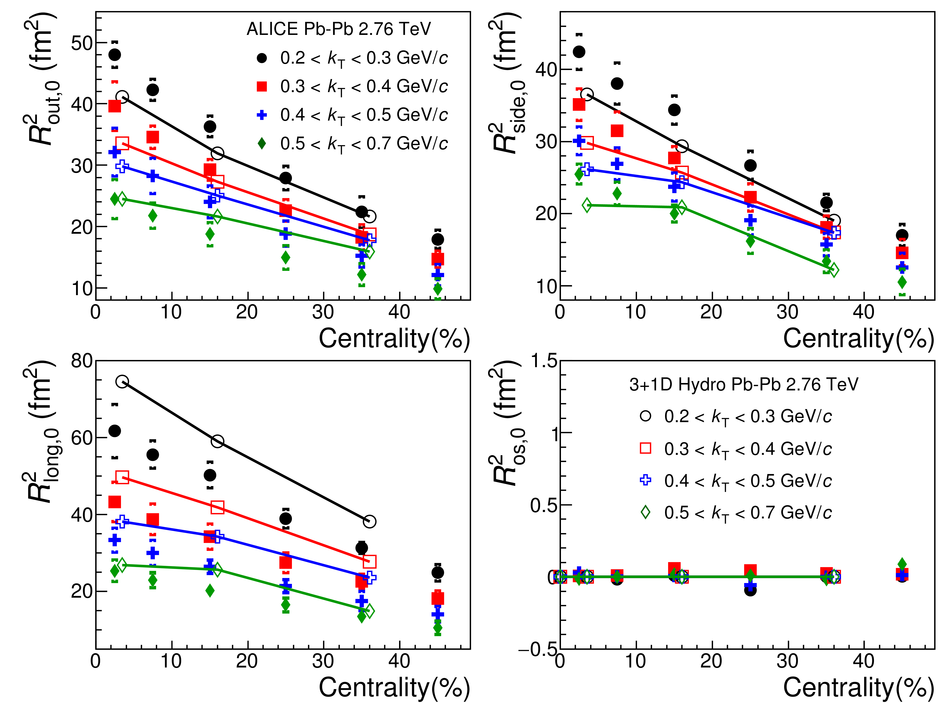
The average radii $R^{2}_{\rm out,0} $, $R^{2}_{\rm side,0}$, $R^{2}_{\rm long,0}$, and $R^{2}_{\rm os,0}$ as a function of centrality for different $\kt$ ranges compared to hydrodynamical calculations [32]. Square brackets indicate the systematic errors.

Figure 3

Amplitudes of the relative radius oscillations $R^{2}_{\rm out,2}/R^{2}_{\rm side,0}$, $R^{2}_{\rm side,2}/R^{2}_{\rm side,0}$, $R^{2}_{\rm long,2}/R^{2}_{\rm long,0}$, and $R^{2}_{\rm os,2}/R^{2}_{\rm side,0}$ versus centrality for the $k_{\rm T}$ ranges 0.2-0.3, 0.3-0.4, 0.4-0.5, and 0.5-0.7 $\gevc$. The error bars indicate the statistical uncertainties and the square brackets show the systematic errors. The STAR data points, for 0-5%, 5-10%, 10-20%, 20-30% and 30-80% Au-Au collisions, are slightly shifted for clarity

Figure 4

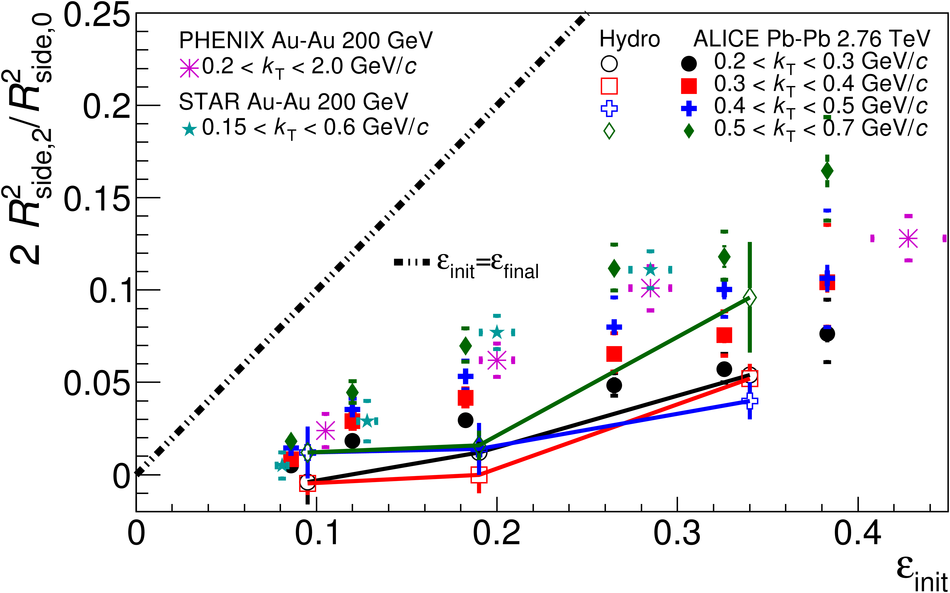
An estimate of freeze-out eccentricity $2 R^{2}_{\rm side,2}/R^{2}_{\rm side,0}$ for different $k_{\rm t}$ ranges vs initial state eccentricity from Monte Carlo Glauber model [35] for six centrality ranges, 0-5%, 5-10%, 10-20%, 20-30%, 30-40%, and 40-50%. The dashed line indicates $\varepsilon_{\rm final}=\varepsilon_{\rm init}$. Square brackets indicate systematic errors.