V0A ring1 signal distributions The top left panel shows the distribution for MB events together witha NBD-Glauber fit. The remaining panels show the distributions andmean values for centrality classes selected with ZNA. These arecompared to those obtained by the convolution of the ${\cal P}(\Ncoll| cent_{\rm ZNA})$ distributions from the SNM with the NBD from the NBD-Glauber fit to V0A ring1. Data are also compared to thedistributions obtained with an unfolding procedure, where the $N_{coll}$ distributions have been fitted to the data using the parameters fromthe NBD-Glauber fit. The bottom right panel compares the mean valuesof these distributions as a function of the centrality | 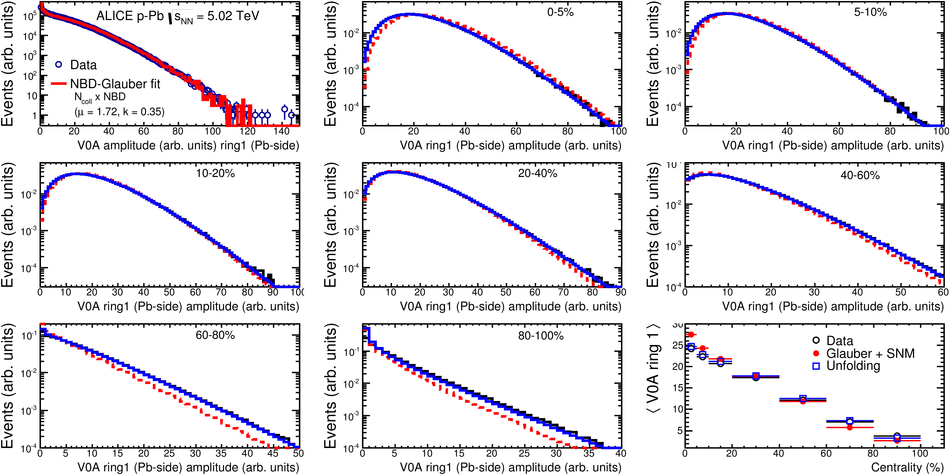 |