Azimuthal anisotropy of charged jet production in $\sqrt{s_{\rm NN}}$ = 2.76 TeV Pb-Pb collisions

We present measurements of the azimuthal dependence of charged jet production in central and semi-central $\sqrt{s_{\mathrm{NN}}}$ = 2.76 TeV Pb-Pb collisions with respect to the second harmonic event plane, quantified as $v_{2}^{\mathrm{ch~jet}}$. Jet finding is performed employing the anti-$k_{\mathrm{T}}$ algorithm with a resolution parameter $R$ = 0.2 using charged tracks from the ALICE tracking system. The contribution of the azimuthal anisotropy of the underlying event is taken into account event-by-event. The remaining (statistical) region-to-region fluctuations are removed on an ensemble basis by unfolding the jet spectra for different event plane orientations independently. Significant non-zero $v_{2}^{\mathrm{ch~jet}}$ is observed in semi-central collisions (30-50\% centrality) for 20 $<~$ $p_{\mathrm{T}}^{\rm ch~jet}$ $<~$ 90 ${\mathrm{GeV}\kern-0.05em/\kern-0.02em c}$. The azimuthal dependence of the charged jet production is similar to the dependence observed for jets comprising both charged and neutral fragments, and compatible with measurements of the $v_2$ of single charged particles at high $p_{\mathrm{T}}$. Good agreement between the data and predictions from JEWEL, an event generator simulating parton shower evolution in the presence of a dense QCD medium, is found in semi-central collisions.


Phys.Lett. B 753 (2016) 511-525
HEP Data
e-Print: arXiv:1509.07334 | PDF | inSPIRE
CERN-PH-EP-2015-258

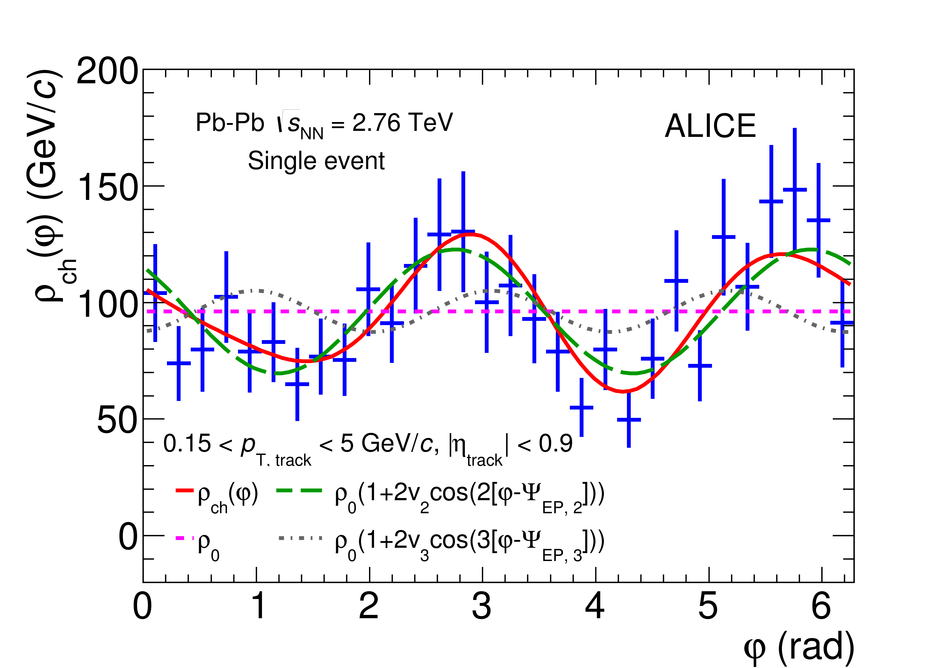
Figure 1

Transverse momentum density of charged tracks as a function of azimuthal angle for a single event from the most central 0-5% event class. Data points (blue) are given with statistical uncertainties only. The red curve is the fit of Eq.[5] to the distribution, the green and gray curves, obtained from the fit of Eq.[5] as well, show the independent contributions of $v_2$ and $v_3$ to $\rho_{\rm ch}(\phi)$. The dashed magenta line is the normalization constant $\rho_0$.

Figure 2

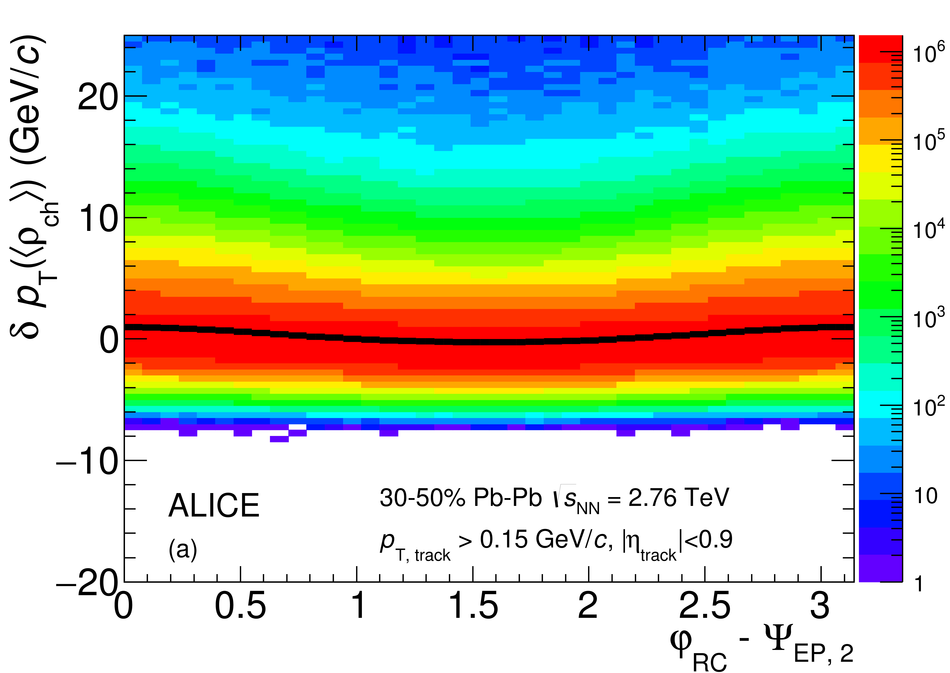
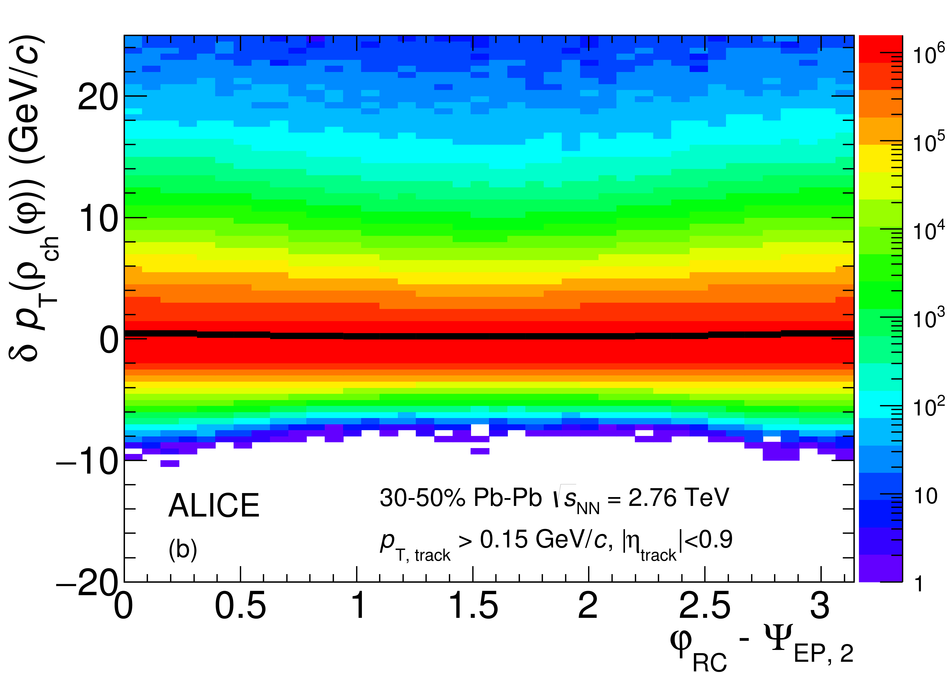
The $\delta p_{\rm T}$ distribution (Eq. [8]) from the random cone (RC) procedure as function of cone azimuthal angle $\varphi_{\mathrm{RC}}$ relative to the event plane. In panel (a) the azimuthally-averaged background $\langle\rho_{\rm ch}\rangle$ has been subtracted; in panel (b) the azimuthally dependent $\rho_{\rm ch}(\phi)$ from an event-by-event fit of the $\pt$-density with Eq. [5]. The solid black line represents the mean of the $\delta p_{\rm T}$ distribution.

Figure 3

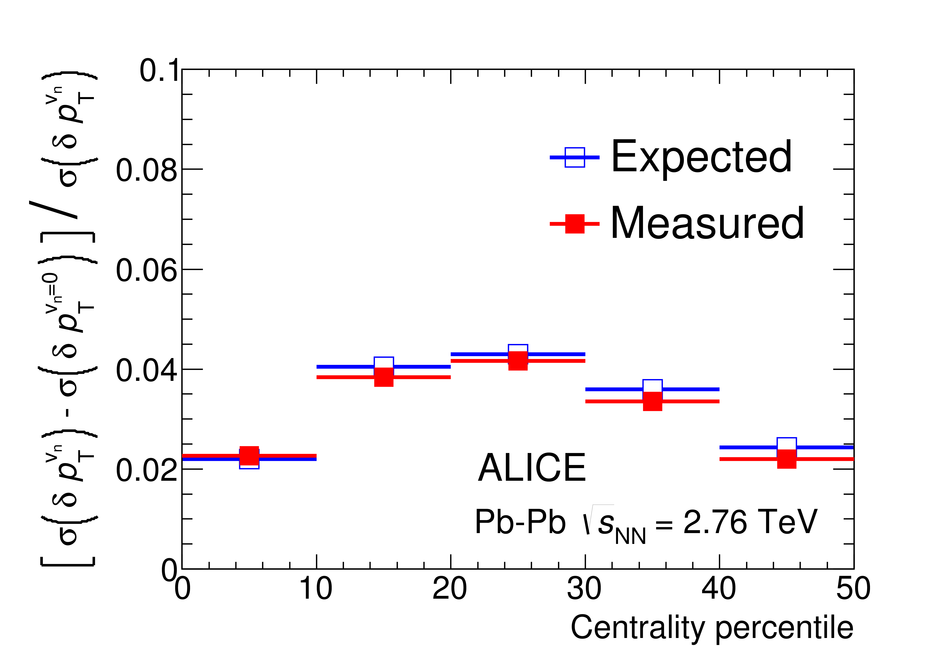
Centrality dependence of the measured and expected relative change in the $\delta p_{\rm T}$ distribution width from using the azimuthally dependent $\rho_{\rm ch local}$ instead of the median $\langle\rho_{\rm ch}\rangle$. The blue points give the expected reduction from simple assumptions about the behavior of charged particle spectra and flow harmonics $v_n$ (following Eq.[9] and [10]). The red points use the measured widths from $\delta p_{\rm T}$ distributions directly. Statistical uncertainties are smaller than the marker size.

Figure 4

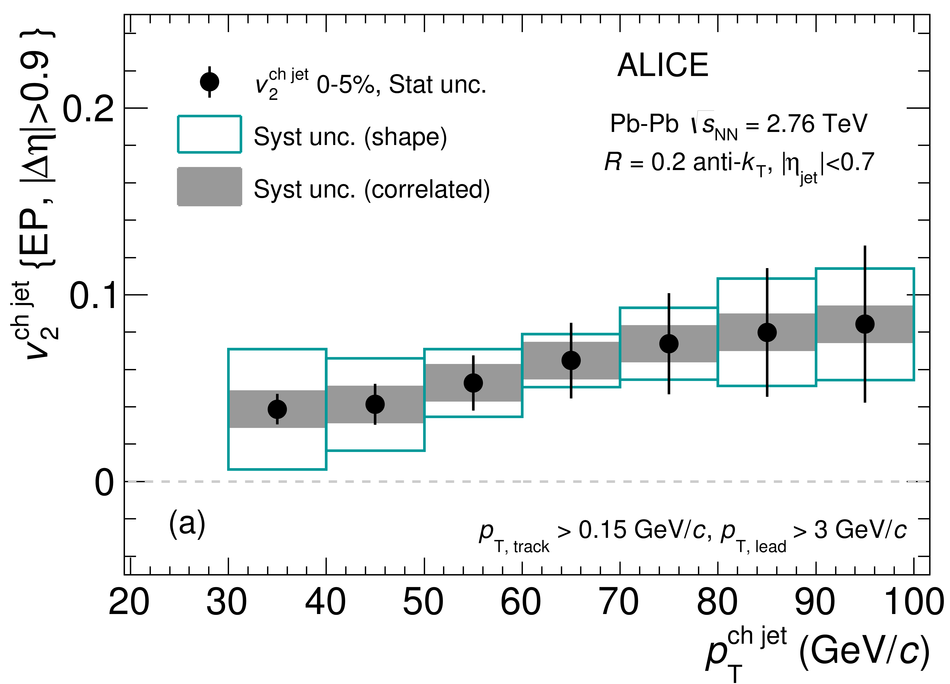
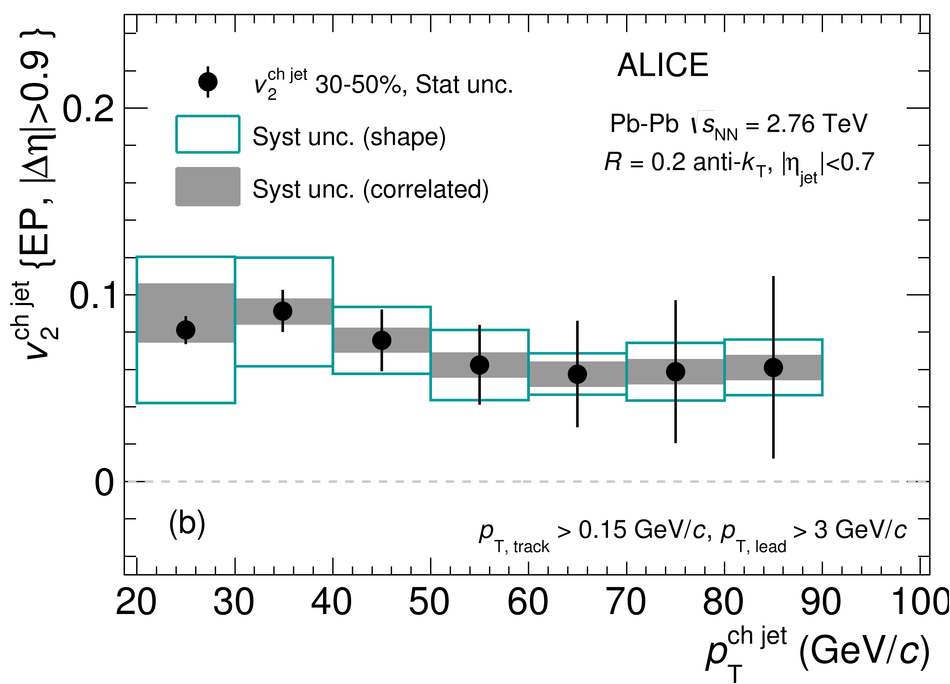
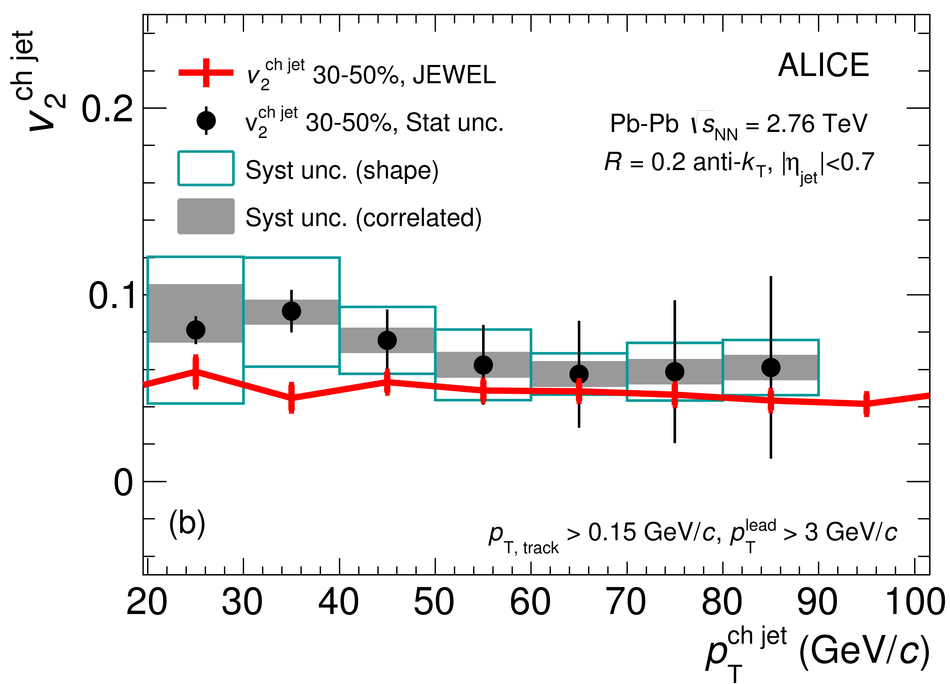
Second-order harmonic coefficient $v_2^{\rm ch jet}$ as function a of $p_{\rm T}^{\rm ch jet}$ for 0-5% (a) and 30-50% (b) collision centrality. The error bars on the points represent statistical uncertainties, the open and shaded boxes indicate the shape and correlated uncertainties (as explained in Sec.2.5).

Figure 5

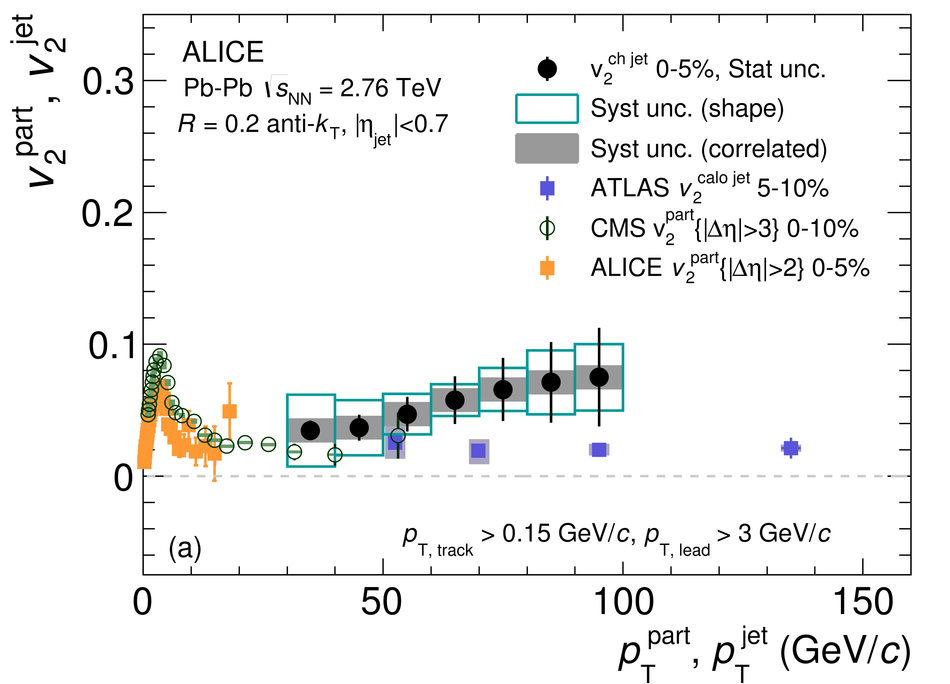
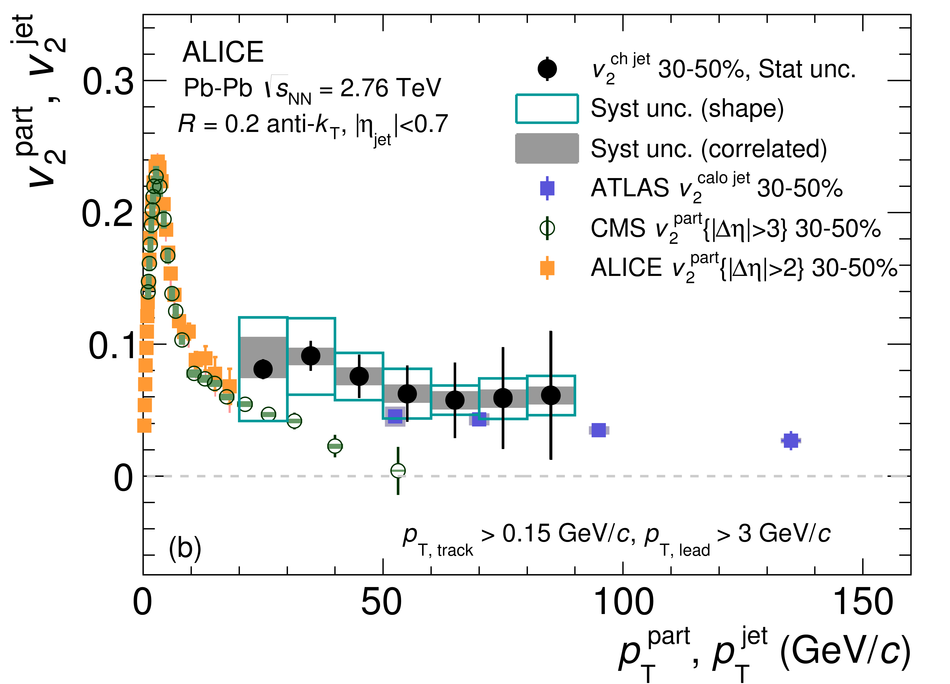
Elliptic flow coefficient $v_2$ of charged particles (red, green) and $R = 0.2$ full jets (comprising both charged and neutral fragments) measured within $\vert \eta \vert < 2.1$ (blue) superimposed on the results from the current analysis of $R = 0.2$ charged jets $v_2^{\rm ch jet}$. In all measurements, statistical errors are represented by bars and systematic uncertainties by shaded or open boxes Note that the same parton $\pt$ corresponds to different single particle, full jet and charged jet $\pt$. ATLAS $v_2^{\rm calo jet}$ and CMS $v_2$ from [22,58] in 30-50 % centrality are the weighted arithmetic means of measurements in 10% centrality intervals using the inverse square of statistical uncertainties as weights.

Figure 6

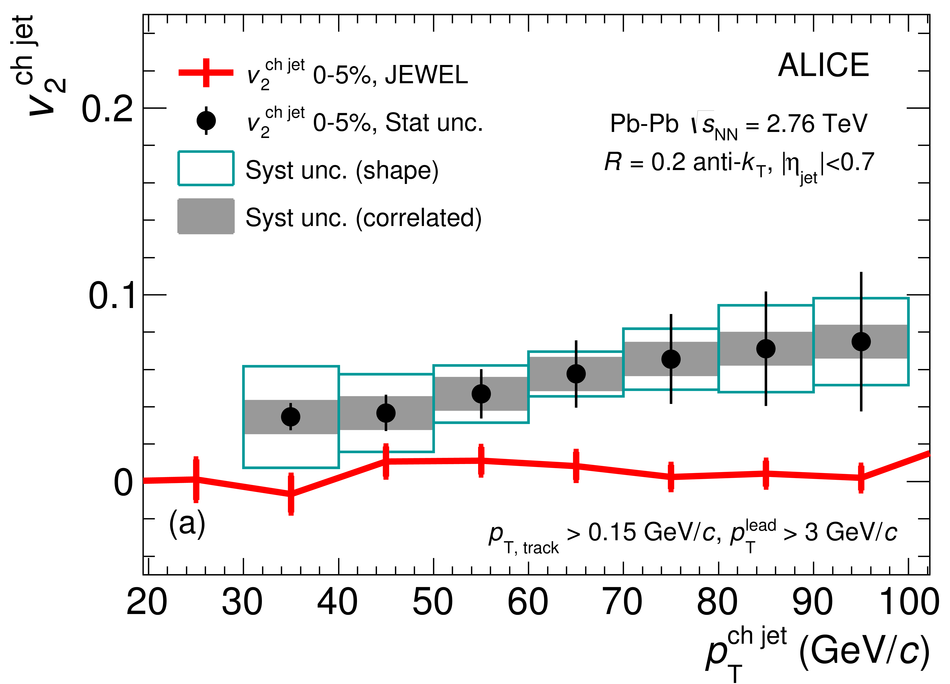
$v_2^{\rm ch jet}$ of $R = 0.2$ charged jets obtained from the JEWEL Monte Carlo (red) for central (a) and semi-central collisions (b) compared to data. JEWEL data points are presented with only statistical uncertainties.