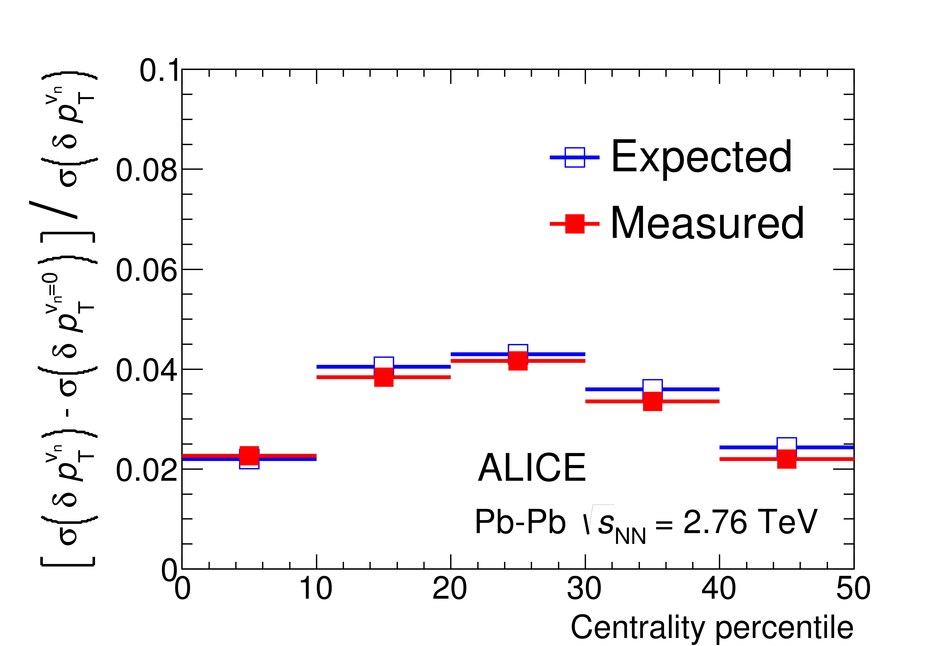
Centrality dependence of the measured and expected relative change in the $\delta p_{\rm T}$ distribution width from using the azimuthally dependent $\rho_{\rm ch local}$ instead of the median $\langle\rho_{\rm ch}\rangle$. The blue points give the expected reduction from simple assumptions about the behavior of charged particle spectra and flow harmonics $v_n$ (following Eq.[9] and [10]). The red points use the measured widths from $\delta p_{\rm T}$ distributions directly. Statistical uncertainties are smaller than the marker size.
|  |