The production cross sections of the prompt charmed mesons D$^0$, D$^+$, D$^{*+}$ and D$_s$ were measured at mid-rapidity in p-Pb collisions at a centre-of-mass energy per nucleon pair $\sqrt{s_{\rm NN}}=5.02$ TeV with the ALICE detector at the LHC. D mesons were reconstructed from their decays D$^0\rightarrow{\rm K}^-\pi^+$, D$^+\rightarrow{\rm K}^-\pi^+\pi^+$, D$^{*+}\rightarrow D^0\pi^+$, D$_s^+\rightarrow\phi\pi^+\rightarrow{\rm K}^-{\rm K}^+\pi^+$, and their charge conjugates. The $p_{\rm T}$-differential production cross sections were measured at mid-rapidity in the interval $1<~p_{\rm T}<~24$ GeV/$c$ for D$^0$, D$^+$ and D$^{*+}$ mesons and in $2<~p_{\rm T}<~12$ GeV/$c$ for D$_s$ mesons, using an analysis method based on the selection of decay topologies displaced from the interaction vertex. The production cross sections of the D$^0$, D$^+$ and D$^{*+}$ mesons were also measured in three $p_{\rm T}$ intervals as a function of the rapidity $y_{\rm cms}$ in the centre-of-mass system in $-1.26<~y_{\rm cms}<~0.34$. In addition, the prompt D$^0$ cross section was measured in pp collisions at $\sqrt{s}=7$ TeV and p-Pb collisions at $\sqrt{s_{\rm NN}}=5.02$ TeV down to $p_{\rm T}=0$ using an analysis technique that is based on the estimation and subtraction of the combinatorial background, without reconstruction of the D$^0$ decay vertex. The nuclear modification factor $R_{\rm pPb}(p_{\rm T})$, defined as the ratio of the $p_{\rm T}$-differential D-meson cross section in p-Pb collisions and that in pp collisions scaled by the mass number of the Pb nucleus, was calculated for the four D-meson species and found to be compatible with unity within experimental uncertainties. The results are compared to theoretical calculations that include cold-nuclear-matter effects and to transport model calculations incorporating the interactions of charm quarks with an expanding deconfined medium.
Phys. Rev. C 94 (2016) 054908
HEP Data
e-Print: arXiv:1605.07569 | PDF | inSPIRE
CERN-EP-2016-127
Figure 1
Distributions of the invariant mass for $\Dzero$ (top left), $\Dplus$ (top right), $\Ds$ (bottom left) candidates and their charge conjugates and of the mass difference for $\Dstar$ (bottom right) candidates (and charge conjugates) in the rapidity interval $|y_{\rm lab}|< y_{\mathrm{fid}}(\pt)$ in p--Pb collisions. The dashed lines represent the fit to the background while the solid lines represent the total fit function. One $\pt$ interval is shown for each species: $1< \pt< 2 \gevc$ for $\Dzero$, $5< \pt< 6 \gevc$ for $\Dplus$, $8< \pt< 12 \gevc$ for $\Ds$ and $16< \pt< 24 \gevc$ for $\Dstar$. | 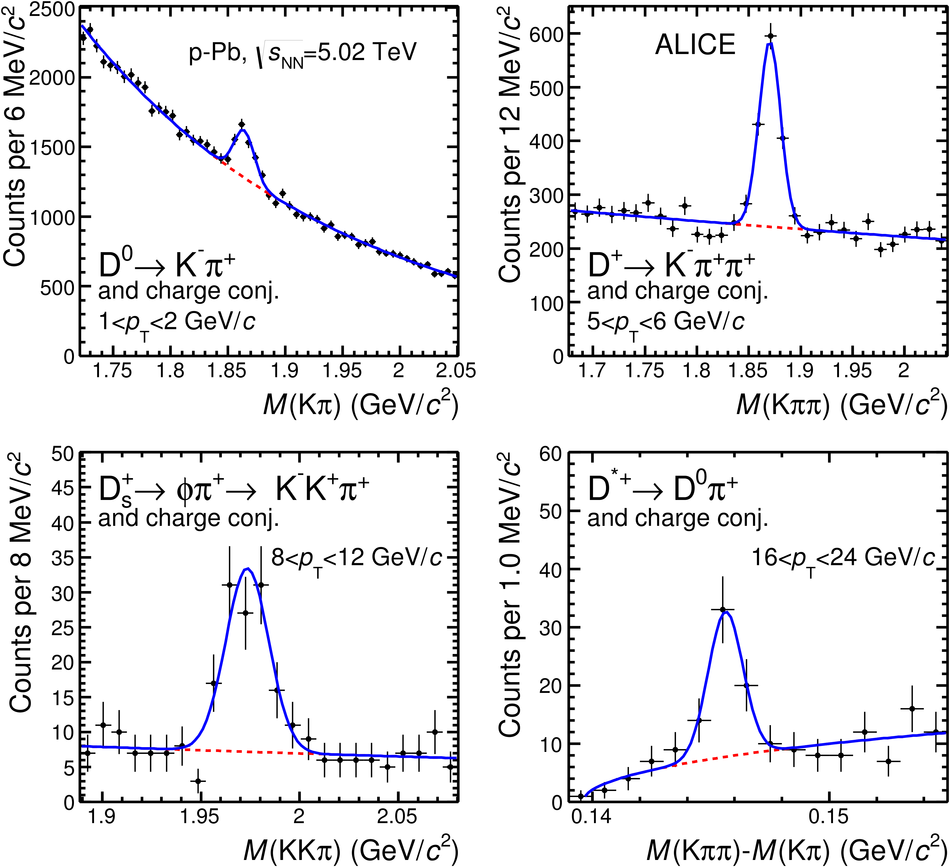 |
Figure 2
Distributions of the invariant mass for $\Dzero$ (left column), $\Dplus$ (middle column) candidates and their charge conjugates and of the mass difference for $\Dstar$ (right column) candidates (and charge conjugates) in p--Pb collisions in the rapidity intervals $|y_{\rm lab}| < 0.1 $ (top row) and $-0.8 < y_{\mathrm{lab}} < -0.4$ ($-0.7 < y_{\mathrm{lab}} < -0.4$ for $\pt< 5 \gev/c$) (bottom row). The dashed lines represent the fit to the background while the solid lines represent the total fit function. One $\pt$ interval is shown for each species: $2< \pt< 5 \gevc$ for $\Dzero$, $5< \pt< 8 \gevc$ for $\Dplus$ and $8< \pt< 16 \gevc$ for $\Dstar$. | 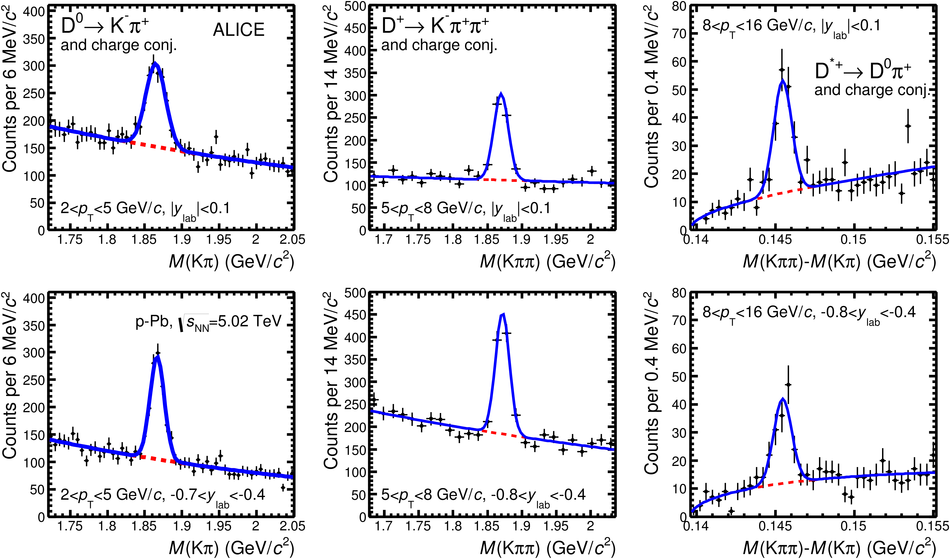 |
Figure 3
Product of acceptance and efficiency for $\Dzero$ mesons as a function of $\pt$ (left) and as a function of $y_{\rm lab}$ (right). In the left panel, efficiencies are shown for prompt $\Dzero$ with (solid line) and without (dashed line) PID selection applied, and feed-down $\Dzero$ (dotted line). In the right panel, the ${\rm Acc}\times\epsilon$ values are shown for prompt $\Dzero$ mesons for the three $\pt$ intervals considered in the analysis as a function of rapidity. | 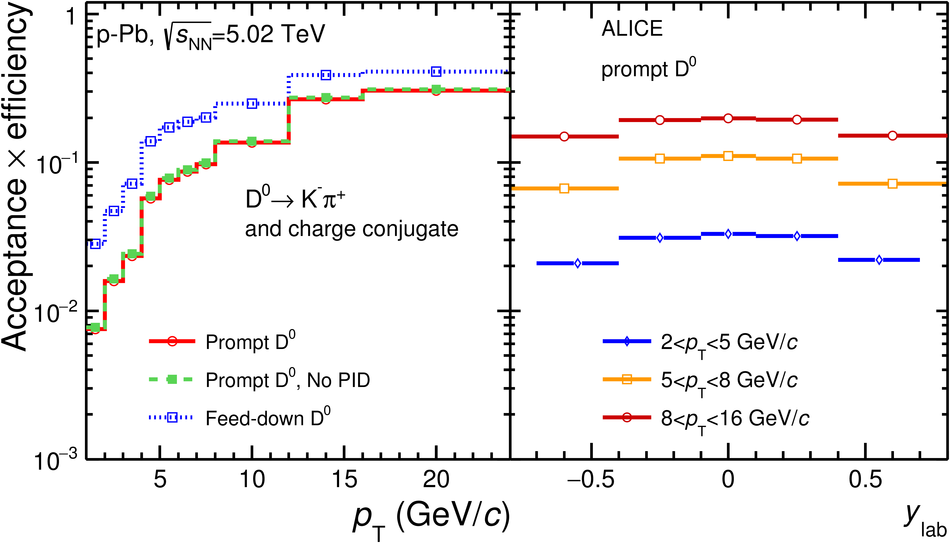 |
Figure 4
Left: Examples of fits to $\Dzero$ (top), $\Dplus$ (middle) and $\Dstar$ (bottom) impact-parameter distributions in the $\pt$ intervals$3< \pt< 4 \gevc$, $5< \pt< 6 \gevc$ and $6< \pt< 8 \gevc$, respectively The curves show the fit functions describing the prompt, feed-down and background contributions, as well as their sum, as described in the text Right: fraction of prompt $\Dzero$ (top), $\Dplus$ (middle) and $\Dstar$ (bottom) raw yield as a function of $\pt$ compared to the FONLL-based approach The results from the data-driven method are shown as square markers with theerror bars (boxes) representing the statistical (systematic) uncertainty The arrow in the interval $1< \pt< 2 \gev/c$ represents the minimum value within a 95% confidence level The central values of $f_{\rm prompt}$ from the FONLL-based approach are shownby the dashed line and their uncertainty by the red boxes. | 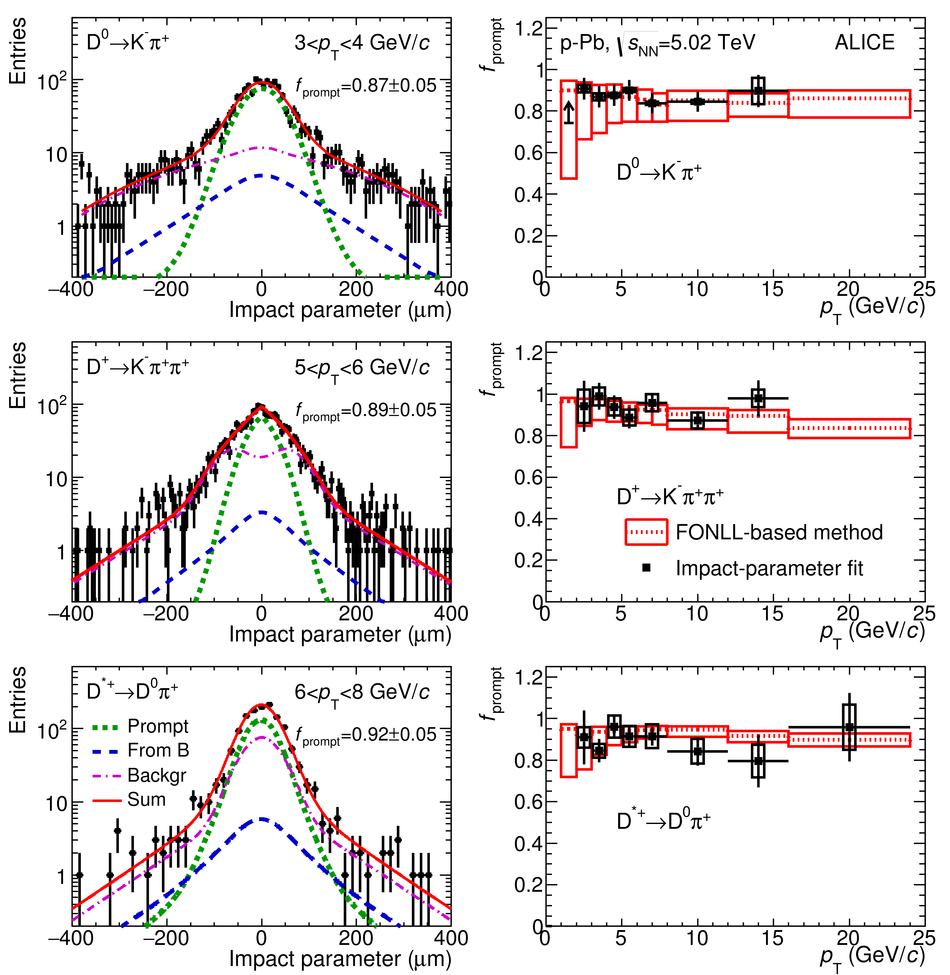 |
Figure 5
Invariant-mass distributions of $\DtoKpi$ candidates (andcharge conjugates) in pp collisions at $\sqrts=7 \TeV$ fortwo $\pt$ intervals: $0< \pt< 1 \gev/c$ (top panels) and $1< \pt< 2 \gev/c$(bottom panels). For both $\pt$ intervals, the left panels displaythe invariant-mass distribution of all ULS K$\pi$ pairs together with thebackground distributions estimated with the LS, event-mixing andtrack-rotation techniques. The middle and right panels show the invariant-massdistributions after subtraction of the background from the track-rotationand LS techniques. Fit functions are superimposed. |  |
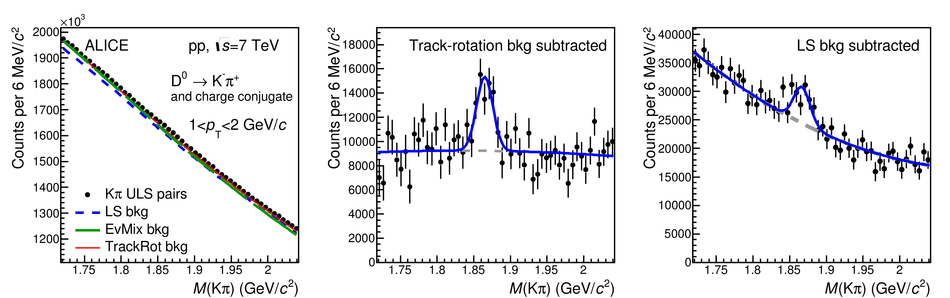
Figure 6
Invariant-mass distributions of $\DtoKpi$ candidates (andcharge conjugates) in p--Pb collisions at $\sqrtsNN=5.02 \TeV$ fortwo $\pt$ intervals: $0< \pt< 1 \gev/c$ (top panels) and $1< \pt< 2 \gev/c$(bottom panels). For both $\pt$ intervals, the left panels displaythe invariant-mass distribution of all ULS K$\pi$ pairs together with thebackground distributions estimated with the LS, event-mixing andtrack-rotation techniques. The middle and right panels show the invariant-massdistributions after subtraction of the background from the event-mixingand side-band fit techniques. Fit functions are superimposed. | 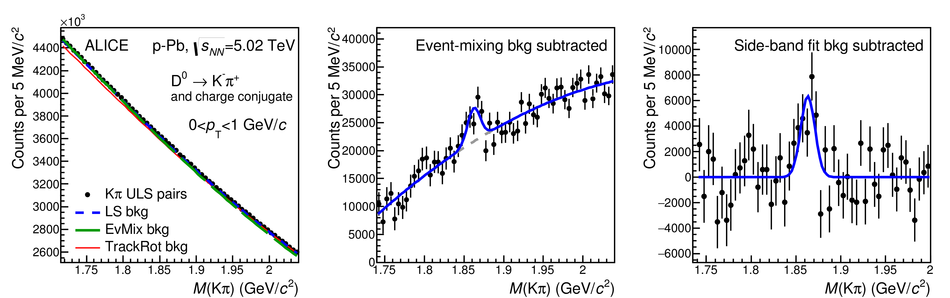 |
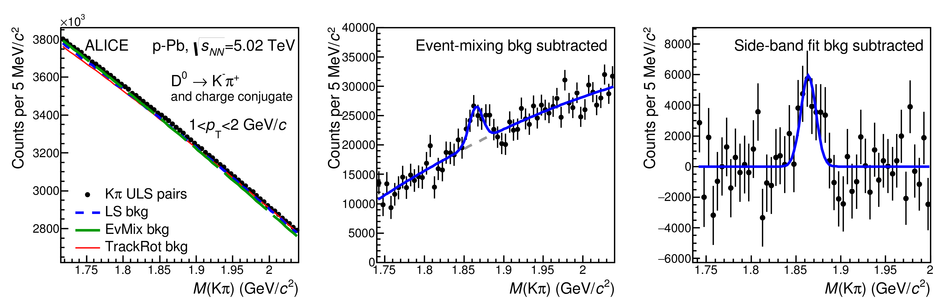
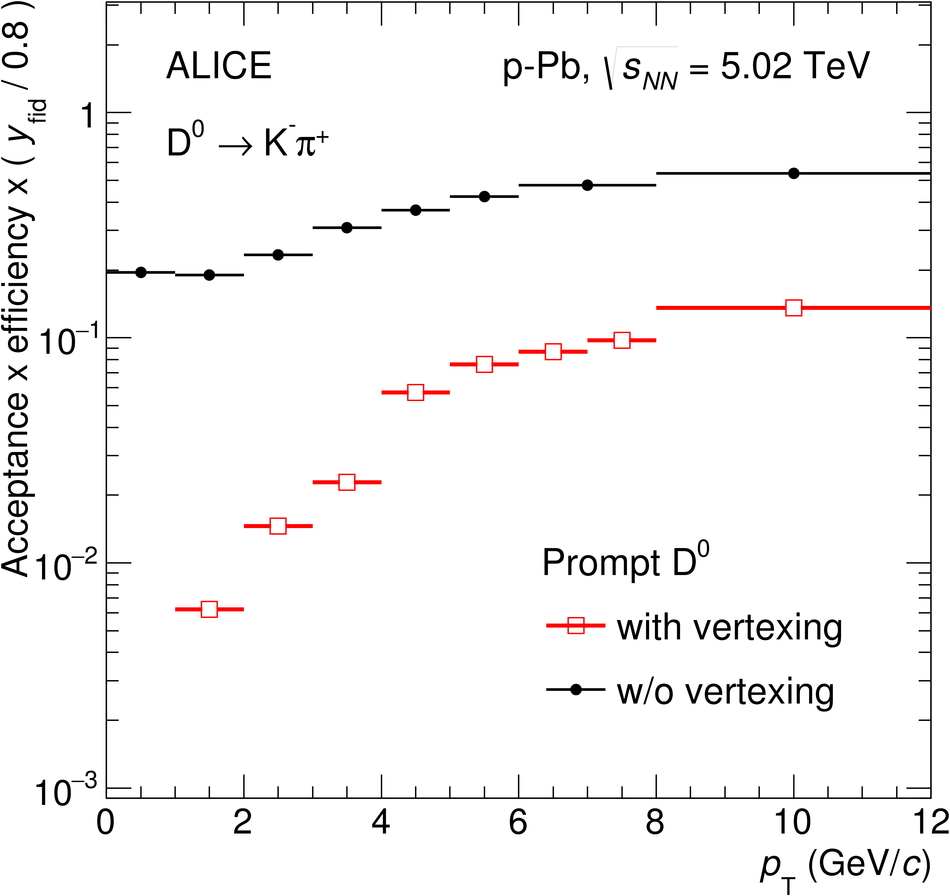
Figure 8
$\pt$-differential production cross section of $\Dzero$ mesons with $|y|< 0.5$ in pp collisions at $\sqrt s =7 \tev$. Left: comparison of prompt and inclusive $\Dzero$ mesons (the latter including also $\Dzero$ mesons from beauty-hadron decays) from the analysis without decay-vertex reconstruction. Right: comparison between the prompt $\Dzero$ cross sections measured with and without decay-vertex reconstruction. Here and in all the following figures the symbols are plotted at the centre of the $\pt$ intervals (shown by the horizontal lines), the vertical lines represent the statistical uncertainties and the vertical size of the boxes corresponds to the systematic uncertainties. | 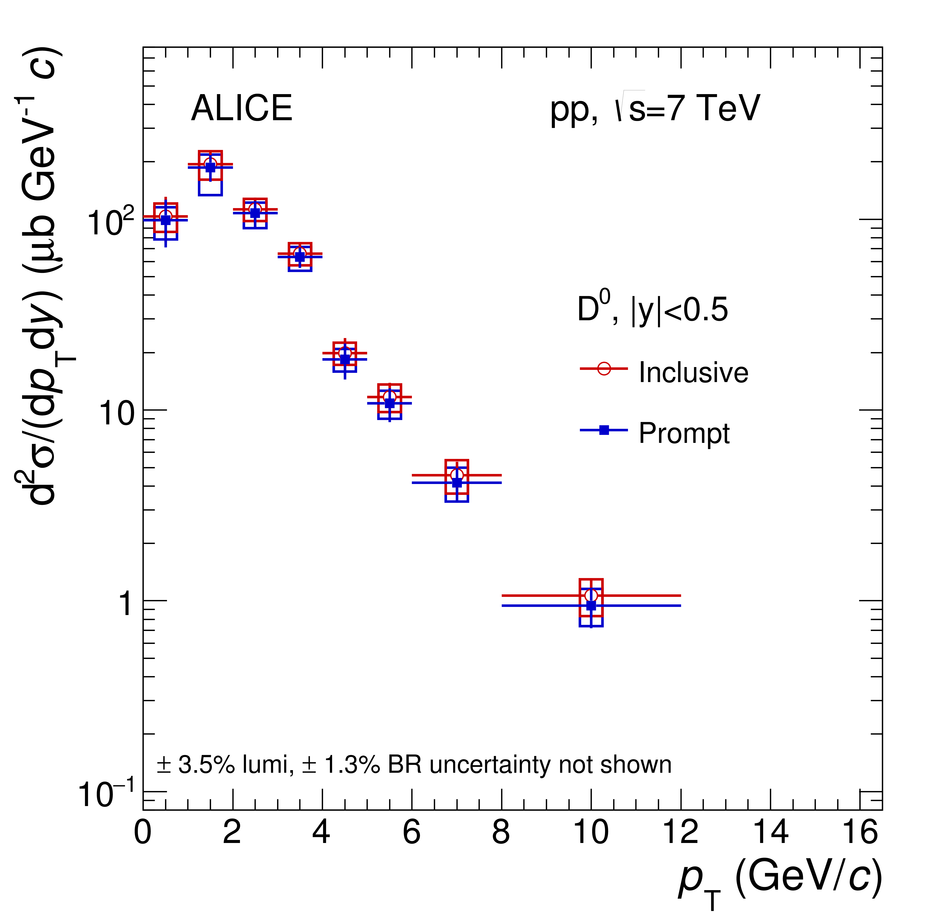 |
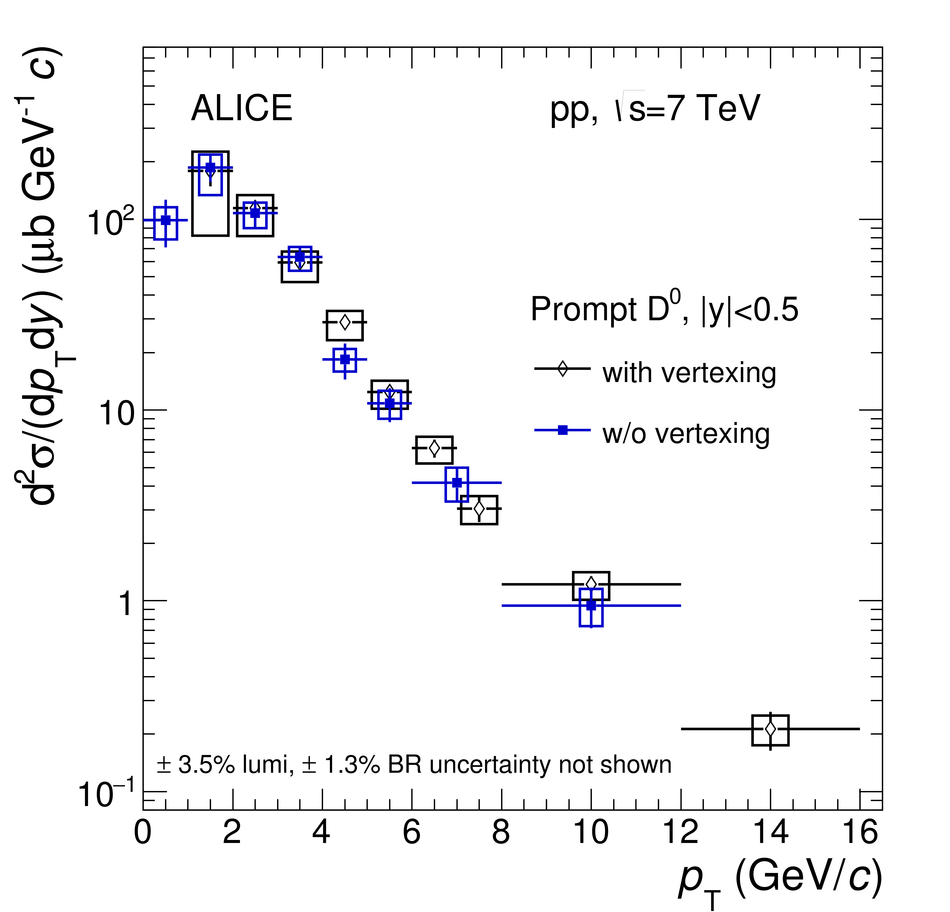
Figure 9
$\pt$-differential production cross section of prompt $\Dzero$ mesons with $|y|< 0.5$ in the interval $0< \pt< 16 \gev/c$, in pp collisions at $\sqrt s =7 \tev$. The data points in $0< \pt< 2 \gev/c$ are obtained from the analysis described in this article, while the data points in $2< \pt< 16 \gev/c$ are taken from Ref[50]. The cross section is compared to three pQCD calculations: FONLL (top-left panel), GM-VFNS (top-right panel) and a leading order (LO) calculation based on $k_{\rm T}$-factorisation (bottom-left panel) In the bottom-right panel, the ratios of the data to the three calculatedcross sections are reported.
|  |

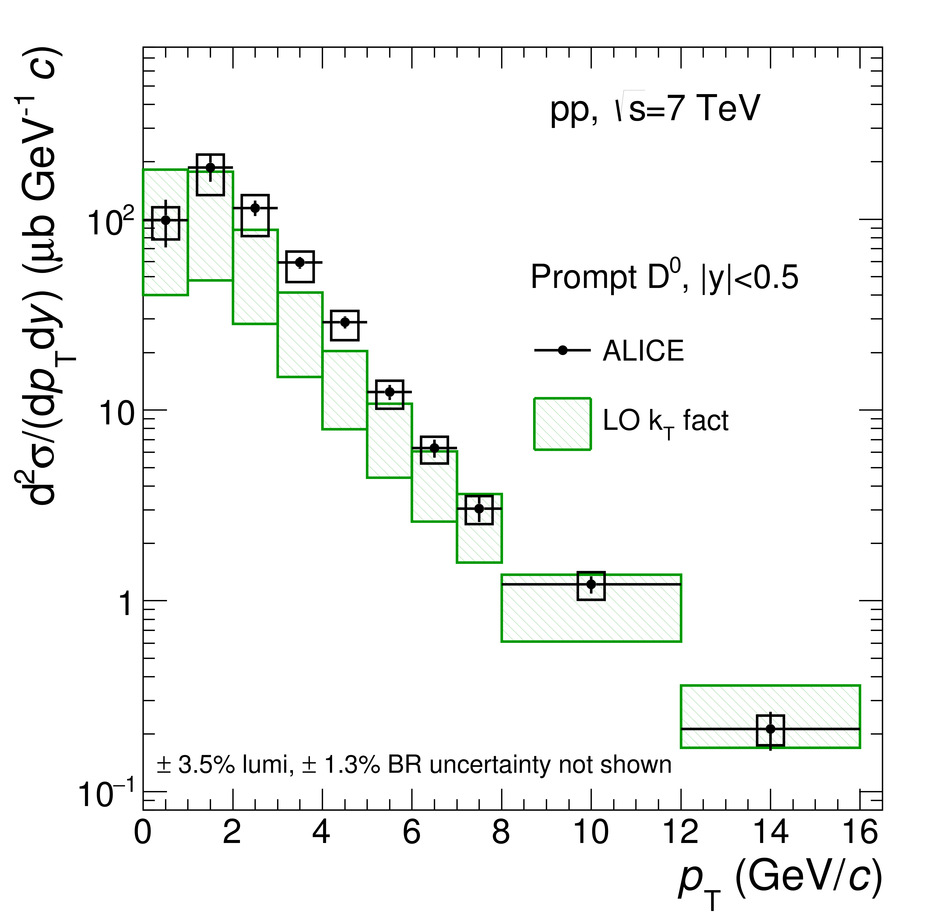

Figure 10
Total inclusive charm production cross section in nucleon--nucleon collisionsas a function of $\sqrt{s}$. Data are from pA collisions for $\sqrt s< 100$ GeV and from pp collisions for $\sqrt s>100$ GeV. Data from pA collisionswere scaled by $1/A$ Results from NLO pQCD calculations (MNR) and theiruncertainties are shown as solid and dashed lines.
| 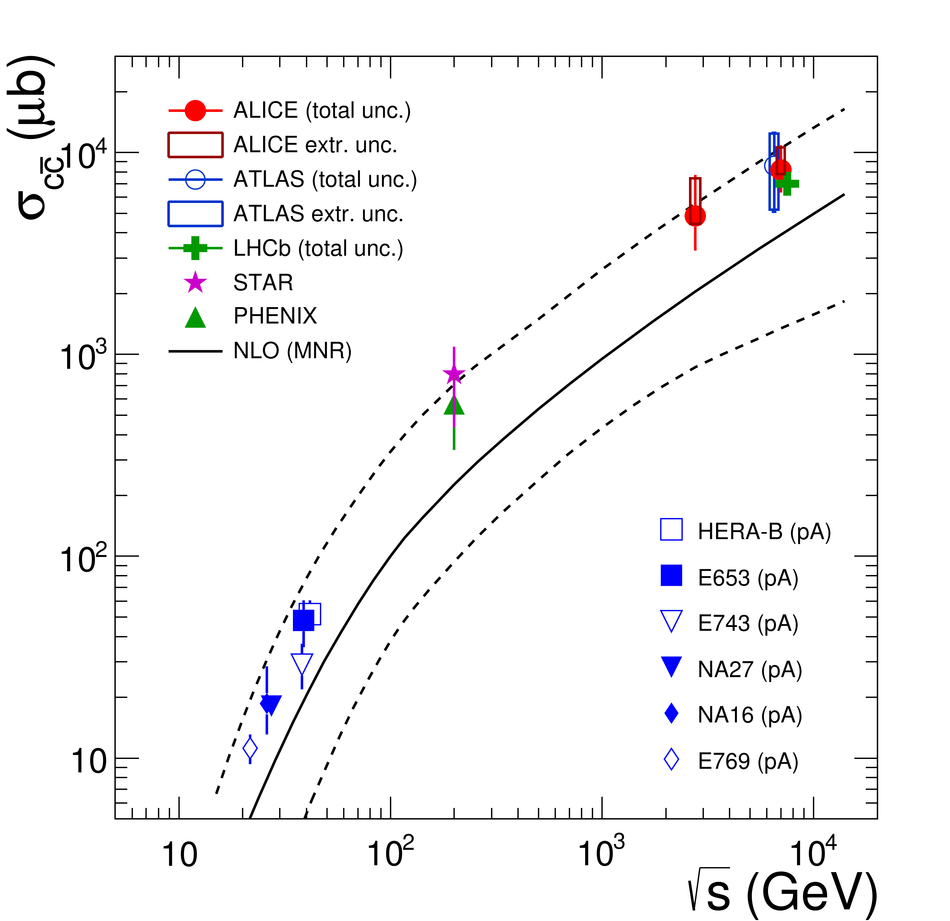 |
Figure 11
$\pt$-differential production cross section of $\Dzero$ mesons with $-0.96< y_{\rm cms}< 0.04$ in p-Pb collisions at $\sqrtsNN =5.02 \tev$ Left: comparison of prompt and inclusive $\Dzero$ mesons (the latter including also $\Dzero$ mesons from beauty-hadron decays) from the analysis without decay-vertex reconstruction. Right: comparison between the prompt $\Dzero$ cross sections measured with and without decay-vertex reconstruction. | 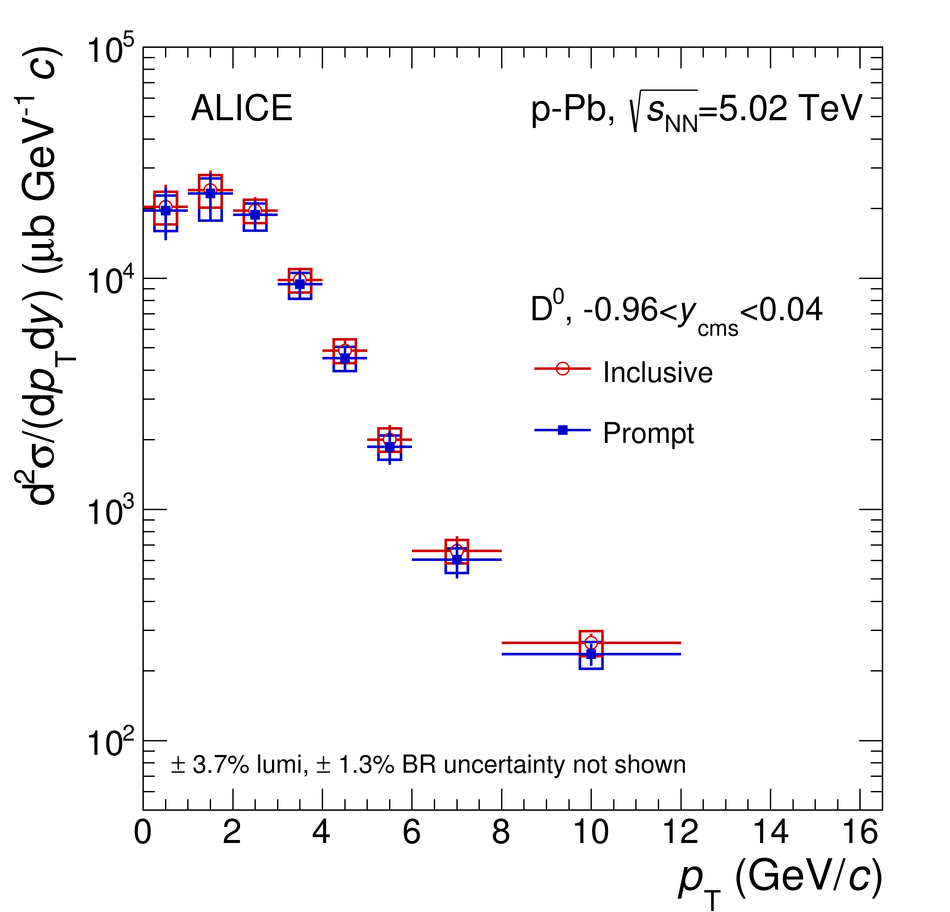 |
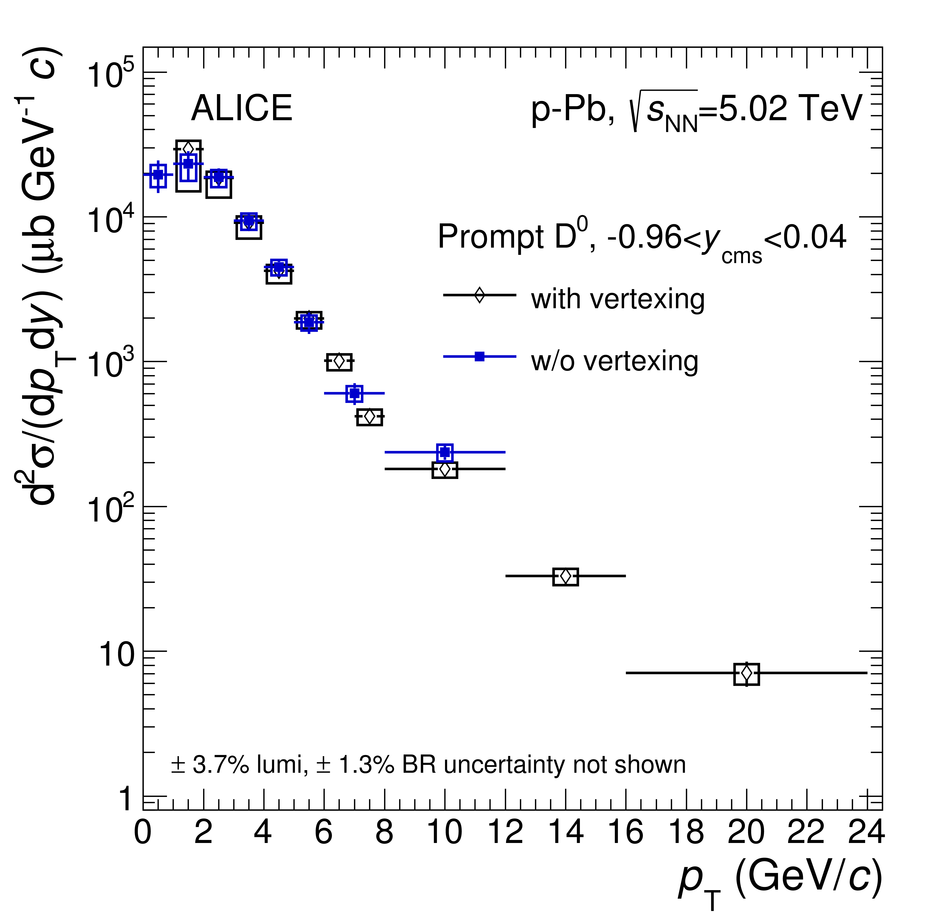
Figure 12
$\pt$-differential production cross sections of prompt $\Dzero$ (top-left), $\Dplus$ (top-right), $\Dstar$ (bottom-left) and $\Ds$ (bottom-right) mesons with $-0.96< y_{\rm cms}< 0.04$ in p-Pb collisions at $\sqrtsNN=5.02 \tev$, compared with the respective pp reference cross sections scaled by the Pb mass number $A=208$. For the $\Dzero$ meson, the results in $0< \pt< 2 \gev/c$ are obtained from the analysis without decay-vertex reconstruction, while those in $2< \pt< 24 \gev/c$ are taken from the analysis with decay-vertex reconstruction. The results from the other three D-meson species are the same as in Ref.[49]. The systematic uncertainty of the feed-down correction is displayed separately. | 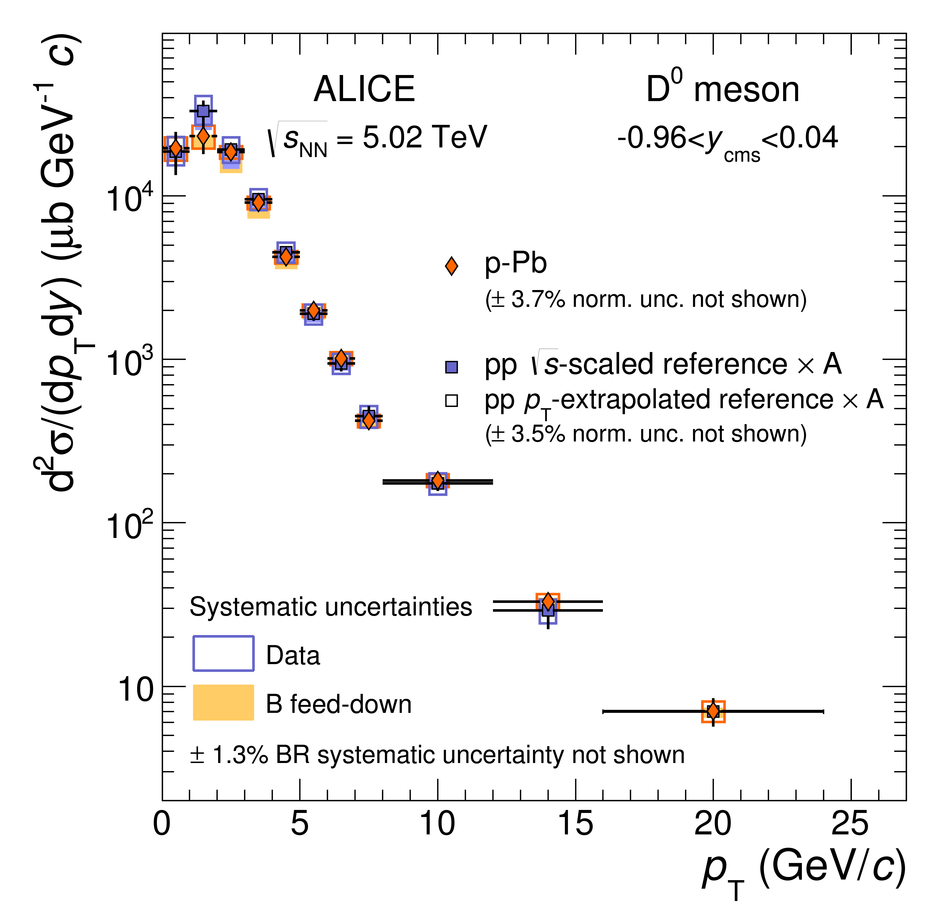 |

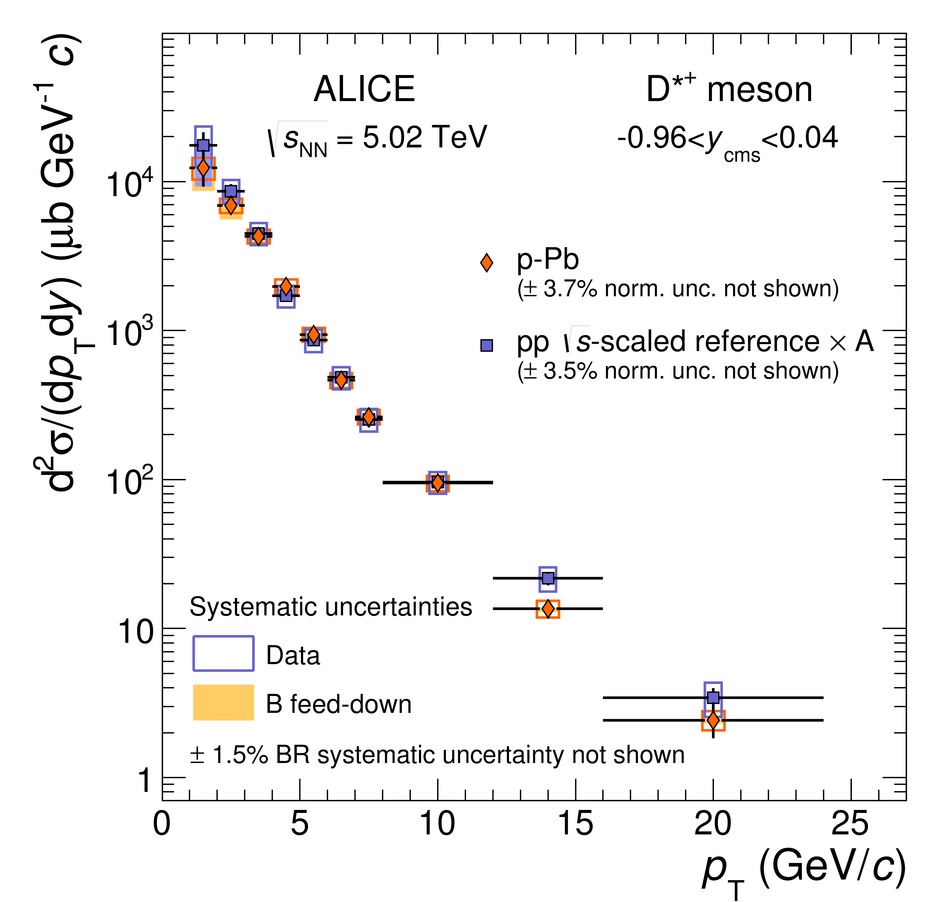
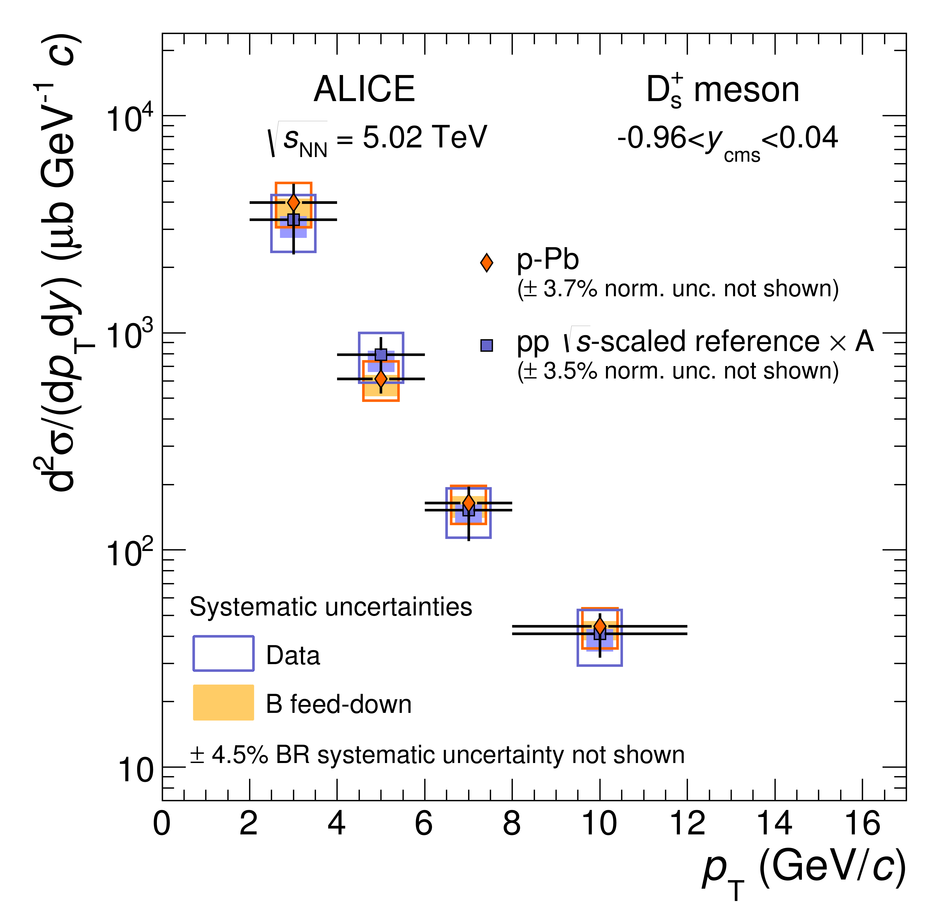
Figure 14
Production cross sections as a function of rapidity ($y_{\rm cms}$) for prompt $\Dzero$, $\Dplus$ and $\Dstar$ mesons in p-Pb collisions at $\sqrtsNN=5.02 \tev$, for three $\pt$ intervals. The $\Dzero$-meson data are compared with a cross section obtained by multiplying the FONLL calculation by the mass number $A$ and the nuclear modification factor $R_{\rm pA}$ estimated as a function of $y$ with the MNR NLO pQCD calculation, with CTEQ6M PDFs and the EPS09NLO nuclear PDF parametrisation.
| 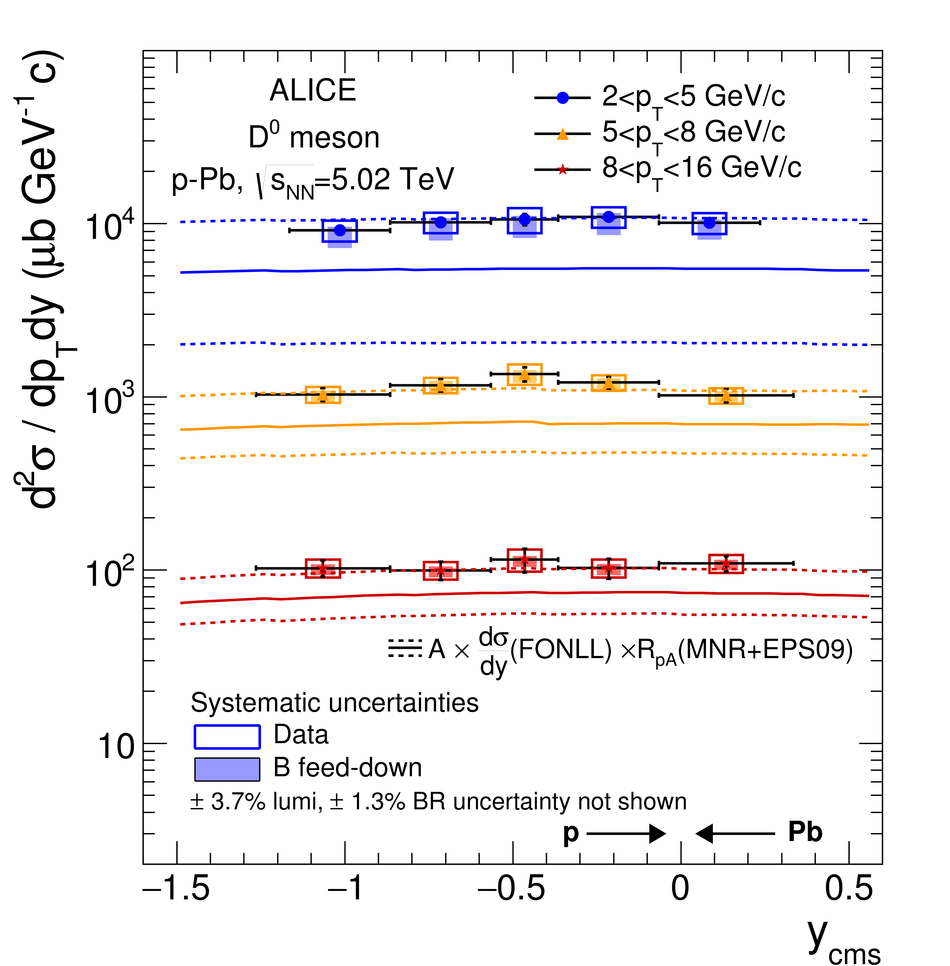 |

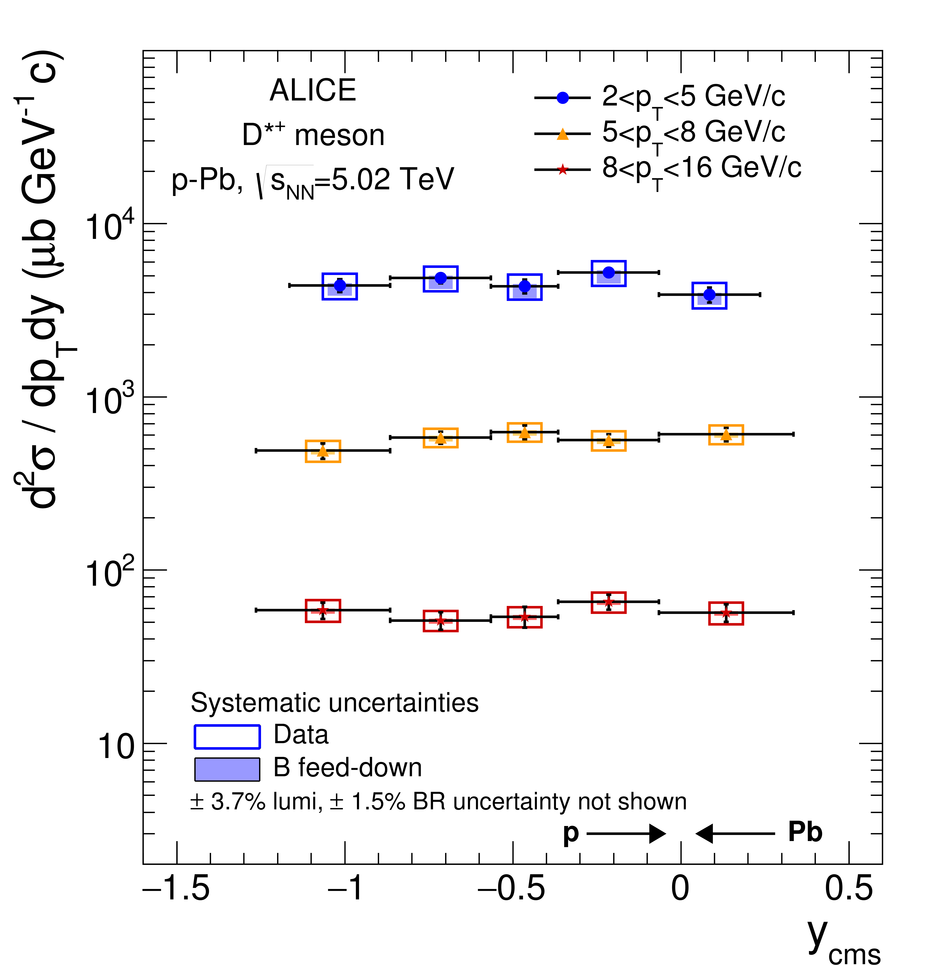
Figure 15
Nuclear modification factor $R_{\rm pPb}$ of prompt D mesons in p--Pb collisions at $\sqrtsNN=5.02 \tev$ Top: $R_{\rm pPb}$ of $\Dzero$, $\Dplus$ and $\Dstar$ mesons. Bottom: average $R_{\rm pPb}$ of the three non-strange D-meson species and $R_{\rm pPb}$ of $\Ds$ mesons. All results are obtained from the analysis with decay-vertex reconstruction. |  |

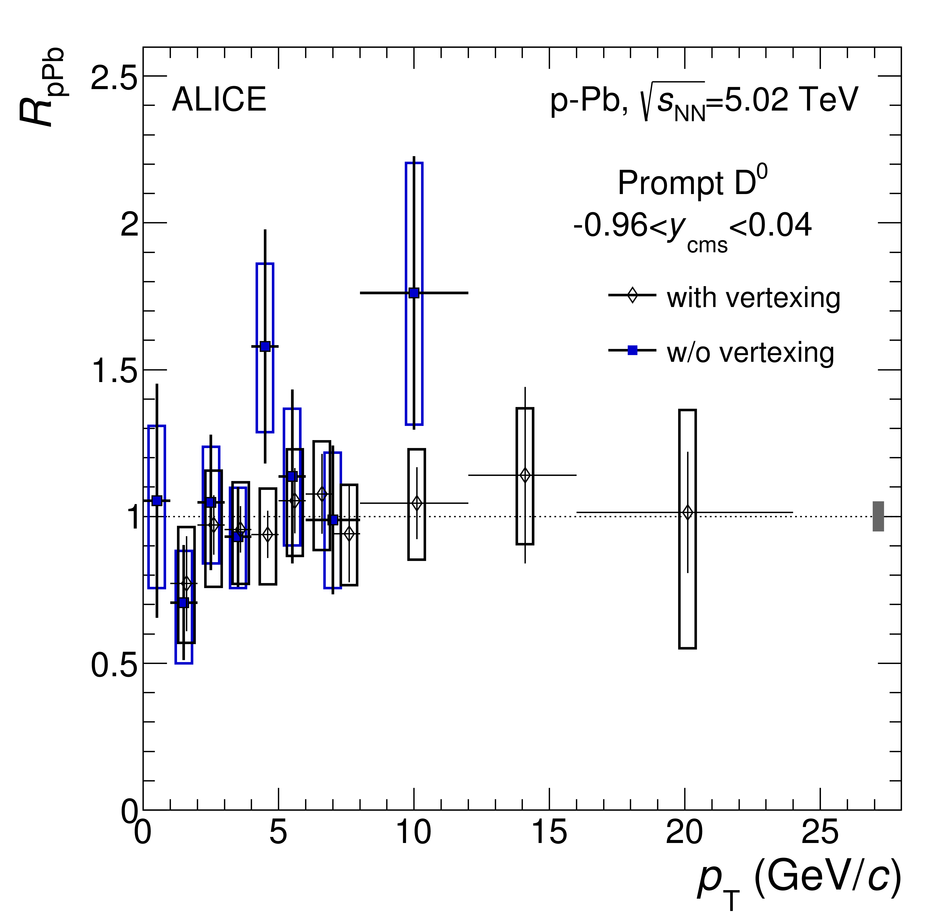
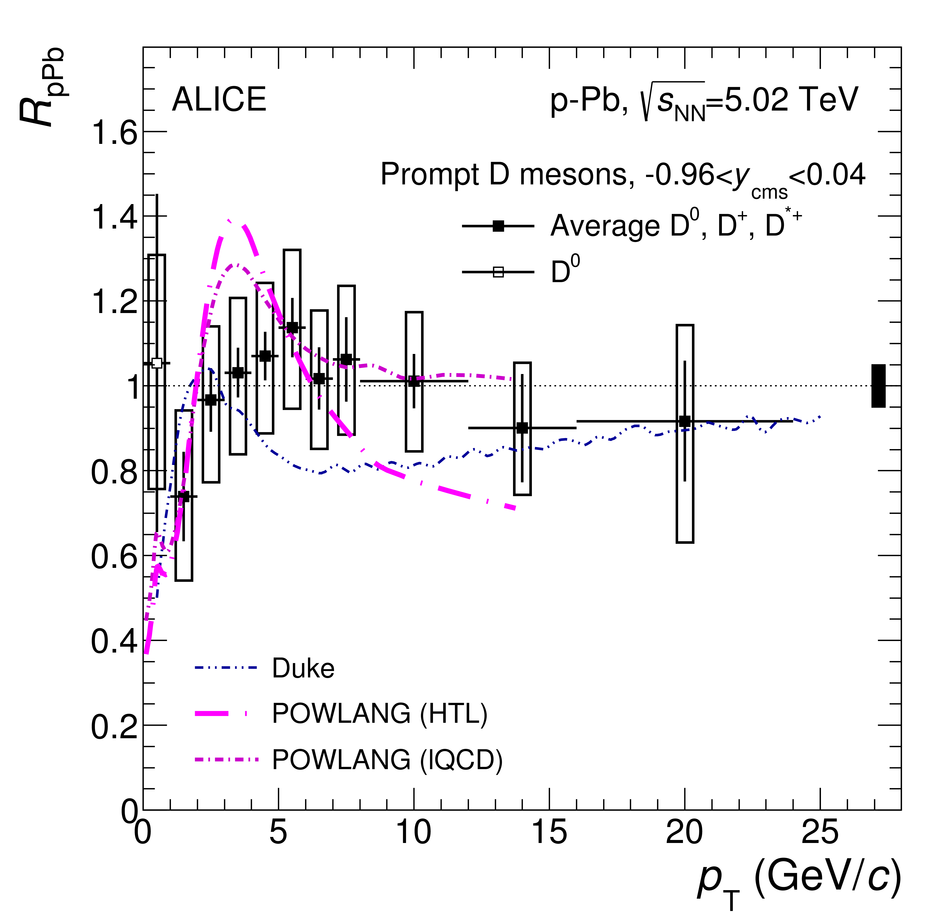
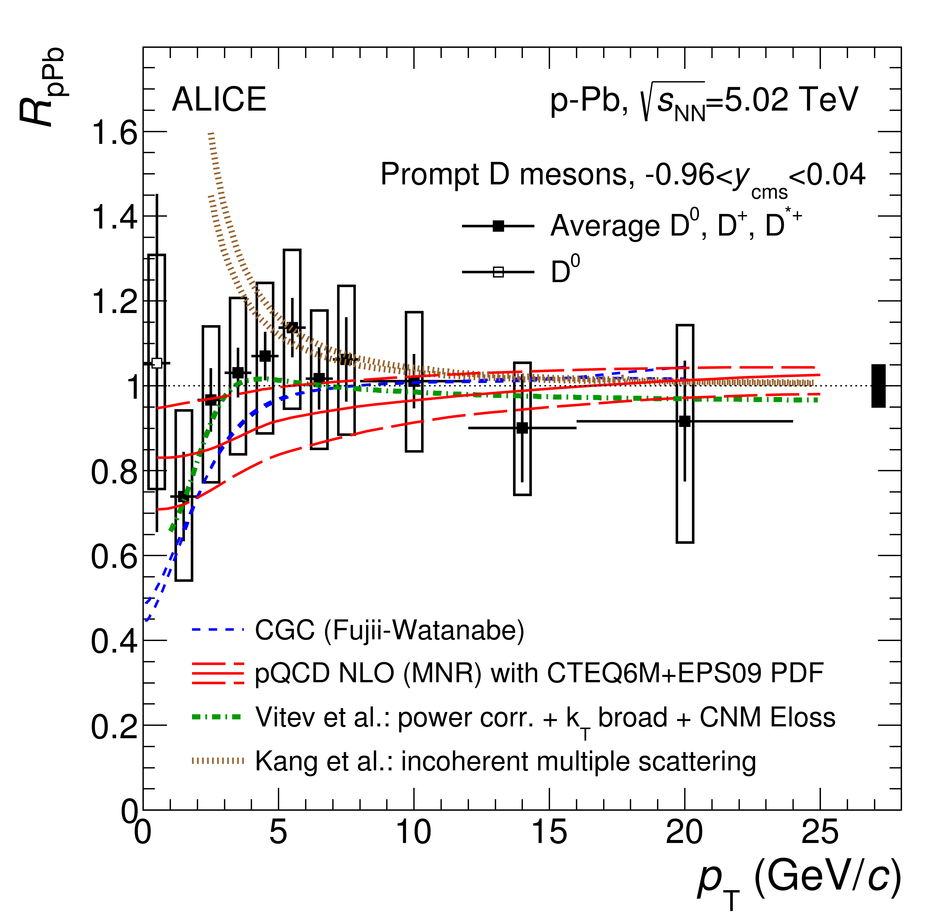
Figure 17
Nuclear modification factor $R_{\rm pPb}$ of prompt D mesons in p-Pb collisions at $\sqrtsNN=5.02 \tev$: average $R_{\rm pPb}$ of $\Dzero$, $\Dplus$ and $\Dstar$ mesons in the interval $1< \pt< 24 \gev/c$, shown together with the $\Dzero$ $R_{\rm pPb}$ in $0< \pt< 1 \GeV/c$. In the top panel, the data are compared with results of theoretical calculations including only CNM effects: CGC, NLO pQCD with EPS09 nPDFs, a LO pQCD calculation with CNM effects (Vitev et al.) and a calculation based on incoherent multiple scatterings (Kang et al.). In the bottom panel, the results of the Duke and POWLANG transport models are compared to the measured D-meson $R_{\rm pPb}$.
|  |