The ratios of yields of anti-baryons to baryons probes the mechanisms of baryon-number transport. Results for $\bar{\rm p}/{\rm p}$, $\bar{\rm \Lambda}/{\rm \Lambda}$, $\rm\bar{\Xi}$$^{+}/{\rm \Xi}^{-}$ and $\rm\bar{\Omega}$$^{+}/{\rm \Omega}^{-}$ in pp collisions at $\sqrt{s} = 0.9$, 2.76 and 7 TeV, measured with the ALICE detector at the LHC, are reported. Within the experimental uncertainties and ranges covered by our measurement, these ratios are independent of rapidity, transverse momentum and multiplicity for all measured energies. The results are compared to expectations from event generators, such as PYTHIA and HIJING-B, that are used to model the particle production in pp collisions. The energy dependence of $\bar{\rm p}/{\rm p}$, $\bar{\rm \Lambda}/{\rm \Lambda}$, $\rm\bar{\Xi}$$^{+}/{\rm \Xi^{-}}$ and $\rm\bar{\Omega}$$^{+}/{\rm \Omega^{-}}$, reaching values compatible with unity for $\sqrt{s} = 7$ TeV, complement the earlier $\bar{\rm p}/{\rm p}$ measurement of ALICE. These dependencies can be described by exchanges with the Regge-trajectory intercept of $\alpha_{\rm {J}} \approx 0.5$, which are suppressed with increasing rapidity interval ${\rm \Delta} y$. Any significant contribution of an exchange not suppressed at large ${\rm \Delta} y$ (reached at LHC energies) is disfavoured.
Eur. Phys. J. C 73 (2013) 2496
HEP Data
e-Print: arXiv:1305.1562 | PDF | inSPIRE

Figure 3
The invariant mass distributions for $\rm \Lambda$ (top), $\rm \Xi$ (middle) and $\rm \Omega$ (bottom) in pp at $\sqrt{s} = 7$ TeV. Areas considered as signal and background (green) or pure background (blue) are shown. The lines corresponds to a polynomial fit to the background areas. | 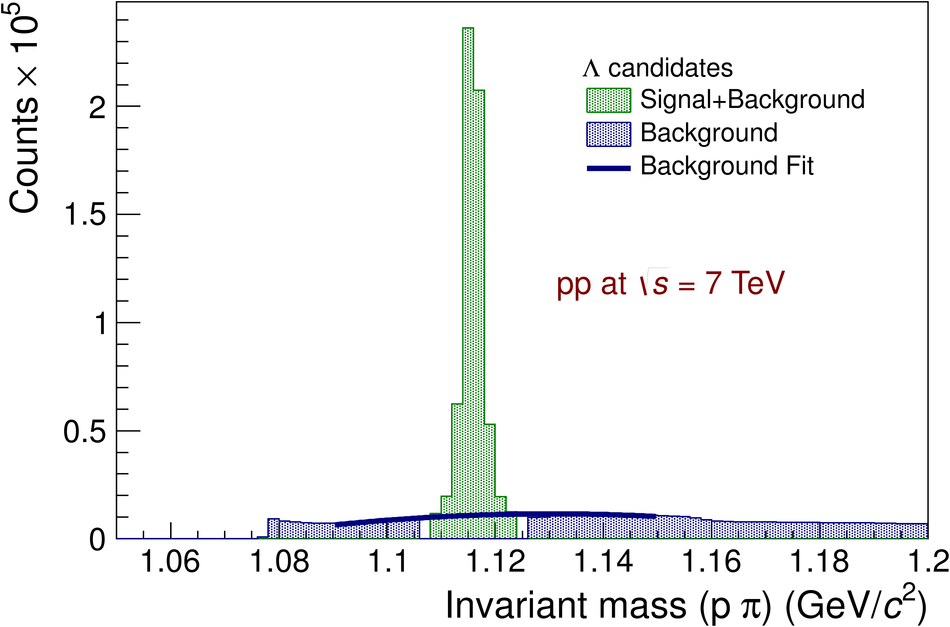 |
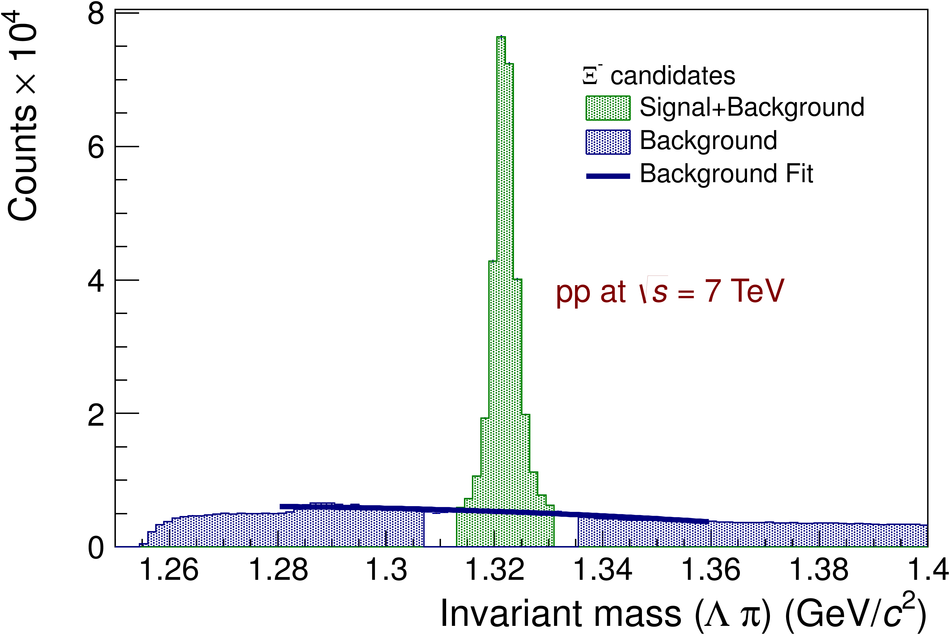
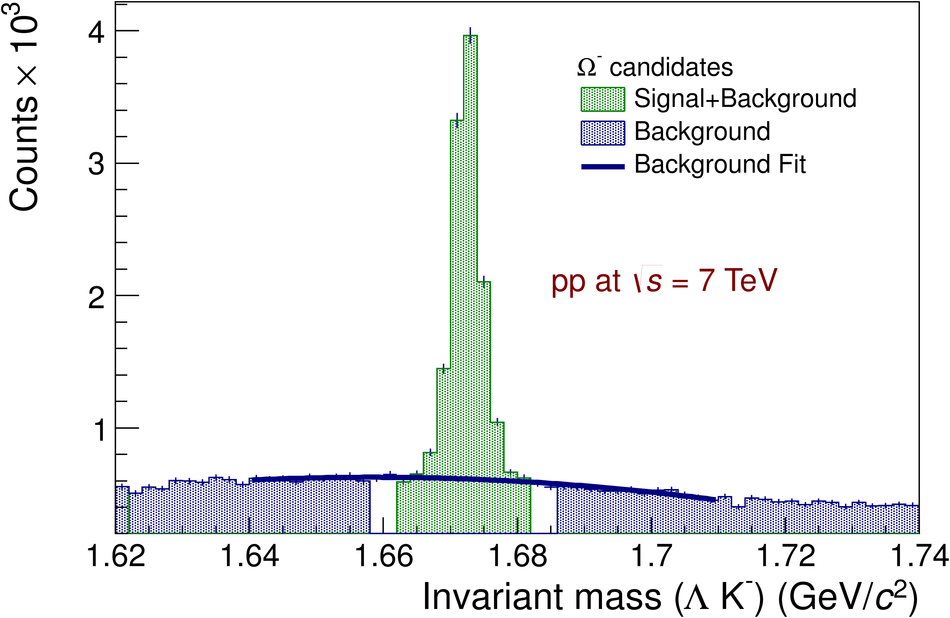

Figure 6
The $\rm{\overline{p}/p}$ ratio at $\sqrt{s} = 2.76$ TeV as a function of $\pt$ (top) and rapidity (bottom). The data points are compared with different Monte Carlo generators. The vertical bars (boxes) represent the statistical (systematic) uncertainty, while the horizontal bars represent the width of the rapidity or $\pt$ bin. Ratio of model to data is shown below using uncertainties added in quadrature. | 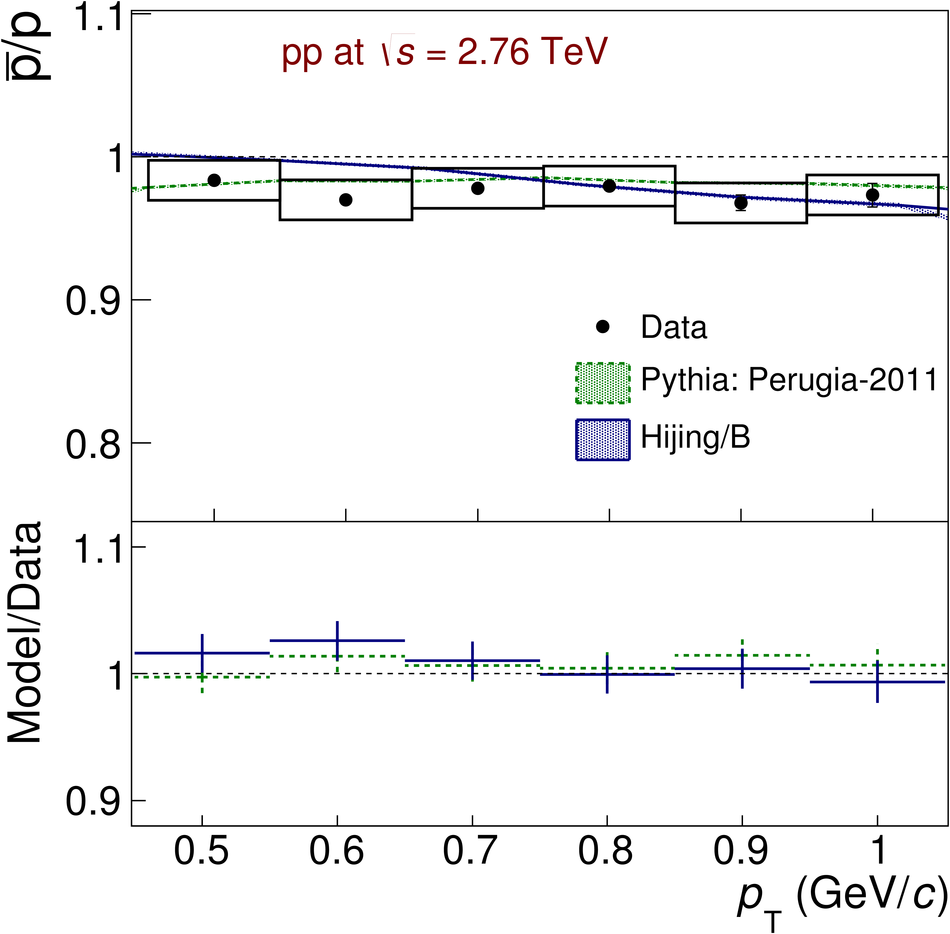 |
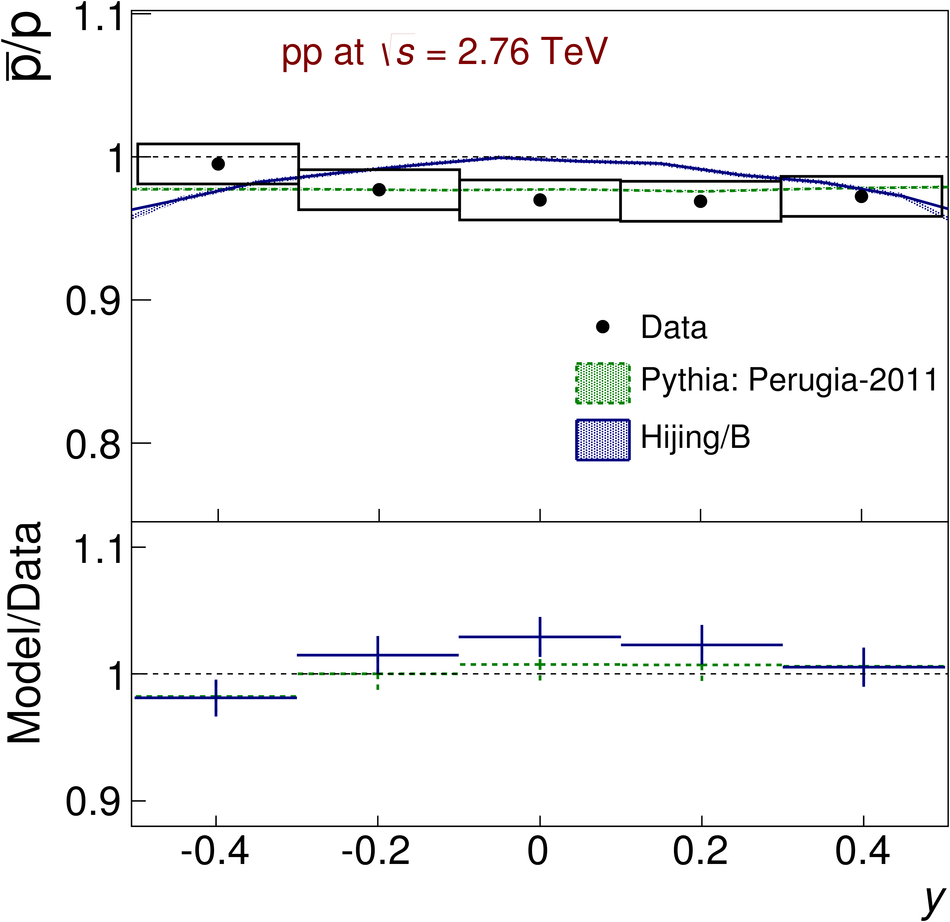
Figure 7
The $\rm{\overline{\Lambda}/\Lambda}$ ratio at $\sqrt{s} = 0.9$ TeV as a function of $\pt$ (top) and rapidity (bottom). The data points are compared with different Monte Carlo generators. The vertical bars (boxes) represent the statistical (systematic) uncertainty, while the horizontal bars represent the width of the rapidity or $\pt$ bin. Ratio of model to data is shown below using uncertainties added in quadrature. | 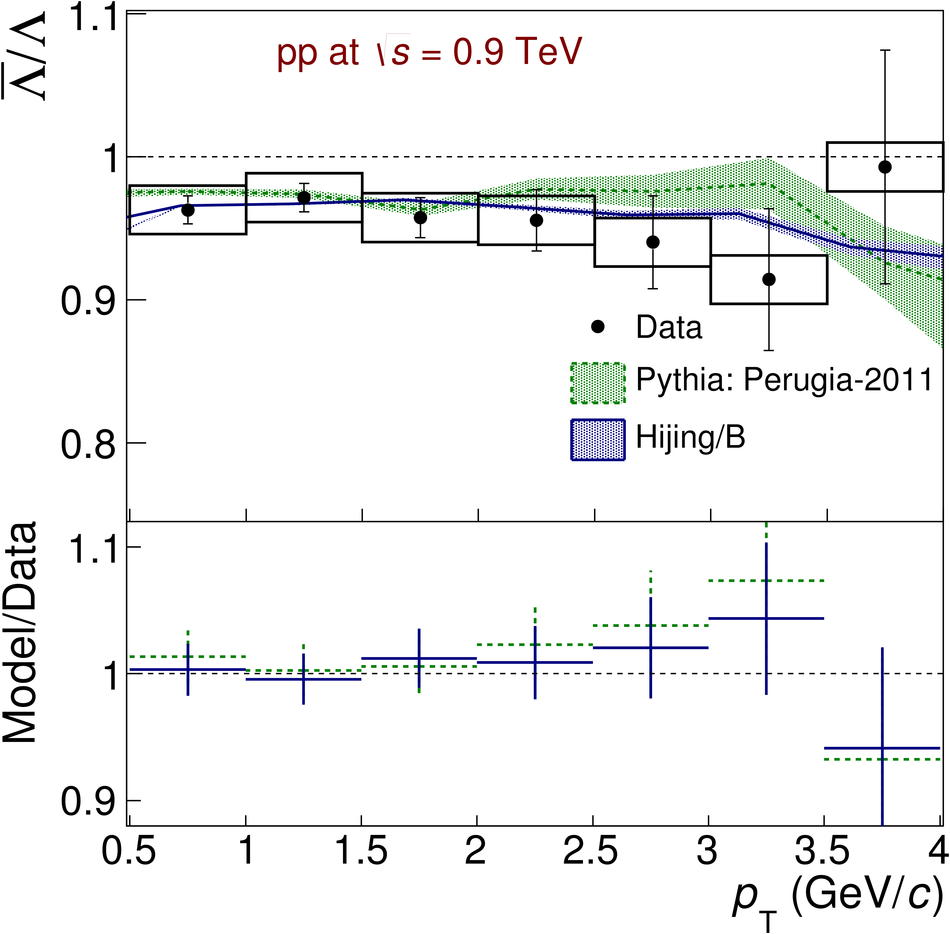 |
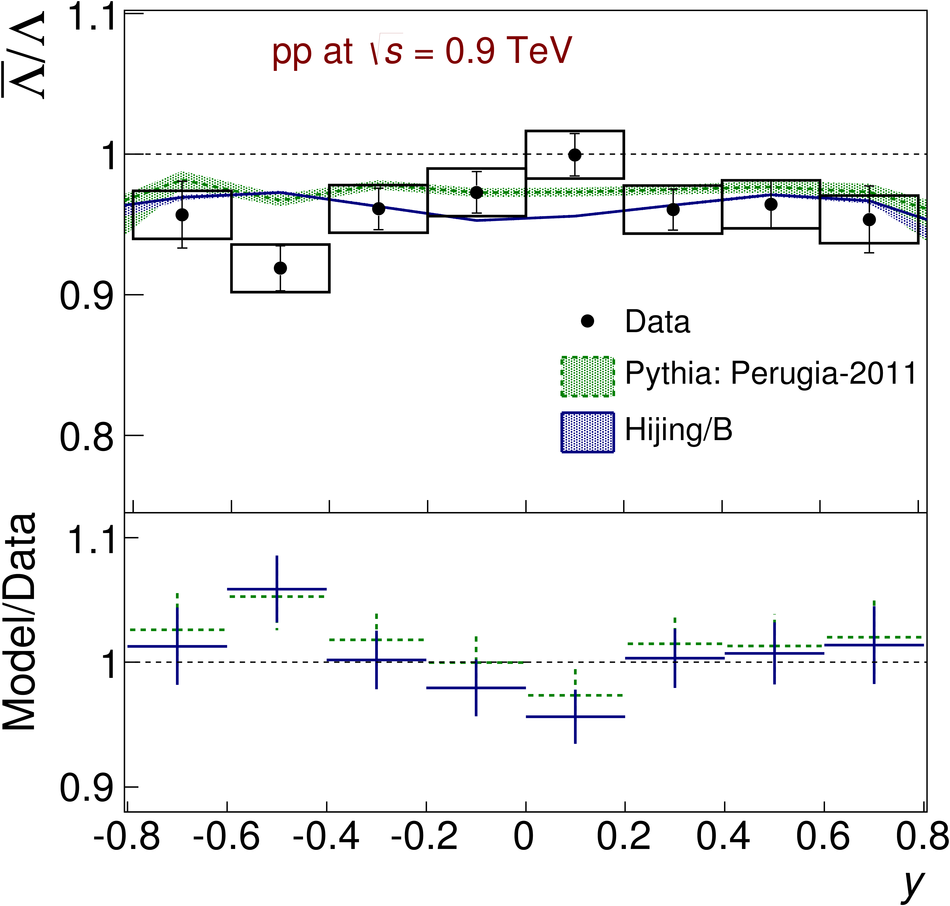
Figure 8
The $\rm{\overline{\Lambda}/\Lambda}$ ratio at $\sqrt{s} = 2.76$ TeV as a function of $\pt$ (top) and rapidity (bottom). The data points are compared with different Monte Carlo generators. The vertical bars (boxes) represent the statistical (systematic) uncertainty, while the horizontal bars represent the width of the rapidity or $\pt$ bin. Ratio of model to data is shown below using uncertainties added in quadrature. | 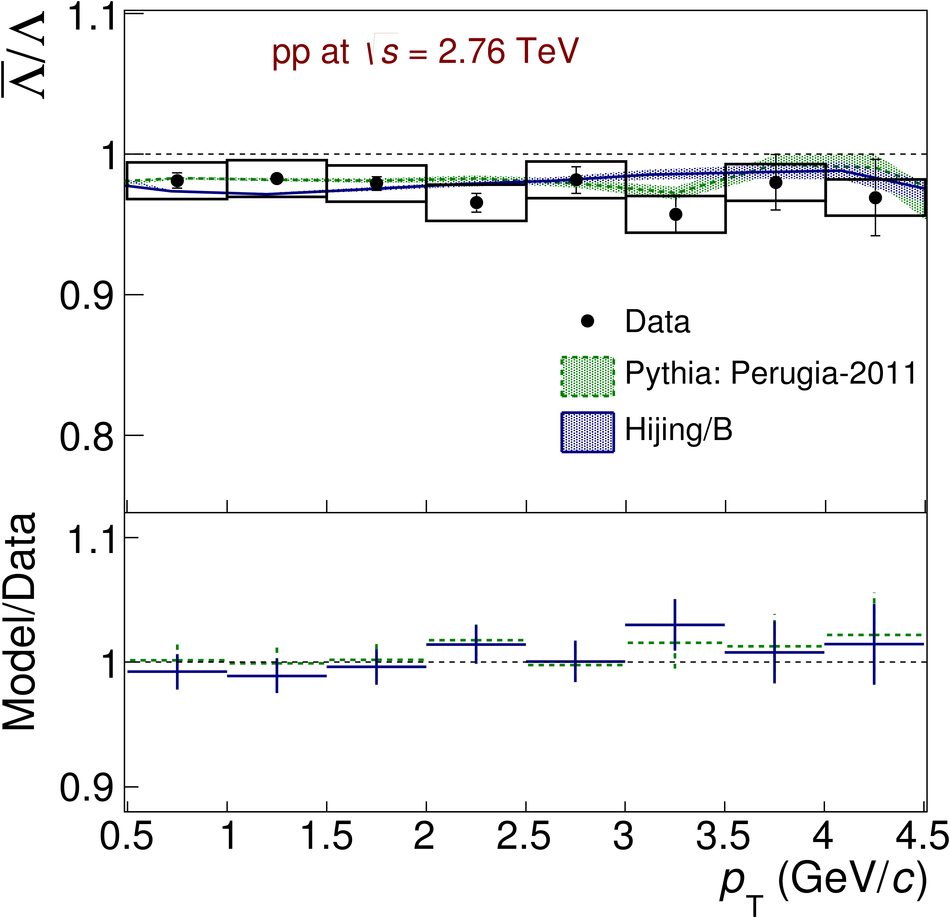 |
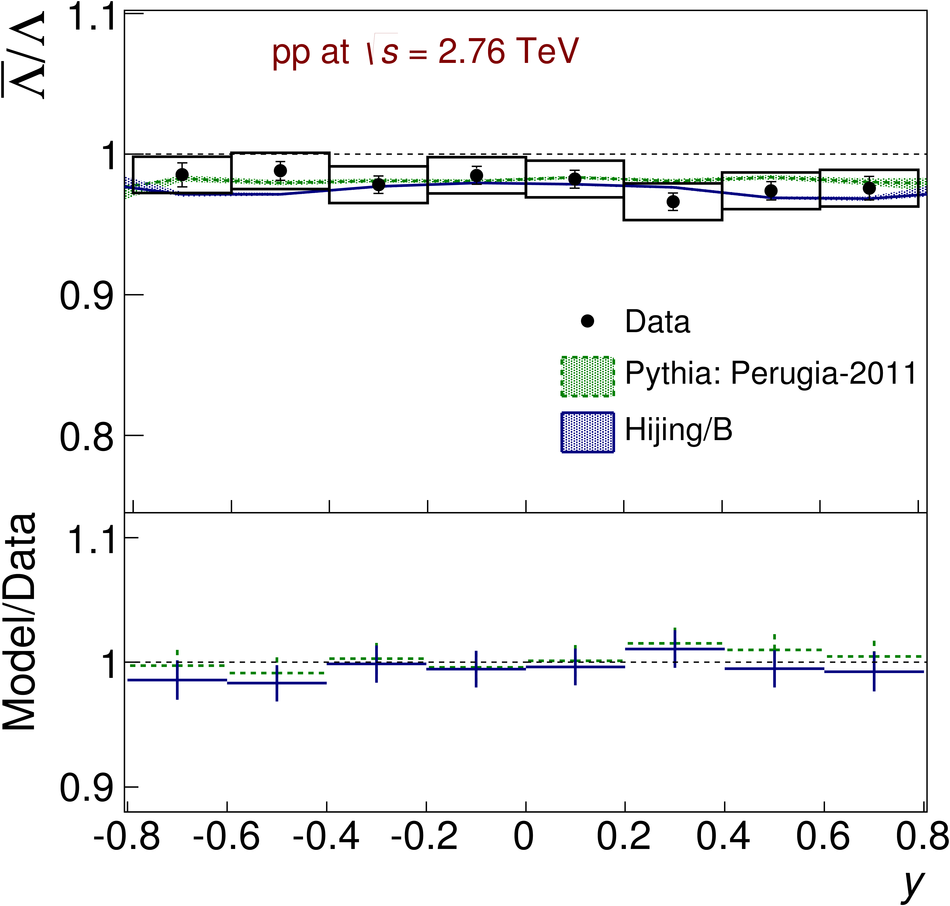
Figure 9
The $\rm{\overline{\Lambda}/\Lambda}$ ratio at $\sqrt{s} = 7$ TeV as a function of $\pt$ (left) and rapidity (right). The data points are compared with different Monte Carlo generators. The vertical bars (boxes) represent the statistical (systematic) uncertainty, while the horizontal bars represent the width of the rapidity or $\pt$ bin. Ratio of model to data is shown below using uncertainties added in quadrature. |  |
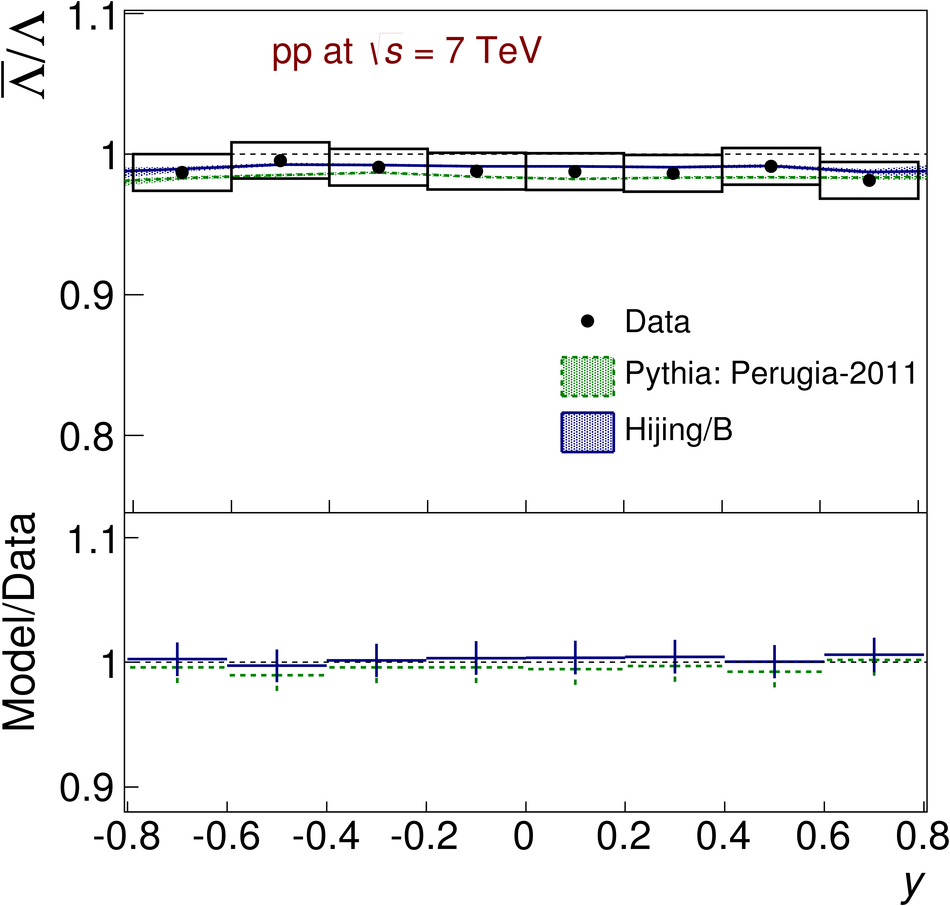
Figure 10
The $\XbarX$ ratio at $\sqrt{s} = 0.9$ TeV integrated over $|y|< $ 0.8 as a function of $\pt$. The data points are compared with different Monte Carlo generators. The vertical bars (boxes) represent the statistical (systematic) uncertainty, while the horizontal bars represent the width of the $\pt$ bin. Ratio of model to data is shown below using uncertainties added in quadrature. | 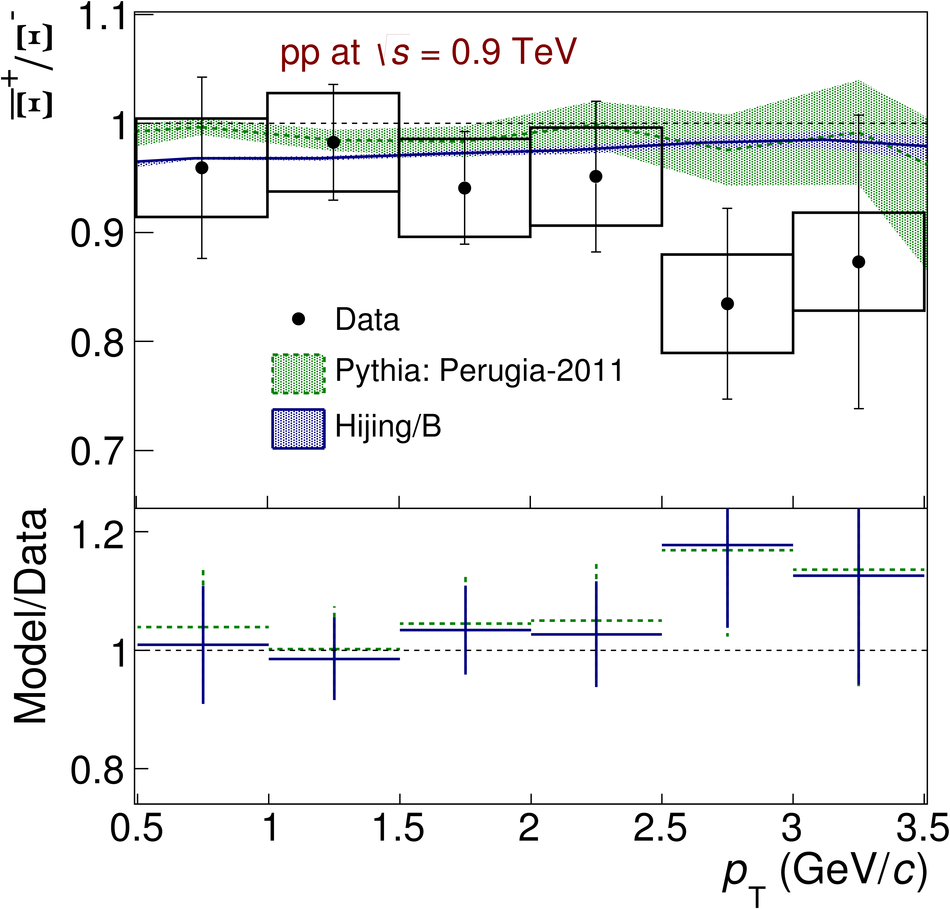 |
Figure 11
The $\XbarX$ ratio at $\sqrt{s} = 2.76$ TeV integrated over $|y|< $ 0.8 as a function of $\pt$. The data points are compared with different Monte Carlo generators. The vertical bars (boxes) represent the statistical (systematic) uncertainty, while the horizontal bars represent the width of the $\pt$ bin. Ratio of model to data is shown below using uncertainties added in quadrature. | 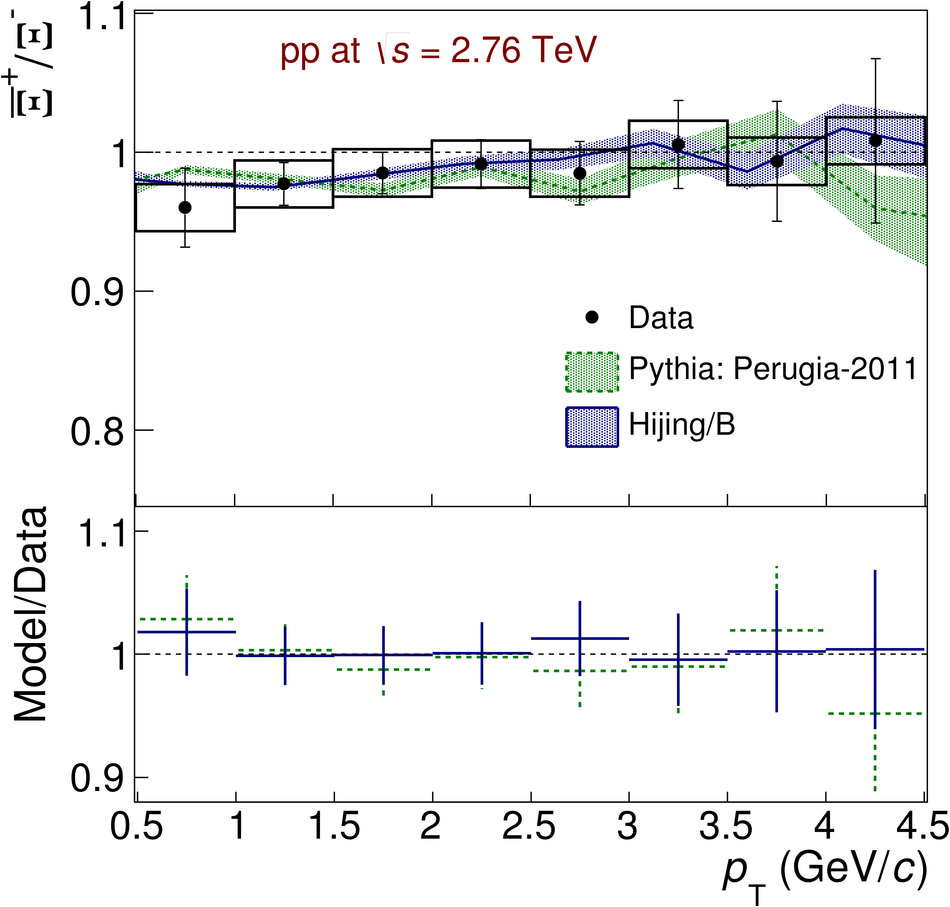 |
Figure 12
The $\XbarX$ ratio at $\sqrt{s} = 7$ TeV as a function of $\pt$ (top) and rapidity (bottom). The data points are compared with different Monte Carlo generators. The vertical bars (boxes) represent the statistical (systematic) uncertainty, while the horizontal bars represent the width of the rapidity or $\pt$ bin. Ratio of model to data is shown below using uncertainties added in quadrature. |  |
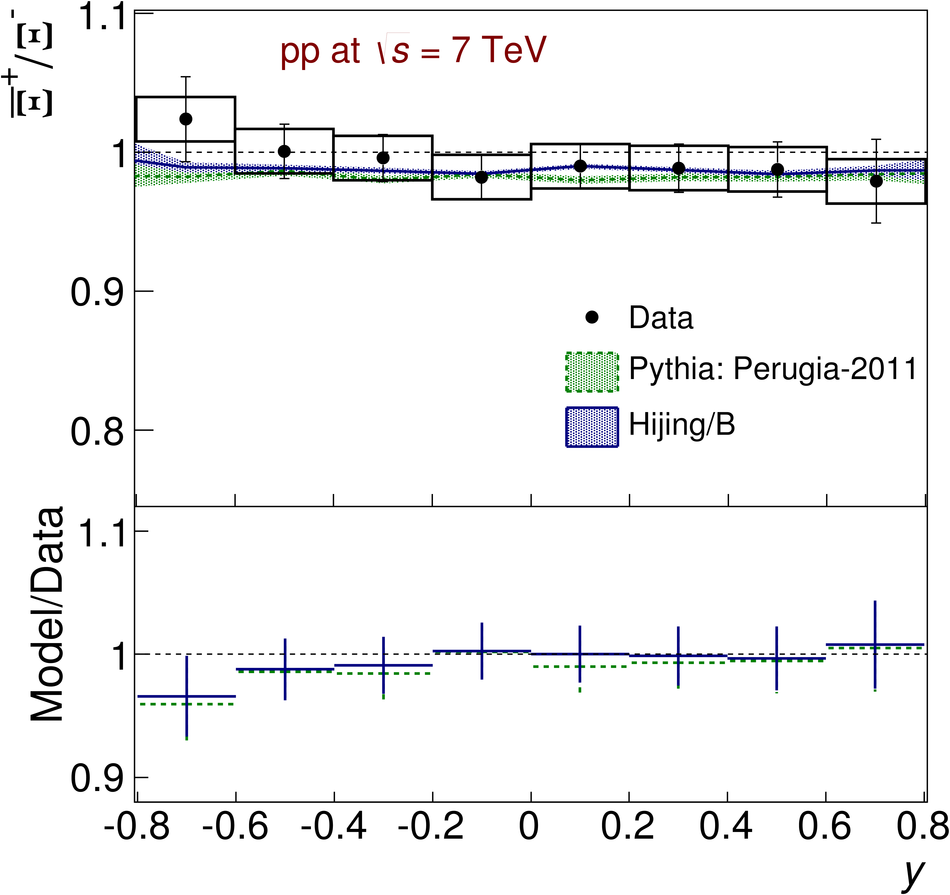
Figure 13
The $\ObarO$ ratio at $\sqrt{s} = 2.76$ TeV integrated over $|y|< $ 0.8 as a function of $\pt$. The data points are compared with different Monte Carlo generators. The vertical bars (boxes) represent the statistical (systematic) uncertainty, while the horizontal bars represent the width of the $\pt$ bin. Ratio of model to data is shown below using uncertainties added in quadrature. | 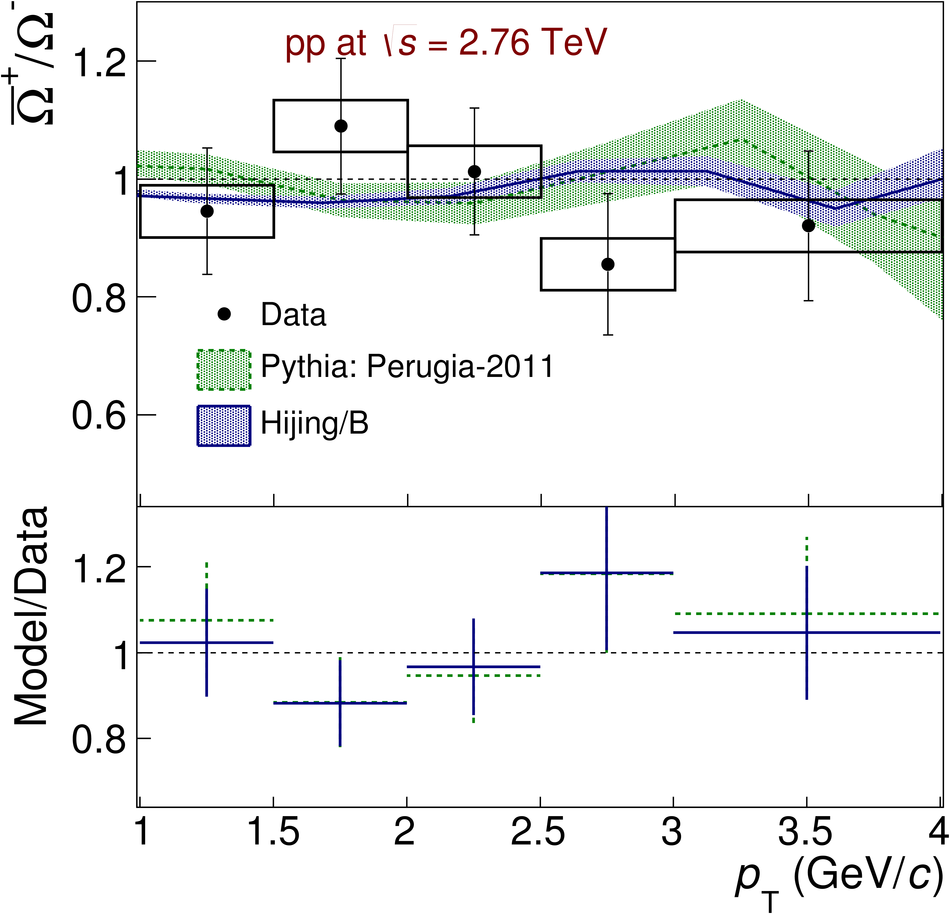 |
Figure 14
The $\ObarO$ ratio at $\sqrt{s} = 7$ TeV integrated over $|y|< $ 0.8 as a function of $\pt$. The data points are compared with different Monte Carlo generators. The vertical bars (boxes) represent the statistical (systematic) uncertainty, while the horizontal bars represent the width of the $\pt$ bin. Ratio of model to data is shown below using uncertainties added in quadrature. | 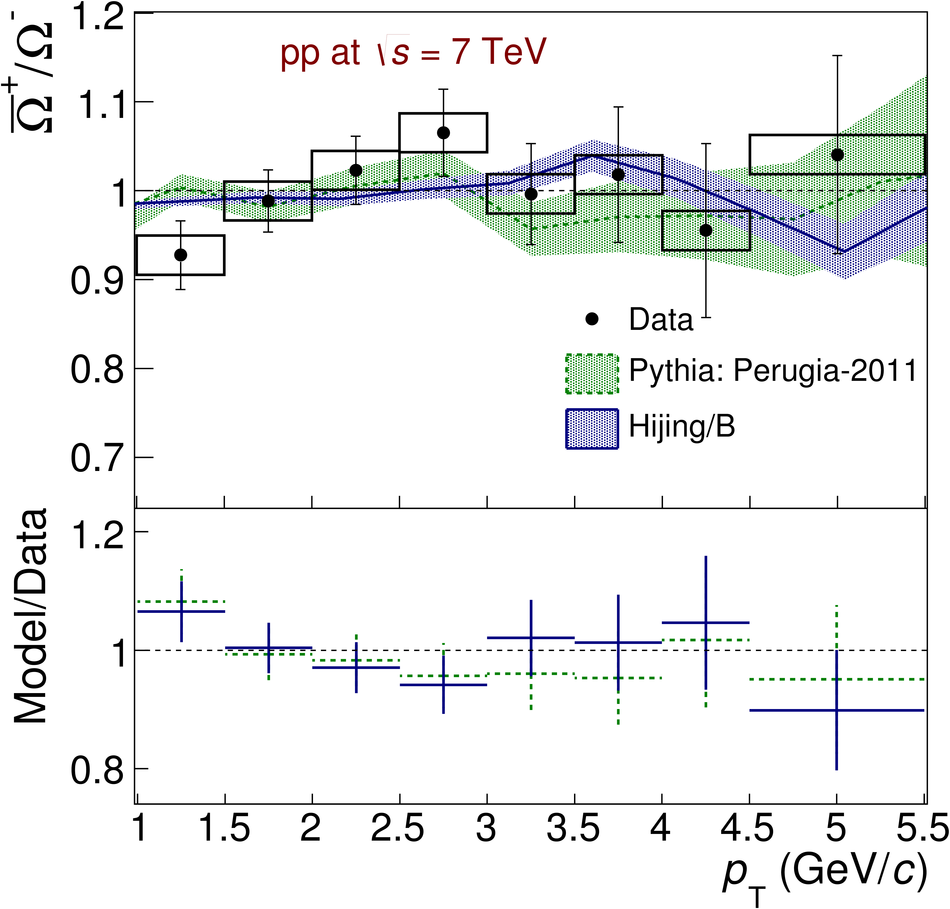 |
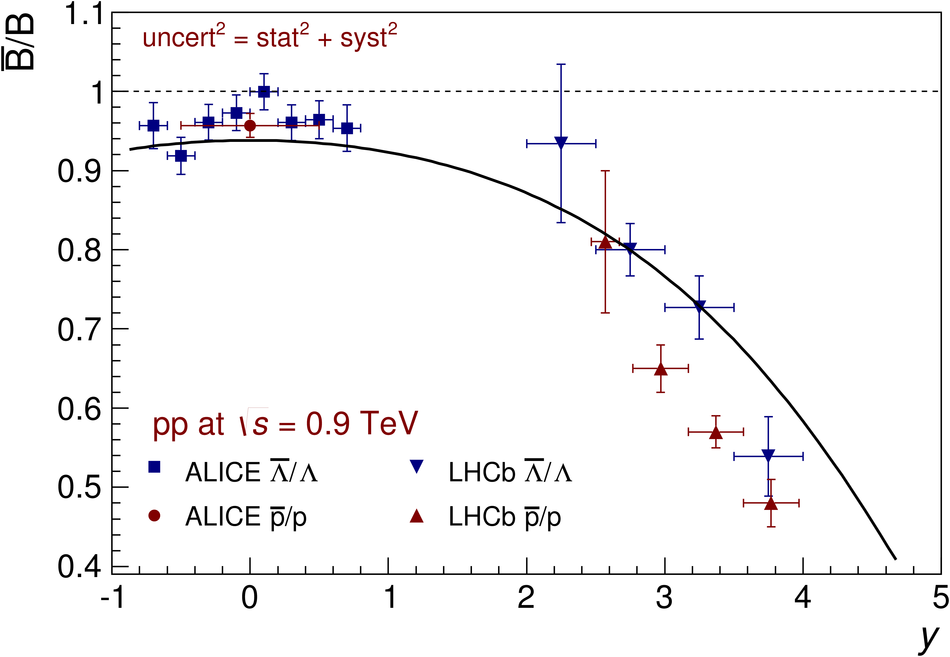
Figure 19
The $\pbarp$ ratio in pp collisions at $\sqrt{s} = 0.9$, $2.76$ and $7$ TeV as a function of the relative charged-particle pseudorapidity density. The data points are compared with prediction of PYTHIA (Perugia2011). The vertical bars (boxes) represent the statistical (systematic) uncertainty. Ratio of model to data is shown below using uncertainties added in quadrature. | 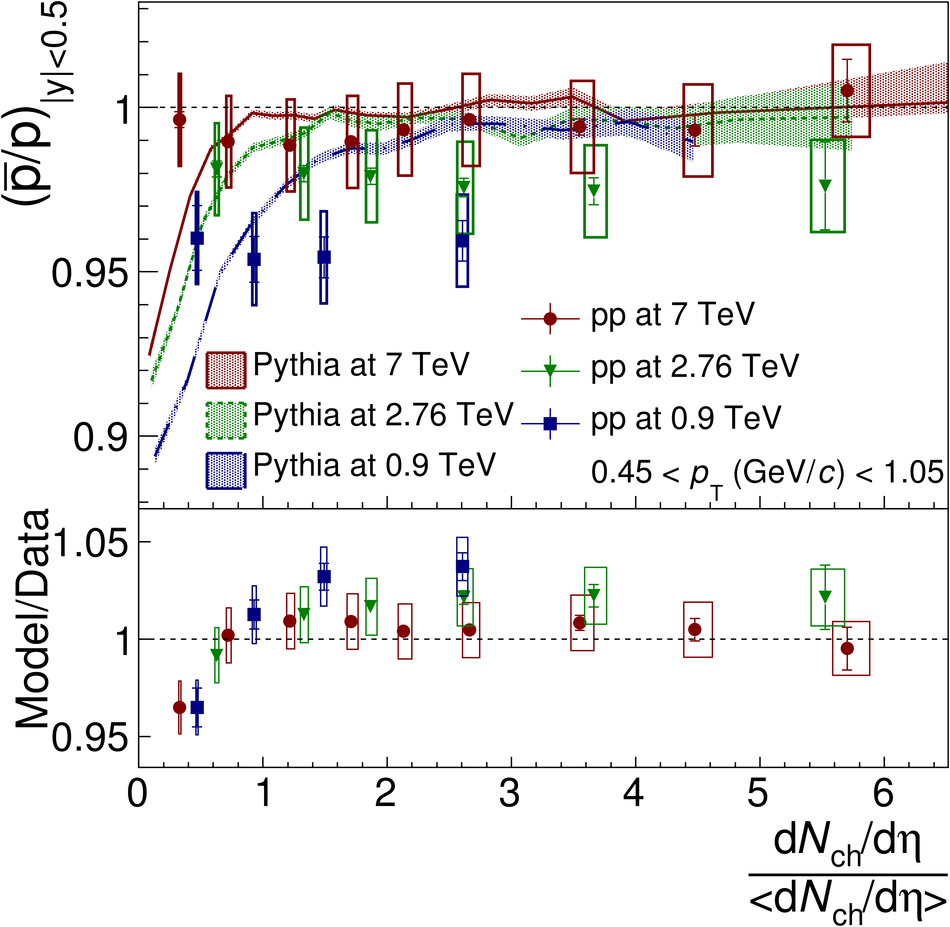 |
Figure 20
The $\LbarL$ ratio in pp collisions $\sqrt{s} = 2.76$ and $7$ TeV as a function of the relative charged-particle pseudorapidity density. The data points are compared with prediction of PYTHIA (Perugia2011). The vertical bars (boxes) represent the statistical (systematic) uncertainty. Ratio of model to data is shown below using uncertainties added in quadrature. | 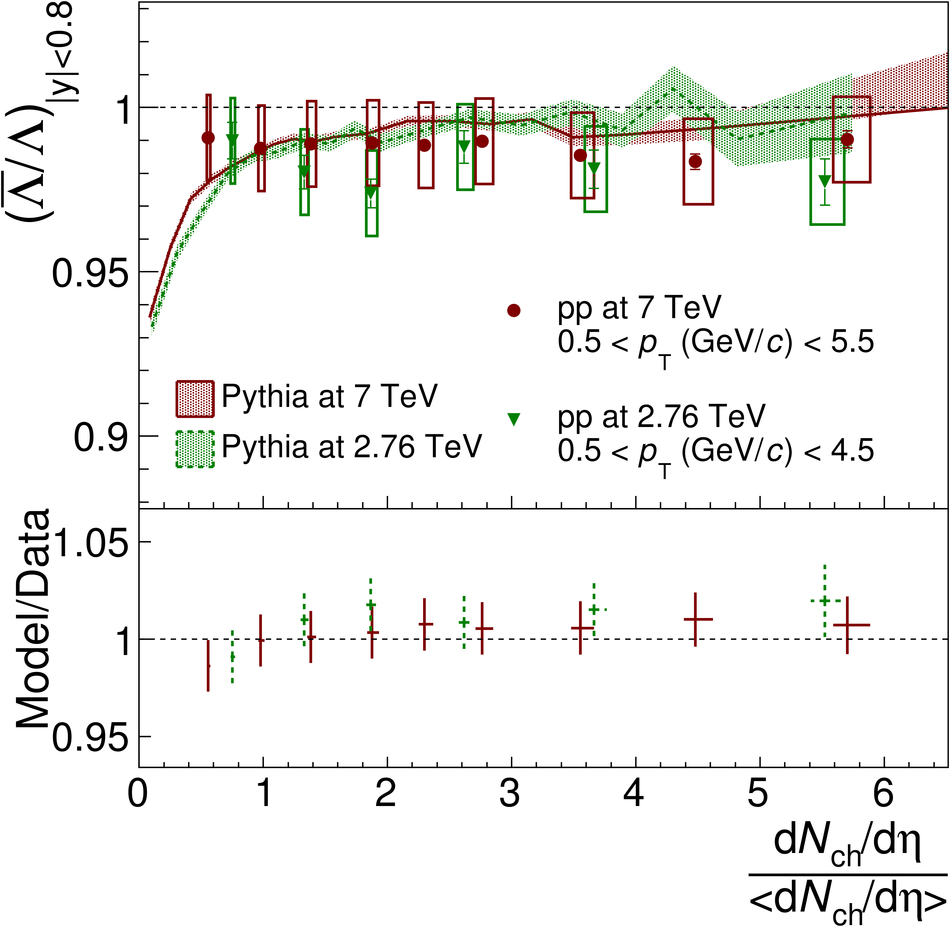 |
Figure 21
The $\XbarX$ ratio in pp collisions $\sqrt{s} = 7$ TeV as a function of the relative charged-particle pseudorapidity density. The data points are compared with prediction of PYTHIA (Perugia2011). The vertical bars (boxes) represent the statistical (systematic) uncertainty. Ratio of model to data is shown below using uncertainties added in quadrature. |  |