Transverse-momentum distributions of $\rm K^{*0}$ (a) and $\Phi$ (b) mesons in multiple centrality intervals with blast-wave fitting functions. The data are the bin-averaged yields plotted at the bin centers. The statistical uncertainties are shown as bars and are frequently smaller than the symbol size. The total systematic uncertainties (including $\pt$-uncorrelated and $\pt$-correlated components) are shown as boxes. | 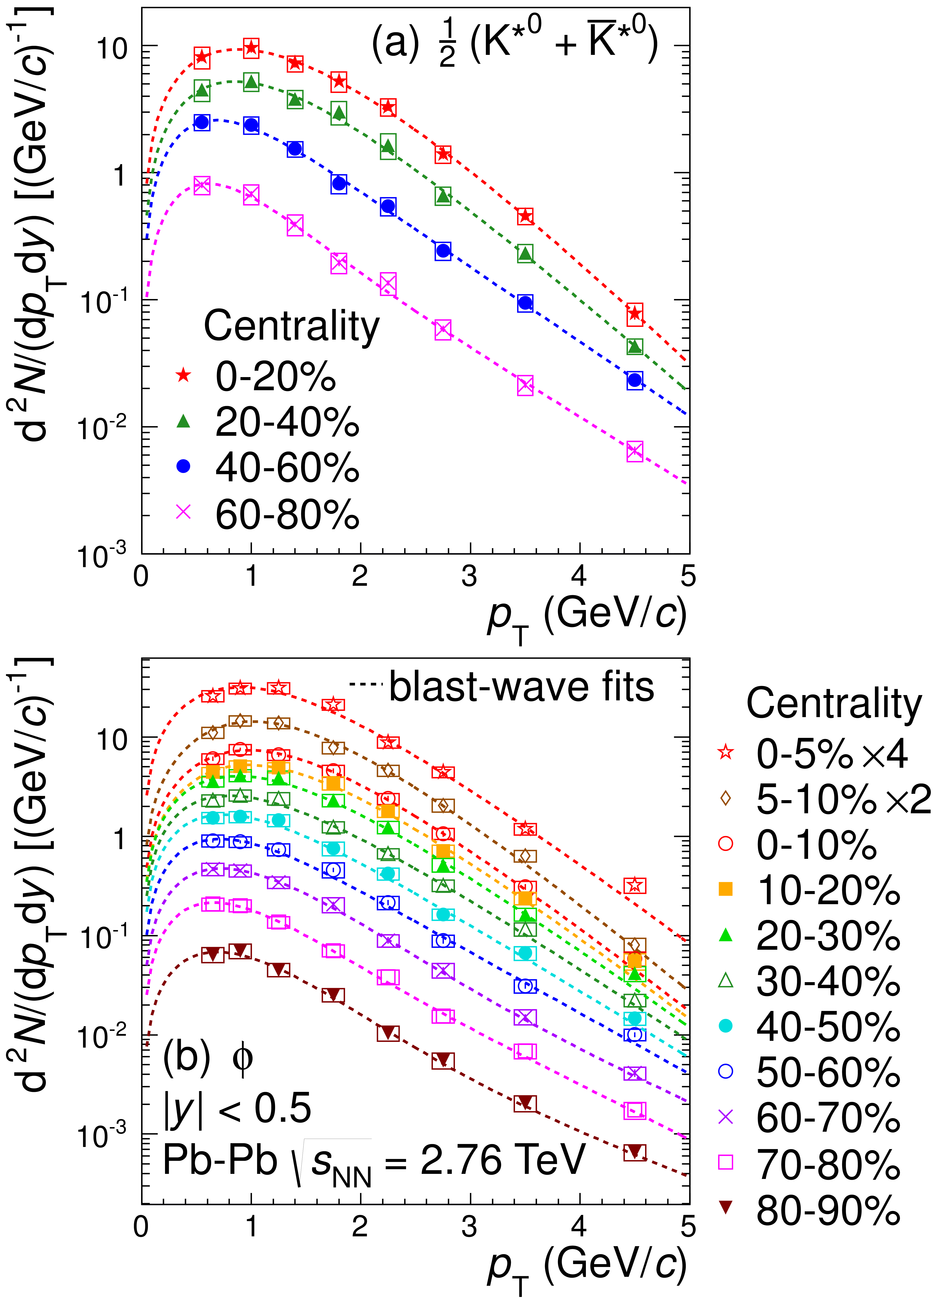 |