Example invariant-mass distributions for the $\Phi$ in the 0-10% centrality interval in two $\pt$ ranges: $0.8< \pt< 1$ GeV/$c$ [panels (a) and (b)] and $2.5< \pt< 3$ GeV/$c$ [panels (c) and (d)]. Panels (a) and (c) show the unlike-charge invariant-mass distributions for $\Phi$ with combinatorial backgrounds. The normalized mixed-event combinatorial background is within 0.5% (1%) of the unlike-charge distribution for the low (high) $\pt$ bin over most of the invariant-mass range shown here (with the exception of the $\Phi$ peak itself and $m_{\rm{KK}} < 0.995$ GeV/$c^2$ ). The statistical uncertainties are not visible given the vertical scale. Panels (b) and (d) show the invariant-mass distributions after subtraction of the mixed-event background (plotted with statistical uncertainties) with fits to describe the peaks of the $\Phi$ (solid curves) and residual backgrounds (dashed curves). In the interval $0.8 < \pt < 1$ GeV/$c$ ($2.5< \pt < 3$ GeV/$c$ ), the uncorrected $\Phi$ yield is 174,000 (149,000), or 0.11 (0.095) per event; the signal-to-background ratio is 0.01 (0.0035) and the significance of the $\Phi$ peak is 38 (21). | 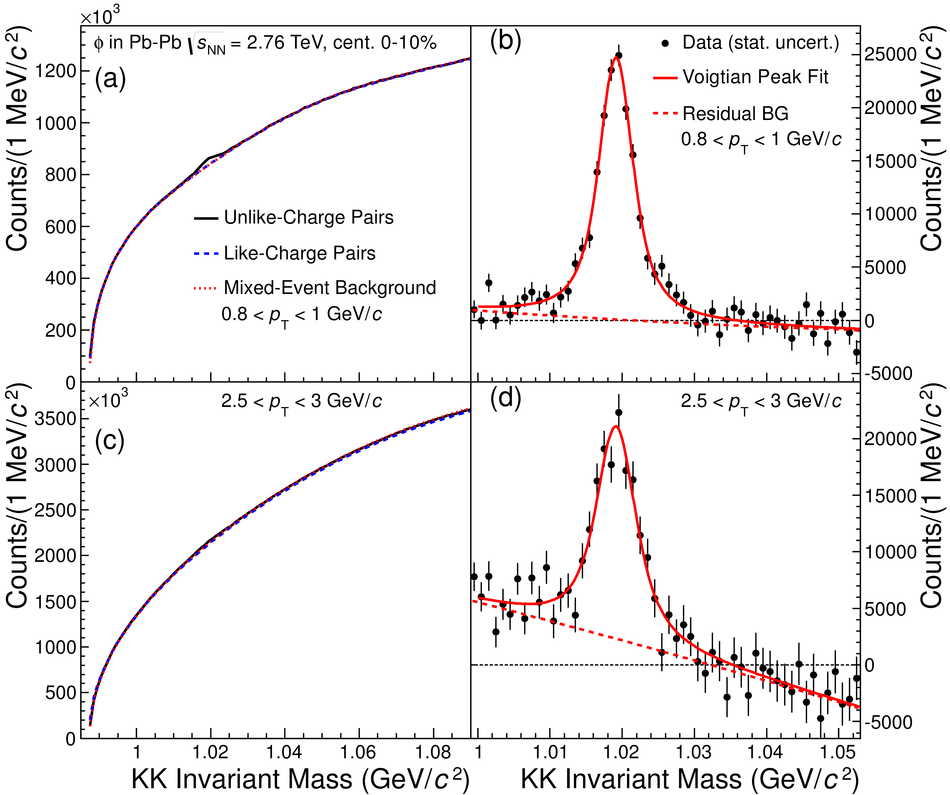 |