Probability distribution of $R_{\rm corr}$ (Eq. (18)) in two different intervals of $\sum_p$, measured in central (0-10%) and peripheral (70%-80%, left panel only) Pb-Pb collisions. Also shown are detector-level simulations for MB pp collisions based on PYTHIA (same distributions as Fig. 75), and for central PbPb collisions based on HIJING (left panel only). | 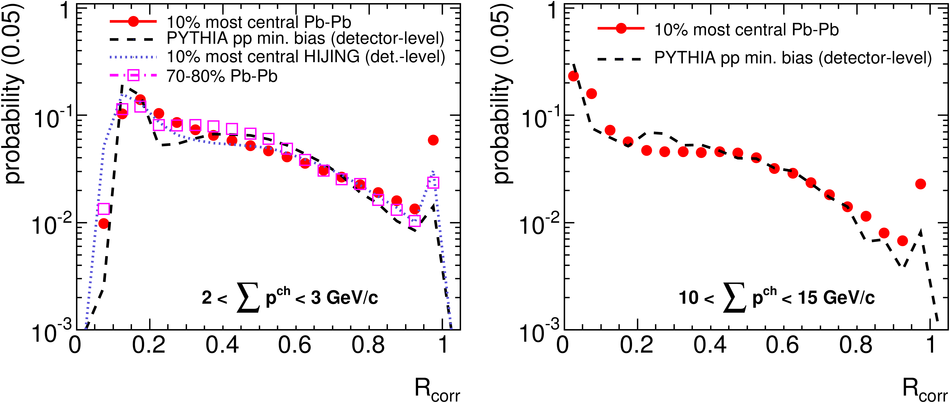 |