Reconstructed ${\rm \pi^0}$ peak width (a) and position (b) in 0-10% central Pb-Pb collisions at $\sNN$ = 2.76 TeV for PCM, PHOS, and EMCal compared to Monte Carlo simulations (Hijing for PCM, and embedding of clusters from single ${\rm \pi^0}$ in data for PHOS and EMCal). | 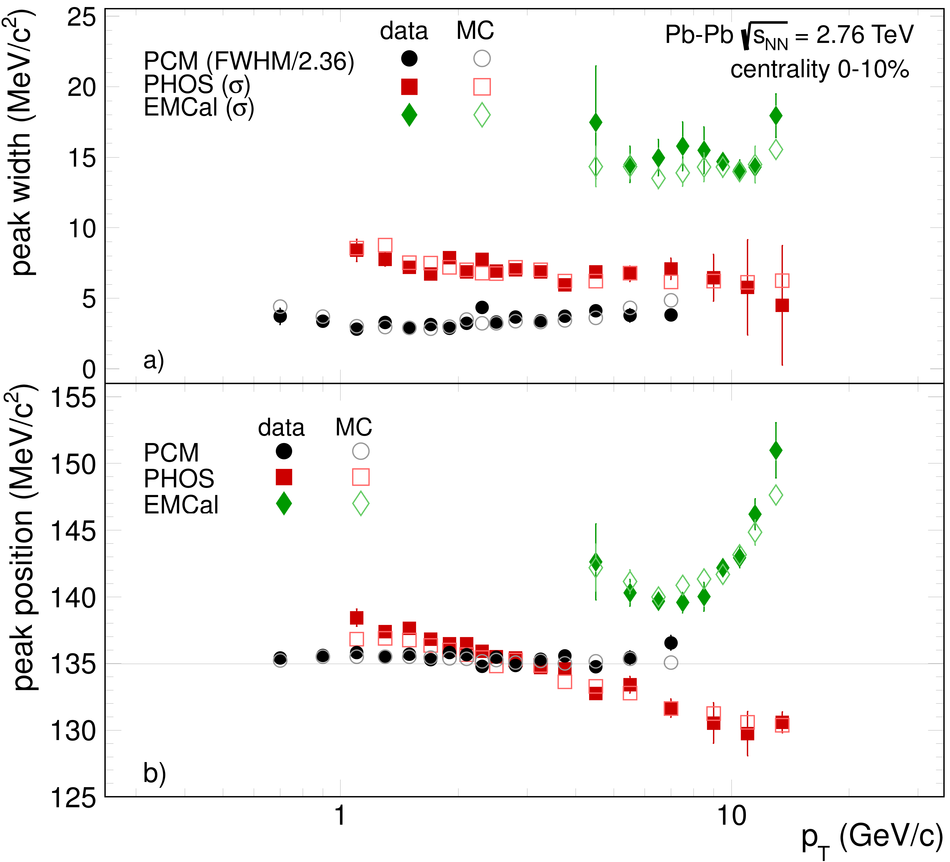 |
