
Fits of the measured \pP (upper row) and \ApAp (lower row) correlation functions in all multiplicity ranges and \mT range $[1.02, 1.14]\, \si{\gevcc}$ fitted with the RSM. The total fit with uncertainties is indicated by the blue band and the baseline with uncertainties is indicated by the red band. Statistical uncertainties are indicated by the vertical error bars and are smaller than the markers. Systematic uncertainties are indicated by the gray shaded boxes. The markers are positioned in each \kstar bin at the mean value of the underlying \kstar distribution and the horizontal lines indicate the standard deviation of the \kstar distribution within the bin. The deviation of the data points to the total fit in terms of standard deviations is shown in the lower panel. | 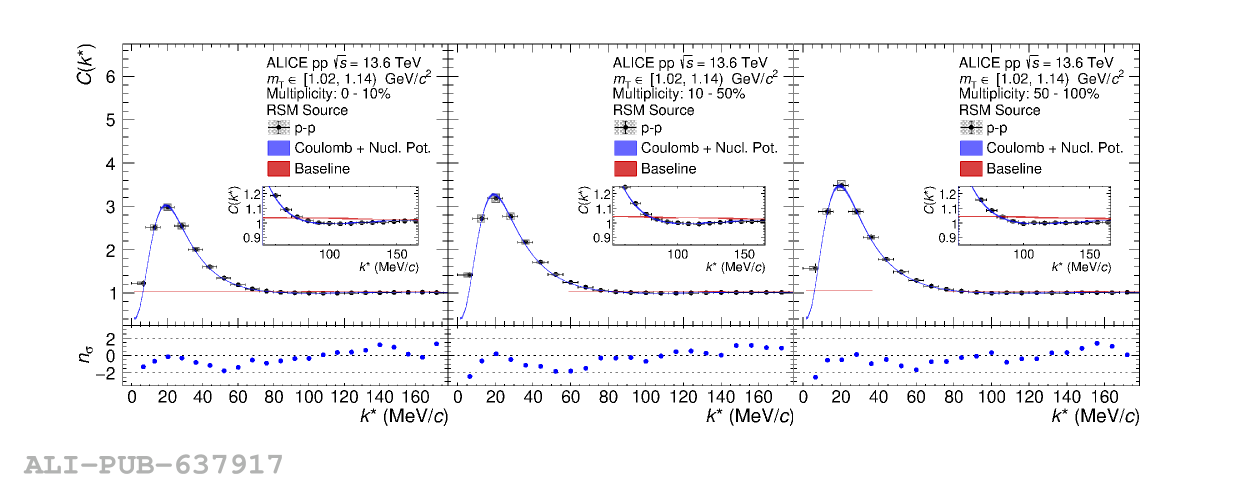 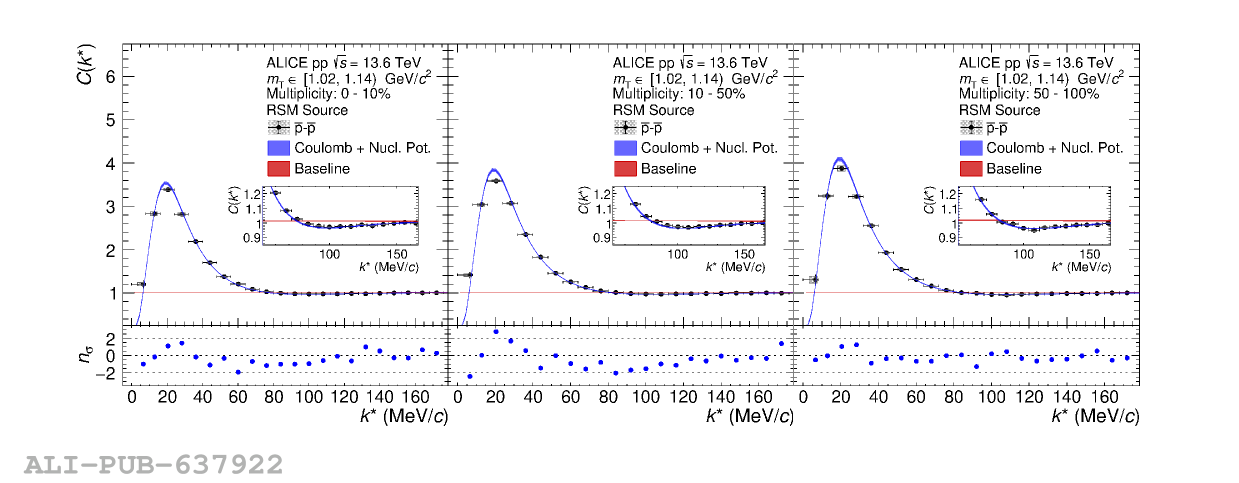 |