\ \icp\ ratio of the \Dzt distributions for \PbPb collisions at \snnfive in Fig. \ref{fig:Dzt} for data: 0--30\% over 50--90\% (red squares), and 30--50\% over 50--90\% (violet bullets). The boxes represent the systematic uncertainties, while the vertical bars indicate the statistical uncertainties. Also, the equivalent ratios from the NLO pQCD calculation for \PbPb collisions, including energy loss, are shown as a band indicating the theory uncertainty. | 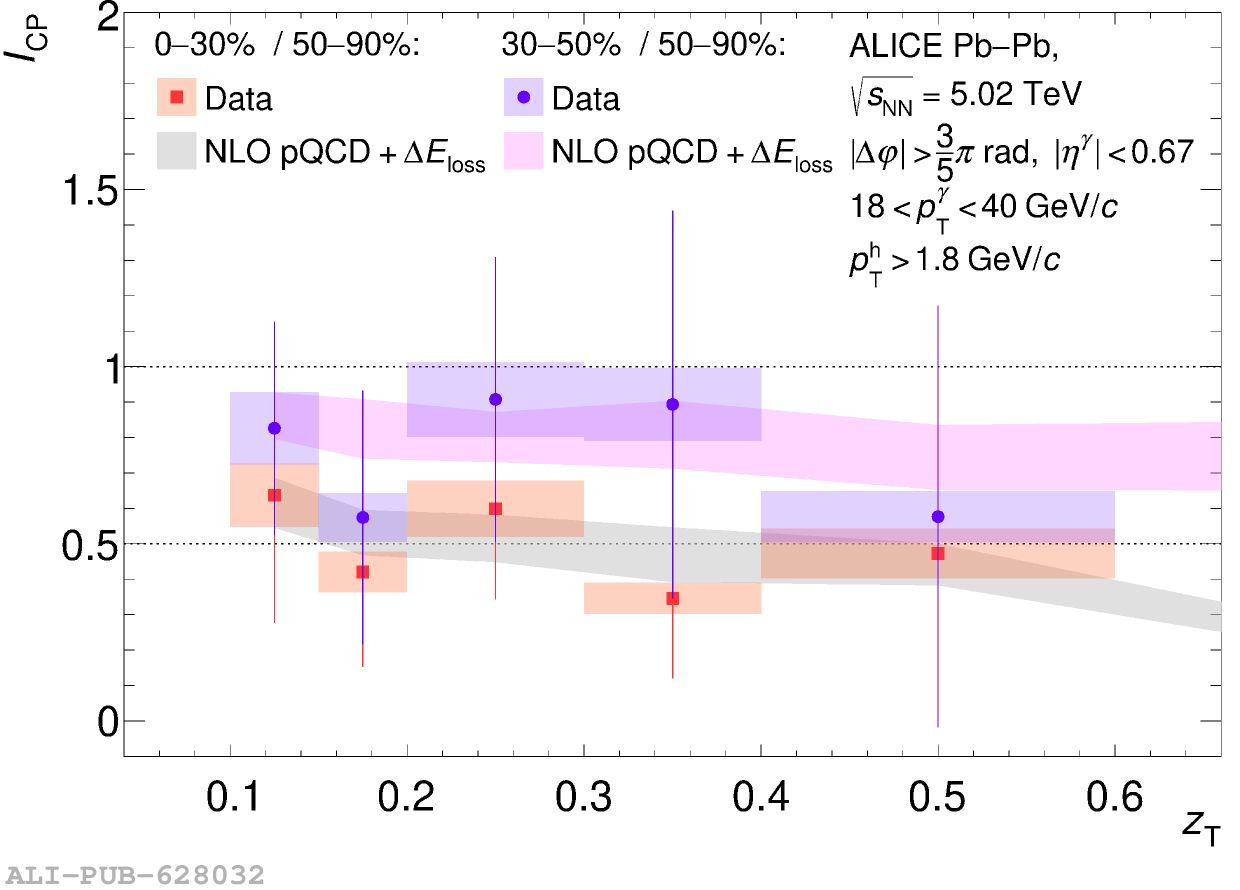 |